 Graceland Updates 4am-7am Graceland Updates 4am-7am
GDX Gold Stocks ChartWalk:
Buy Now!
Stewart Thomson
email: s2p3t4@sympatico.ca
Jun 19, 2009
1. GDX is the major index followed
for gold stocks. There is also the leveraged HGU which trades
on Toronto. My own view is that gold stocks are already leveraged
enough to the gold price that the use of additional leverage
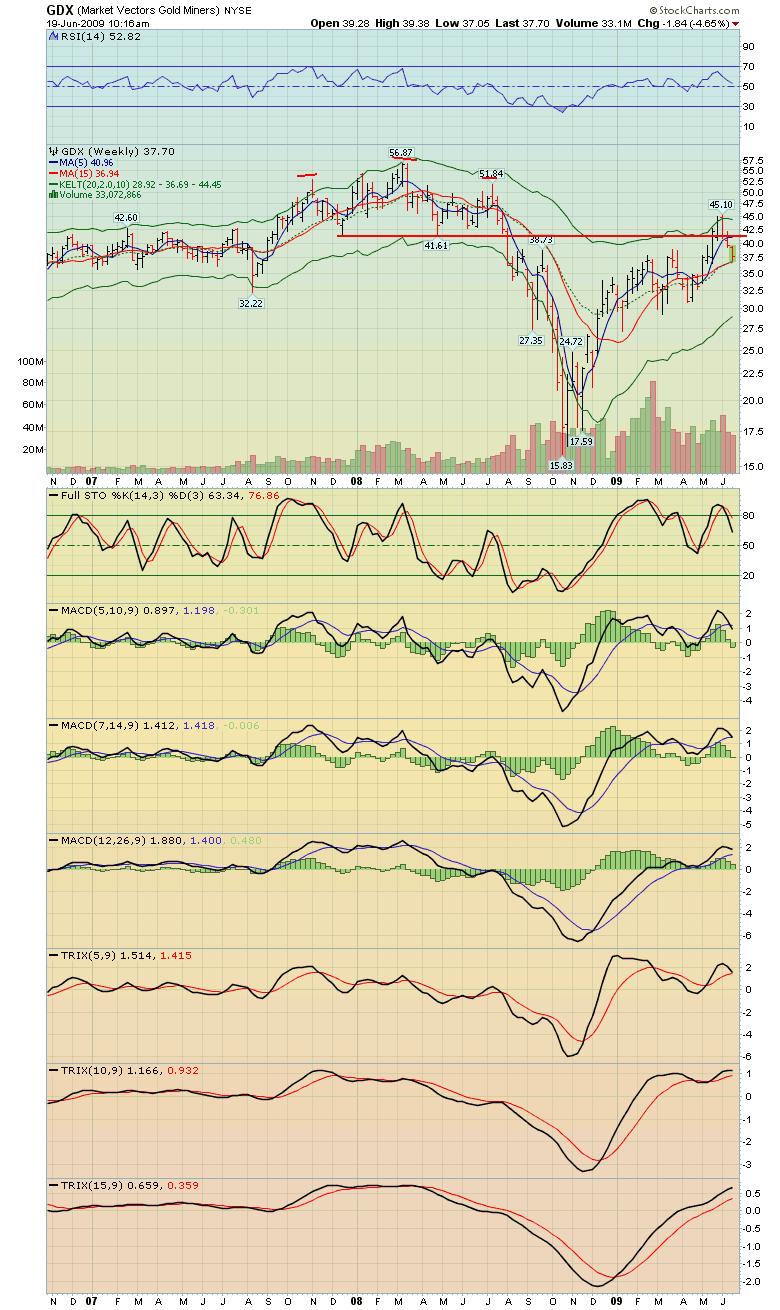
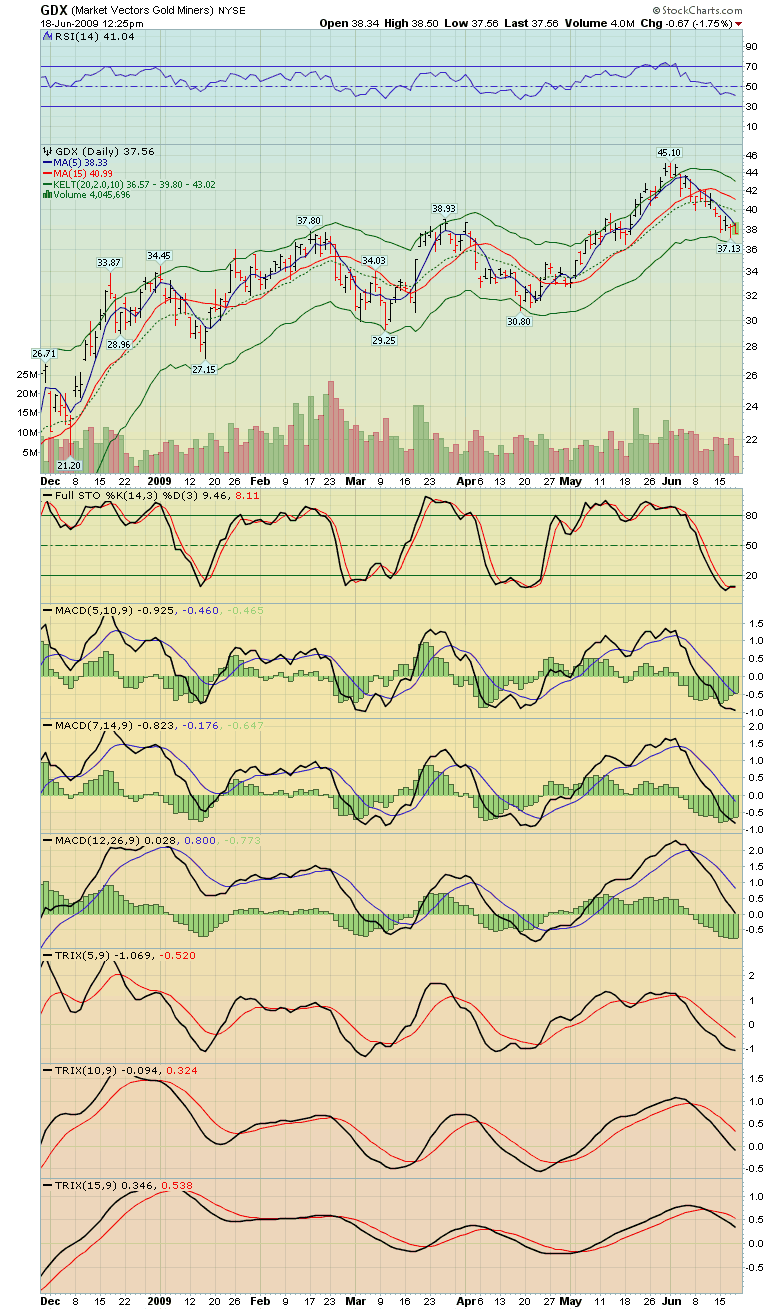
isn't really required, particularly if you are already down on
your existing positions. Leveraged funds have a time decay factor
that many investors don't really fully understand.
2. One of the big questions
for investors is whether to buy gold bullion or gold stocks.
I suggest both, but you need professional tactics to handle both.
The concern in regards to stocks is the memory of last year's
tumble in the Dow. The GDX index fell from a high of about 56
to a low of near 15, and did so in just 8 months. That is a loss
of aprox 80% while bullion only fell 30%.
3. The GDX has since rebounded
to about 45, and sits in the 38 area now. To get back to the
highs at 56 would require a move of approx 50% upwards.
While gold bullion would only have to rise about 10% to get back
to its highs.
4. It is important to realize
that if a stock falls a certain percentage in price, it must
rise by a much larger percentage than it fell by to get back
to the original level. Here's an example: Let's say you buy at
$30, and the stock falls to $20. That's a 33% decline in price,
or $10. To get back to $30, the stock must rise by 50%, from
$20 to $30. The dollar rise is the same, but not the percentage.
Stocks also fall faster than they rise. So it takes longer for
a stock to rise by the same percentage that it fell by.
5. Gold stock investors don't
want to get caught in a repeat of last year's situation, especially
if you are still down on many of your gold stock positions.
6. Looking at the GDX from
a technical perspective, there are many differences between the
current picture, and that of last spring. I'll highlight those
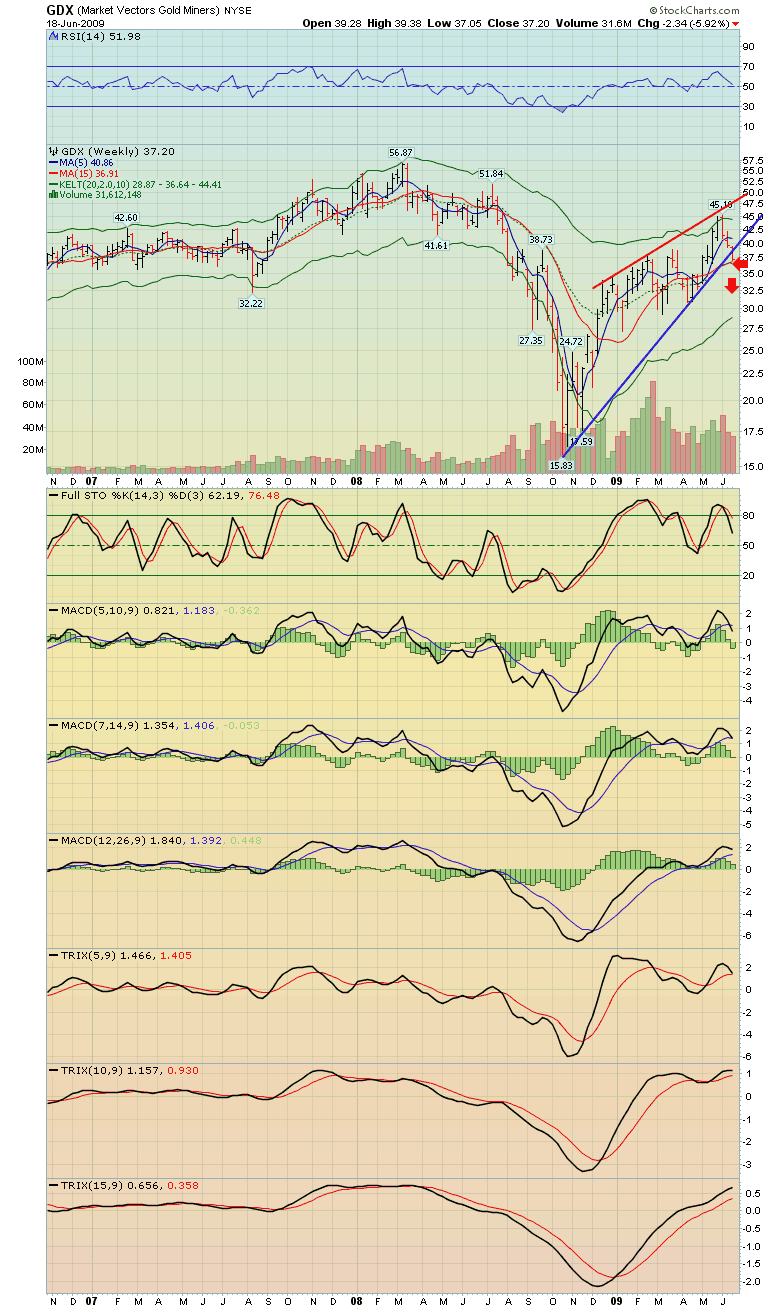
now. Here is the weekly chart.
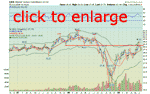
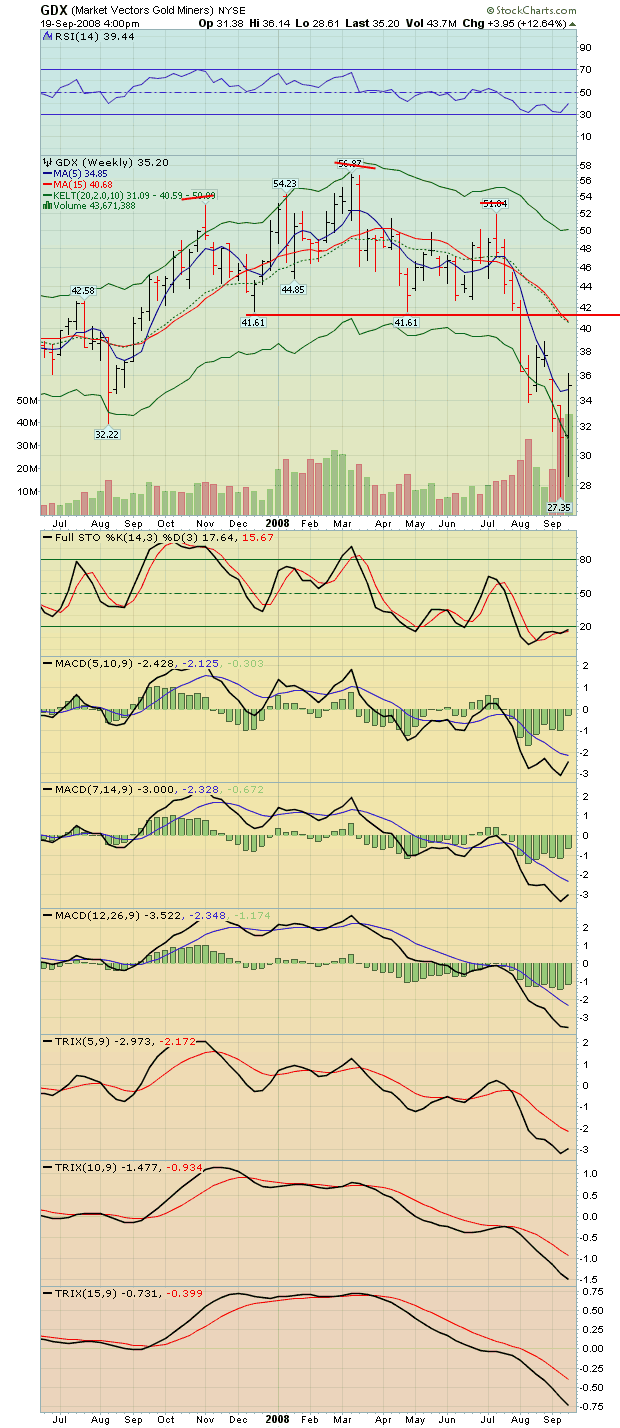
7. I have highlighted the period
of last spring with red markings. As the GDX rose to the 56 area
it created a technical pattern known as a head and shoulders
top. The neckline of the pattern is at the 41.61 area. A head
and shoulders top is an extremely bearish formation. [Editor's note: Sorry
to divert you but, whenever anyone writes about gold head and
shoulders patterns I just can NOT RESIST adding this, for our
lady readers - click]
8. Here's a look at the weekly
chart showing that top.
9. On the weekly chart you
can clearly see the head and shoulders top pattern and the neckline
at 41.61. The crash that followed was predicted by that technical
price pattern.
10. Now here's a look at the
current trading on the daily GDX chart. No such top pattern
exists. Further, the stochastics, MACD, and TRIX series of oscillators
are all in very oversold conditions. Relative strength is approaching
the 30 level.
11. There is no top pattern
here, just a simple decline down from 45 to 37.
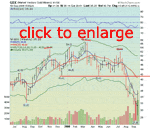
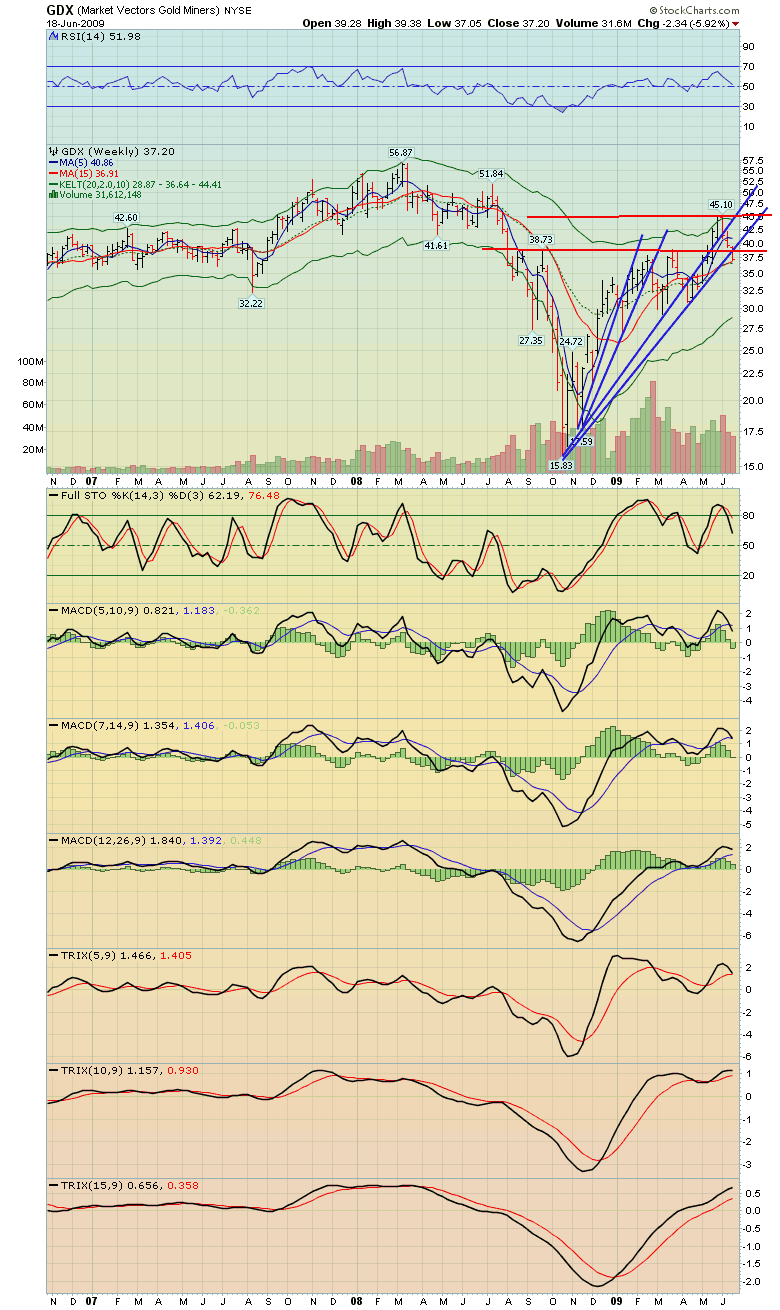
12. I want you to look at the
weekly again, this time covering the current period. The gold
stock bears see a rising wedge. They also note Stochastics failed
to make a new high while price did, and they point out a possible
coming sell signal in the MACD. Worse, the main uptrend line
has been broken. I've highlighted that break with a red arrow.
Here is what the bears see:
13. This is the markets. Nobody
knows anything for sure. No chart pattern or picture is a sure
thing. The "bear picture" is one possible reality,
yes.
14. Here's the bull picture:
There is no rising wedge. The picture is instead one of selling
caused by weak investors getting out "near breakeven".
These investors bought into and around the head and shoulders
top pattern area last year. Some bought more as it failed, thinking
they had a bargain. The current selling is those weak hands liquidating
as price has moved to the point of booking an "acceptable
loss". The uptrend has been broken, but the uptrend broke
several times before and price consolidated each time. This is
the 4th break and this low will set up a much strong uptrend
line.
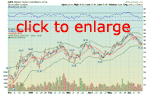
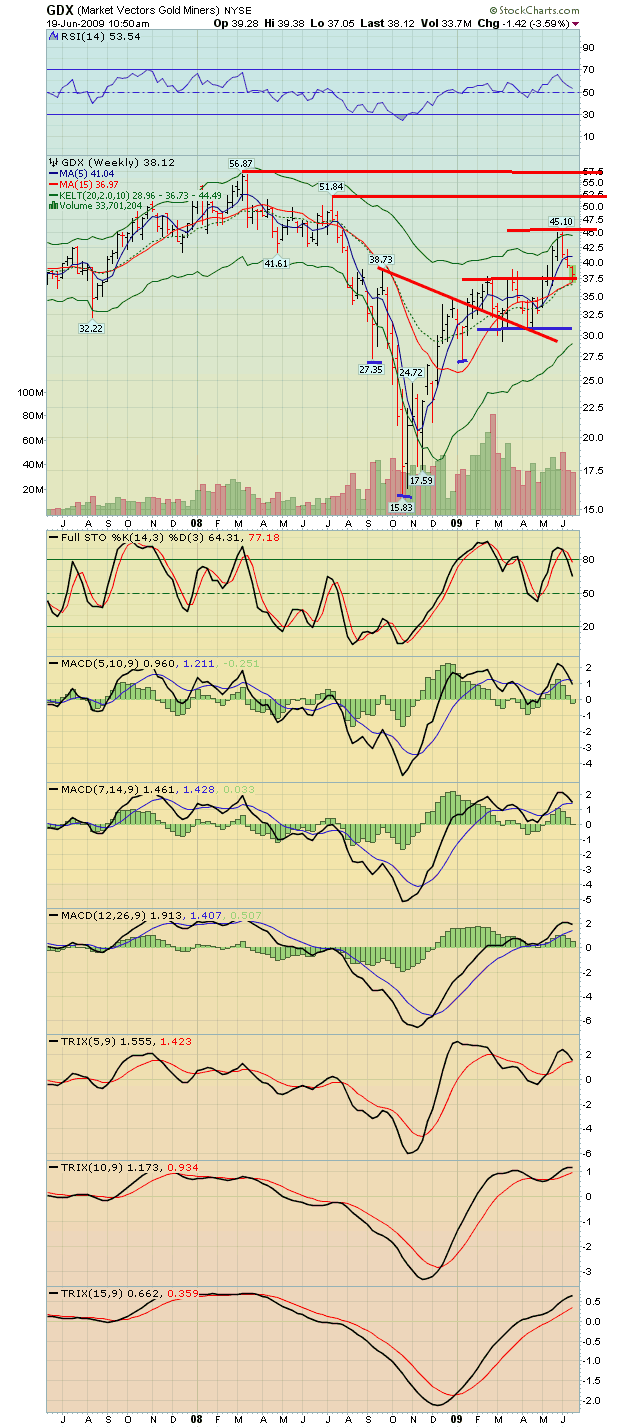
15. The main picture for the
bulls is a huge head and shoulders bottom with a confirmed breakout
followed by sideways consolidation. When price rises beyond the
45-56 resistance area, GDX will be in strong hands who bought
much lower, as the weaker investors get out at or near their
45-56 breakeven point. Here's the weekly chart as the bulls see
it. Note the red neckline in the 39 area. Price broke above that
and then consolidated since then:
16. I'm not in the bull camp.
Nor the bear camp. I'm in the "be prepared" camp. Meaning:
be prepared to act at any and all price points, regardless of
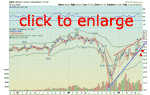
your outlook. Here's my own view of the weekly GDX chart:
17. Price broke out of a head
and shoulders bottom with a down sloping neckline. It then consolidated
between 30-39 before breaking higher to the 45 area. Price has
been driven back to the 37 area on selling by investors who are
taking "acceptable losses" on positions bought last
year. Probably in the range of 20-40% losses.
18. Price would have to decline
below 30 to destroy the bull picture, technically. Even then,
price could pull back to the downsloping head and shoulders neckline,
perhaps in the 25 area and keep the bull alive. A move back to
the neckline area is quite common with head and shoulders patterns.
19. Regardless of what happens,
I buy any and all price weakness. All the way to zero. I was
an aggressive buyer yesterday of gold items into price weakness,
and have been all the way thru this GDX weakness from 45 to 37.
Should price decline further, I will become even more
aggressive on the buy, not less!
20. I have mentioned the importance
of completing each week with VICTORY. When price is up, your
victory is measured by booked profits. If you think weekly victory
is measured by your weekly account value, you are dead wrong.
Thinking you can increase your account value when you are on
the BUY is a clownshow. Don't be a clown. Be a PROFESSIONAL INVESTOR.
When price is down, Victory is measured by increased ounces and
shares in your possession.
21. This is the eye of the
financial hurricane. The smaller front part (subprime resets
and blown OTC derivatives on those items) has hammered
the financial island. The resets have all but ended. The financial
stimulus packages are starting to have some effect. The recession
could technically end in the coming months. The numbers ARE improving,
that's a fact. Don't get into the mindset of ignoring real facts
to create a pretend reality of what you want to be real. You
are not a trillionaire banker. When the bankers paint charts,
they are doing it with real buys and sells. Gold bugs often paint
charts with their imagination, not a good idea.
22. 2009 has a high likelihood
of ending on a high note. The recession could REALLY end in the
coming months. It could be almost a dance party by the public.
All the coconut head investors and fund manager puppets dance
around repeating what the banker puppet masters tell them to
repeat. "The recession is over, printing $10 trillion and
handing it to the bankers saved us all!"
23. And then their dance party
comes to a horrific end as in comes the back end of the financial
hurricane, as we enter 2010. The public is totally ignoring the
tidal wave of insider selling going on right now in the stock
market. My own guess is we've experienced about 20% of
the total storm. The other 80% will rage thru 2010 and 2011 with
no mercy. People will do ANYTHING to get gold as the storm intensifies.
As always, there is only one question, and that question is:
Are you prepared?
###
Jun 19, 2009
Stewart Thomson
Graceland Updates
website: www.gracelandupdates.com
email for questions: stewart@gracelandupdates.com
email to request the free reports: freereports@galacticupdates.com
Tuesday 14th Jul 2026
Special Offer for 321gold readers: Send an email to freereports@galacticupdates.com and I'll send you my free “Gold & Silver Stocks Launchpad” report. I highlight four key CDNX miners that could surge 50% higher once the CPI and PPI report mayhem is over! Solid investor tactics are included in the report.
|
Graceland
Updates Subscription Service: Note we are privacy oriented. We accept cheques.
And credit cards thru PayPal only on our website. For your protection
we don't see your credit card information. Only PayPal
does.
| Subscribe via major credit cards
at Graceland
Updates
- or make checks payable to: "Stewart Thomson" Mail
to: Stewart Thomson / 1276 Lakeview Drive / Oakville, Ontario
L6H 2M8 / Canada |
Stewart
Thomson
is a retired Merrill Lynch broker. Stewart writes the Graceland
Updates daily between 4am-7am. They are sent out around 8am. The
newsletter is attractively priced and the format is a unique numbered
point form; giving clarity to each point and saving valuable
reading time.
Risks, Disclaimers,
Legal
Stewart
Thomson is no longer an investment advisor. The information provided
by Stewart and Graceland Updates is for general information purposes
only. Before taking any action on any investment, it is imperative
that you consult with multiple properly licensed, experienced
and qualifed investment advisors and get numerous opinions before
taking any action. Your minimum risk on any investment in the
world is 100% loss of all your money. You may be taking
or preparing to take leveraged positions in investments and not
know it, exposing yourself to unlimited risks. This is highly
concerning if you are an investor in any derivatives products.
There is an approx $700 trillion OTC Derivatives Iceberg with
a tiny portion written off officially. The bottom line:
Are
You Prepared?
321gold Ltd

|
