|
|||
A Mid Week Report on GoldErich K. Soltes This is explanation of varies technical indicators that make up the Alpha Trend System. In the lower window of the chart you will see the following indicators. The main trend line for a security is the Alpha Trend this is denoted by the bold red line. It is from this trend line that all other support/resistance lines are developed. The Alpha Trend is an adaptive moving average that uses proprietary mathematical formulas to create the base line movement of the selected security. From the Alpha Trend I then created three separate progression/regression price areas using Fibonacci ratios, which I call the 1st Alpha waves, 2nd Alpha waves and 3rd Alpha waves. It is these three wave areas that define the vast majority of a security's price movement. Moving out from the Alpha Trend, the 1st Alpha waves are denoted by the dark blue lines. This is the price range that a security will normally move to once the price of the Alpha Trend line is crossed in either direction. Next are the 2nd Alpha waves which are denoted by the light blue lines. It is this area between the 2nd Alpha waves where 79.82% of the time a security's price will remain. Last are the 3rd Alpha waves which are denoted by the violet lines. Once a security's price reaches this area it is in an extreme overbought/oversold condition. A security can stay in this area for awhile, but this usually represents a poor price in which to place a trade in the prevailing trend. The next three moving averages are the one year moving average of the Alpha Trend denoted by the bold violet line, the five year moving average of the Alpha Trend denoted by the bold green line, and the ten year moving average of the Alpha Trend denoted by the bold blue line. Each of these moving averages is set for the different time frames of a chart. On the daily chart the one year moving is 240 days, the five year is 1200 days and the ten year is 2400 days. On the weekly charts the one year moving average is 52 weeks, the five year moving average is 260 weeks and the ten year moving average is 520 weeks. Lastly, for the monthly charts the one year moving average is 12 months, the five year moving average is 60 months and the ten year moving average is 120 months. In the upper window is my own relative strength indicator denoted by the bold blue line. This indicator measure the strength of the trend, "0" is overbought and "-100" is oversold. This indicator measures the strength of the price movement between the 3rd Alpha waves. 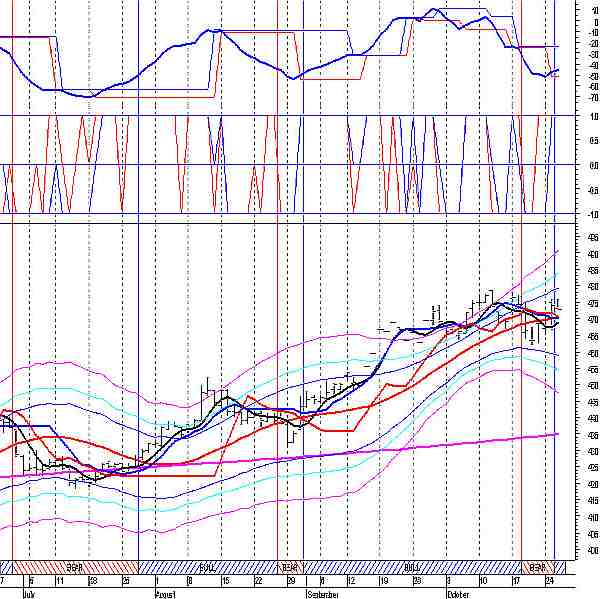 Above is the daily chart for Gold. On October 26 Gold's trend turned bullish, also for the last three days Gold has remained above the Alpha Trend support line. Last week's pullback in Gold was so weak it was unable to reach the lower 1st alpha wave band which is a Fibonacci ratio of the Alpha Trend. Since March of 2005 each of Gold's pullbacks to the lower 1st Alpha wave band has resulted in a rally to the upper 3rd Alpha wave band, again another Fibonacci ratio of the Alpha Trend. Currently, the 3rd Alpha wave band is at $490. Over the next few weeks Gold should rally to at least this price resistance area. One of the interesting patterns from my charts is that the relative strength indicator has been holding above the mid point range of -50 on the last two major pullbacks. This indicates that the long term Gold bull market is still going strong. Lastly, for the Daily Chart of Gold is that the one year moving average of the Alpha Trend has been a major support since September 24, 2001. This trend line has been moving up since that time. Also Gold has not spiked very far in percentage terms from the one year moving average of the Alpha Trend, which also suggests that this market is not ending anytime soon. 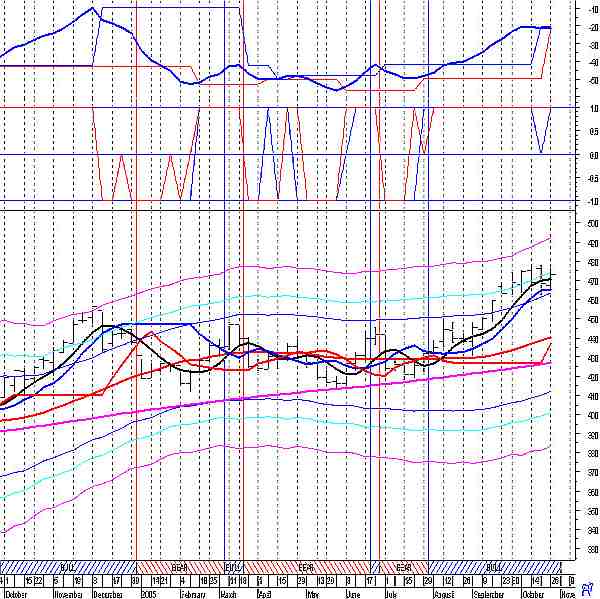 Above is the weekly chart for Gold. The weekly chart for Gold makes in even a better case that Gold is still bullish. Last week Gold pulled right back to the upper 1st Alpha wave band, additionally so far this week Gold has held above this same support price. Along with this, the relative strength indicator still has not reached an overbought level. Both of these facts taken together support the conclusion that Gold will continue to rally up to the $490 price range. The one year moving of the Alpha Trend has been rising since the start of 2002. This moving average is a major support line, since January 2002 there has been six pullbacks to this trend line. Every rally from this trend line has continued to move up to the 3rd Alpha wave band. On July 22, 2005 Gold pulled back to within 0.3% of the one year moving average of the Alpha Trend, since then Gold has been moving up to the 3rd Alpha wave band currently at $491.92. As we move forward whenever Gold returns to back to the one year moving average of the Alpha Trend this will present a great buying opportunity. In conclusion, the Secular bull market in Gold is still going strong. With the Daily chart of Gold turning bullish and holding above the Alpha Trend this market should continue moving up to the upper 3rd Alpha wave band price of $490. The Weekly chart is also showing a continuation of this Secular bull market in Gold. With the current strength in Gold it should continue moving up to the upper 3rd Alpha wave band price of $491.92. The first support for Gold on the Daily chart is the Alpha Trend price of $470.25. On the weekly chart the first support is the upper 1st Alpha wave band price of $463.39. If that level fails to hold the next support price is the Alpha Trend line currently at $440.52. 26 October, 2005 About Erich Soltes A graduate of Brookfield High School in Brookfield CT and an Eagle Scout, Erich went on to graduate from SUNY Maritime College in New York City in 1988, with a BS in Marine Transportation and a minor in Economics. For the next ten years he was a Navel Reserve officer and a Merchant Marine officer. In 1998 he went to work on Wall Street obtaining his series 7, 63 and 65 licenses. He worked both as a stockbroker and a financial planner helping clients obtain their financial goals. In 2004 he was able to finally reach his goal of developing a mathematical trading model that could beat the "buy and hold" method of investing. In mid 2005 the Alpha Trend Analysis website was created. For more information on the Alpha Trend System and the daily newsletter please go to alphatrendanalysis.com. DISCLOSURE: Erich K. Soltes is the Owner of Alpha Trend Analysis, which contains the opinions of E. K. Soltes, and is provided for informational purposes only. Neither Erich Soltes nor Alpha Trend Analysis, provide individual investment advice and will not advise you personally concerning the nature, potential, or value of any particular stock or investment strategy. To the extent that any of the information contained in this article may be deemed investment advice, such information is impersonal and not tailored to the investment needs of any specific person. Past results of Alpha Trend Analysis, or E. K. Soltes are not necessarily indicative of future performance. Erich Soltes, entities that he controls, family, and associates, may have positions in securities mentioned in this article and may close them at any time. Alpha Trend Analysis does not represent the accuracy, nor does it warranty the accuracy, completeness or timeliness of the statements made on its web site or in its email alerts. The information provided should therefore be used as a basis for continued, independent research into a security referenced in this article so that the Subscriber forms his or her own opinion regarding any investment in a security mentioned in it. The Subscriber therefore agrees that he or she alone bears complete responsibility for his or her own investment research and decisions. We are not and do not represent ourselves to be a registered investment adviser, or advisory firm or company. You should consult a qualified financial advisor or broker before making any investment decision and to help you evaluate any information you may receive from this article. Consequently, the Subscriber understands and agrees that by using any of Alpha Trend Analysis services, either directly or indirectly, Alpha Trend Analysis shall not be liable to anyone for any loss, injury or damage resulting from the use of, or information attained from Alpha Trend Analysis or any of its services.
321gold Inc |
