|
|||
Gold Shakeout Coming?Boris Sobolev Gold Frustrates Most Bulls In following a large number of gold bulls (newsletter writers, market commentators and technical analysts), we are noticing a persistent increase in bearishness. The most esteemed analysts who just last fall proclaimed $700/oz for December 2006 and $850/oz for 2007 are now convinced that for the short to intermediate term, gold will continue to suffer. Many forecast $570 and a few as low as $500 in the next few months. Some, who were the first ones to announce the gold bull market several years ago, have now thrown in the towel and called an end to the long term bull market in gold. The pragmatic Kitco cut its average gold price forecast for the year down to $655 an ounce from an earlier estimate of $690. Most other widespread media have already buried gold. Of course, this is happening at the same time when many broad market indices are making all time highs. We believe that the best explanation behind the plunge in sentiment is simply a prolonged nature of the trading range in gold. Many traders have suffered big losses and are using any strength in gold to unload their positions. Those that have tried to pick tops and bottoms have probably fared the worst. Those that looked for value in the last year have been the winners. In the last few months alone, several undervalued stocks in the RSG Database have been snapped up in a wave of merger and acquisition activity. Value hunters have benefited from this greatly. Just recently, CLG, UUU.V, EMU and UMN.TO were purchased or offered to be purchased by their larger competitors at hefty premiums. Many Negative Expectations are Priced-In With the sentiment as low as it is, much of the negativity is already priced-in gold. There are five major factors in particular:
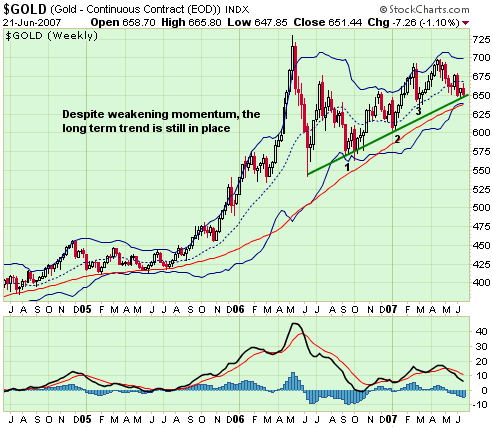
We believe that all of the above factors are mostly priced-in. So what could move gold from here? What Else Could Happen? Significant further downside could result if the T-bonds, after consolidating at current levels for a short period, continue their slide. Under the general market pressure, the initial gold reaction will be negative. But for the intermediate to long term, we believe this would ultimately be a bullish development. For a more detailed analysis see previous article. Significant upside could result from unexpected geopolitical developments. Forecasting these developments is very difficult, if not impossible. Bottom line: Consolidation in gold will continue this summer, but downside should be limited - maximum of 5-7% is our best guess. Additional downside is possible but much less probable. Starting September through November, we should see the beginning of a big or even dramatic move to the upside. Gold Technical Picture The weekly chart below shows that gold remains in a clear uptrend. Strong levels of support are marked by the 65-week moving average (red line) and the Bollinger bands (blue lines). In the last five years, gold has never meaningfully penetrated these levels of support. When gold did touch the moving average or the lower Bollinger band, it quickly recovered. Both the moving average and the lower band are now in the $630s, contributing to a very strong support level.  The March low (point 3 on the chart) of $634.50 coincides with these support levels as well. There are probably a large number of sell stop orders at around that level, so a movement below would trigger a large decline, probably to early January levels (point 2). $600 to $610 level is the maximum downside - around 7% from today's levels. We are more concerned, however, that if gold does not actually reach our maximum downside levels and instead proceeds higher, we may miss a number of buying opportunities while waiting for the gold decline that never comes. Therefore, we are now starting selective buying. This is a fragment from the RSG Newsletter originally posted on June 17, 2007. Resource Stock Guide (RSG) provides a free dynamic database for over 120 gold, silver and uranium companies. Stock, metal and currency prices are updated daily; company resources, costs, finances, etc. are updated within 2 to 5 business days after their release. Premium Services including the Newsletter are also available. Jun 23, 2007 Disclaimer: The above information in this article pertaining to investing, stocks, securities must be understood as information provided and not investment advice. The information provided by Resource Stock Guide is obtained from sources believed to be reliable but is not guaranteed as to accuracy or completeness. Resource Stock Guide advises all readers to seek advice from a registered professional securities representative before deciding to trade in stocks featured on Resource Stock Guide or any stocks for that matter. All statements and expressions of the companies featured are not meant to be a solicitation or recommendation to buy, sell, or hold securities. Copyright © 2006-2007 Resource Stock Guide, All rights reserved. |
