|
|||
The “Least Loved” Bull Market Becomes EuphoricGary Dorsch After nearly six years of unprecedented intervention by the world’s top central banks, the world’s financial markets are hopelessly broken. What used to be accepted as market gospel and guided investors’ decisions in the marketplace, before the 2008 financial crisis, - no longer seems to apply in today’s marketplace. Wall Street is no longer the bastion of free and open markets, where the prices of bonds and stocks are determined by the collective judgment of millions of investors. Instead, market prices are determined by a handful of political appointees, called central bankers, who pull the levers and intervene from behind the scenes, in an effort to influence the direction of the markets. Playing by the older and more traditional set of rules of investing (prior to 2008) has caused many astute investors to miss out on some of the biggest gains in Wall Street’s history. The “Least Loved” Bull market is now 63-months old, and it’s the fourth longest money minting rally in history. It’s still running on steroids, with the S&P-500 index having nearly tripled from its Great Recession nadir, and is now zeroing in on the once unthinkable 2,000-level. The Dow Jones Industrials are clawing their way higher, and are within spitting distance of the psychological 17,000-level. The faithful Buy-and-Hold – and dollar cost averaging investor, is enjoying the ride, having cast aside the frightful memories of six years ago. Strangely though, even as the US-stock market indexes soar to new stratospheric heights, the trading volume in the most actively traded exchange traded fund – based on the S&P-500 index, (ticker symbol; SPY) has plunged by roughly -60% compared with a year ago. Investors are more content to let their Bullish bets ride rather than to add to their exposure to the market. Who is the biggest buyer in the marketplace today, with an unrelenting bid, that buys on all dips? The answer is: Corporate America. Amid such thin market conditions, the S&P-500 companies can buoy the market, with a few big blocks of buybacks. And further dispelling investors’ fear of heights, there’s the safety net of the secretive “Plunge Protection Team” (PPT) that rescues the index funds when risky bets go sour. The aging Bull market on Wall Street is dubbed the “Least Loved” Bull, because it’s been accompanied by the weakest economic recovery from a recession since the 1930’s. Since the recovery officially began in June 2009, the US-economy has been crawling ahead at an anemic +2% growth rate, or less than half the vigor of the typical rebound from a recession since 1946. The rapidly expanding wealth on Wall Street, mostly flowing to the Richest-10% of US-households, hasn’t trickled down to the average household – take home pay of $839 a week in April ’14, was only +$20 higher than in January 2008, when adjusted for inflation. What skeptics of the “Least Loved” Bull market have failed to realize over the past 5-years is that the Federal Reserve has turned the stock market upside down, making bad economic news a reason to buy stocks, and good economic news a reason to sell them. The distortion keeps the real value of assets obscure and stuck in the “Twilight Zone.” The answer to this bizarre market behavior is simple: the stock market is being ruled by the Fed, not by fundamentals. In simple terms, what matters to the stock market is the easy money from the Fed, not the performance of the companies whose stocks they are buying and selling. Indeed, the Bank of International Settlements (BIS) warned a year ago, on June 6th, 2013, “the equity markets are under the spell of monetary easing policies that have enabled market participants to “tune out signs of a global growth slowdown.” Investors are able to shrug off weak economic data and instead, continue to bid stock prices higher, “amid the prospect of further central bank stimulus. Abundant liquidity and low volatility fostered an environment favoring risk-taking and carry trade activity,” the BIS observed. As recently as May 20th, 2014, Philly Fed chief Charles Plosser lamented, “It’s the Fed’s fault that the markets are ignoring the fundamentals.” “Since the onset of the financial crisis, central banks have become highly interventionist in their efforts to manipulate asset prices and financial markets in general, as they attempt to fine-tune economic outcomes. This approach has continued well past the end of the financial crisis. While the motivations may be noble, we have created an environment in which “it is all about the Fed.” Market participants focus on how the central bank may tweak its policy, and central bankers have become too desirous of managing prices in the financial world,” he said. “I do not see this as a healthy symbiotic relationship for the long term. If financial market participants believe that their success depends primarily on the next decisions of monetary policymakers rather than on economic fundamentals, our capital markets will not deliver the economic benefits they are capable of providing (ie; accurate price discovery). And if central banks do not limit their interventionist strategies and focus on returning to more normal policymaking aimed at promoting price stability and long-term growth, then they will simply encourage the financial markets to ignore fundamentals and to focus instead on the next actions of the central bank,” Mr Plosser said.
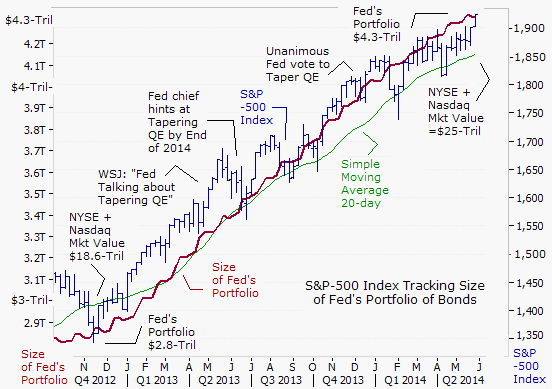
It’s all about the Fed – During the tenure of the BernankeFed – the US-central bank shifted its focus from central banking to central planning, from smoothing the business cycle to micro-managing the markets and financial engineering. The trading desk that controls the formerly free capital markets is situated on the ninth floor of 33 Liberty Street, also known as the home New York Fed. From a glass-enclosed conference room situated next to a small cluster of trading desks the uber-secretive “Plunge Protection Team” (PPT) controls the money flows that determine the daily fate of credit, equity and virtually all other markets, that have now been hijacked by the central planners at the White House and the US Treasury. As the number of shares traded each day in stock market dwindles to a six year low, the PPT has become an even more influential price setter in the stock market. The PPT concentrates its firepower in the Dow Jones Industrials futures market, which in turn, can move the S&P-500 index several points, with trading volumes as pathetically low as they are today. The biggest winners in the financial markets last year were traders that respected the old axiom, “Don’t Fight the Fed.” They rode the QE gravy train, and kept their bets focused on the increasing size of the Fed’s portfolio of bonds. Under the cloak of “Infinity QE” – the Fed injected $1.5-trillion into the coffers of its agents on Wall Street, which in turn, was funneled into the stock market, and inflated the market value of NYSE and Nasdaq listed stocks by $6.5-trillion to a record $25-trillion today. Since the Fed fist launched QE in Sept ’08, the central bank has increased its portfolio of bonds by $3.45-trillion, while the value of US-listed shares has increased $15-trillion. In other words, for every $1 of QE, the Fed increased the wealth of shareholders by $4.35. The Fed’s propaganda artists say the QE injections didn’t fuel market bubbles, because the monies were bottled up at the Fed itself, in special reserves accounts, which have captured most of the QE monies. However, the chart above tells a different tale. It shows a +87% degree of correlation between the growing size of the Fed’s bond portfolio and the increasing value of the S&P-500 index. There has a been few periodic pullbacks in the S&P-500 index along the way to the 2,000-level, but they were all very brief, and only served as better buying opportunities for Bullish traders that kept their focus squarely on the size of the Fed’s portfolio. Last year, every bit of news that did not fit the Bullish narrative was downplayed and soon forgotten. Even after racking up a stellar +28% gain for all of 2013, the biggest annual gain in 16-years, the “Least Loved” Bull market was easily able to shrug-off news of a -1% contraction in the US-economy in Q’1 of 2014. Proving for the umpteenth time that a weak economy does NOT translate into a weaker stock market, when all the smoke had cleared, the S&P-500 index ended the first quarter with a +1.2% gain, despite the lousy economy. The old adage, “Sell in May and Go Away,” was tossed into the trash heap and the “Least Loved” Bull continued to show its agility as it climbed to new stratospheric highs.
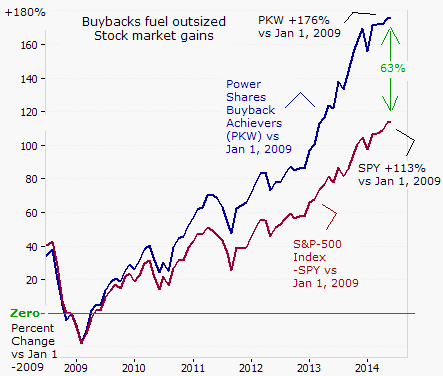
“Least Loved” Bull market running on 2 Cylinders, - Corporate America, - flush with $2-trillion of cash stashed away in their US-banking accounts, has decided there’s nothing more attractive than itself. So, the S&P-500 companies are spending big bucks to buy back their own shares. Last year, they plowed about 80% of their profits into the hands of shareholders, through buybacks and dividend payments. Over the past 3 ½ years, the number of shares of stock available to be bought or sold on the US-stock exchanges has dwindled by -10%. Shareholders like buybacks because they automatically increase earnings per share (EPS). And most often, though not always, a higher EPS leads to rising stock prices. It’s also made it more treacherous for short sellers to maintain bearish bets. Some notable examples are; Northrup Grumman (ticker NOC), the military contractor expects to reduce its shares outstanding by -25% by the end of 2015, with buybacks. Last year, Home Depot (ticker HD), announced a $17-billion buyback program, that will remove -18% of the shares outstanding at current prices. On June 9th, Home Depot issued $2-billion in five and 30-year bonds, with the intention to use the monies to buyback shares. The demand for HD’s debt exceeded the supply by a ratio of more than 3-to-1. Shares of FedEx (FDX) the operator of the world’s largest cargo airline, - soared to above $140 /share, after it authorized a buyback plan equivalent to -10% of its shares outstanding. The powerful impact of Corporate QE can be seen with the outsized performance of the Power-Shares Buyback Achievers fund (ticker; PKW) compared with the benchmark S&P-500 index. PKW buys shares of companies that have already purchased at least 5% of their shares outstanding over the past 12 months. The goal is to avoid companies whose buybacks go solely toward offsetting stock option grants and don’t shrink the share count. Since January 1st, 2009, PKW has increased in market value by +176%, compared to a gain of +113% for the S&P-500 index fund, ticker: SPY. Analysts estimate that 40% of the increase in the earnings per share of S&P-500 companies in the past 12-months was due to the “financial engineering” of corporate treasurers. In other words, corporate buybacks has scared the daylights out of short sellers - and is conceivably responsible for about one third of the stellar gains of the “Least Loved” Bull market. This article is just the Tip of the Iceberg of what’s available in the Global Money Trends newsletter. Global Money Trends filters important news and information into (1) bullet-point, easy to understand reports, (2) featuring “Inter-Market Technical Analysis,” with lots of charts displaying the dynamic inter-relationships between foreign currencies, commodities, interest rates, and the stock markets from a dozen key countries around the world, (3) charts of key economic statistics of foreign countries that move markets. To read the rest of this article, please click on the hyper-link located below; http://sirchartsalot.com/article.php?id=191 ### Jun 6, 2014 321gold Ltd |