|
|||
“Sell in May, and Go Away,” Strikes AgainGary Dorsch Mark Twain, one of America’s most famous literary icons, and known for his folksy humor, used to day, “History doesn't repeat itself, but it sure does rhyme.” On Wall Street, it’s been the “least loved Bull market” in history. Since the start of 2008, there’s been a massive exodus of more than $400-billion from mutual funds that invest in US companies, after the biggest and scariest plunge this generation of investors has ever seen. Yet at the same time, the current Bull market, that’s grown up in the shadow of the worst financial crisis since the Great Depression, is the seventh best percentage gainer in market history. It’s also the first Bull market to double in value in less than three years. Despite its impressive résumé, this Bull market gets little respect from retail investors. It’s considered to be a bubble that’s artificially inflated by the Federal Reserve’s cheap money policies. Spooked investors prefer to be clear of the maniacal stock market, before the grizzly Bear arrives. By historical standards, this 38-month-old Bull has beaten the odds. Only 14 of the past 34 Bull markets lived to their second birthday. Only eight of the past 34 Bull markets (22%) on Wall Street lived to see their third Birthday. Bull markets are tricky. They frequently try to throw investors off the bandwagon. There are “pullbacks” that rattle the stock markets about 3-or-4-times per year, and usually toss fortune seekers off the gravy train. Pullbacks have ignited an average loss of -7%, but the loss is usually recouped in 31-trading days. There are also frightening “Corrections” that rattle investors’ nerves. Since 1928, there’ve been 94-corrections of -10% or more, leading to upheavals in the stock market, about once in every 11-months. They typically last for four months and have erased -14% of the stock market's value, on average. Since 1928, there have been 42 “severe corrections,” or market declines of -15% or more. In 60% of the instances where a severe correction of -15% has evolved, the stock market’s downturn has morphed into an outright Bear market. Nobody rings a bell to let everyone know that the stock market has reached a top or bottom. And no one knows for sure how far a Bull or a Bear will extend. The average decline of a Bear market is -36%, which is an experience that most investors prefer to avoid. The last two Bear markets on Wall Street were the most severe since the 1929-32 stock market crash, with the S&P-500 index losing as much as -49% and -57% of its market value, respectively. Historically, it’s taken about nine months for a severe correction to reach the -20% threshold of a genuine Bear market. However, in today’s world of high frequency trading (HFT), what used to take nine months to accomplish, can now be achieved in 2-weeks. With about 65% of stock trades in the US-markets now executed by high-frequency traders that use super-smart and super-fast computer programs, the market’s sharp moves are amplified many times over. Sometimes, hedge funds and HFT’s that use borrowed money to buy stocks are forced to sell shares in order to raise enough money to meet margin calls, when markets turn sharply lower. And in today’s computer-generated world, these forced sales are done immediately, causing sharp declines in equity and increasingly in commodity markets.
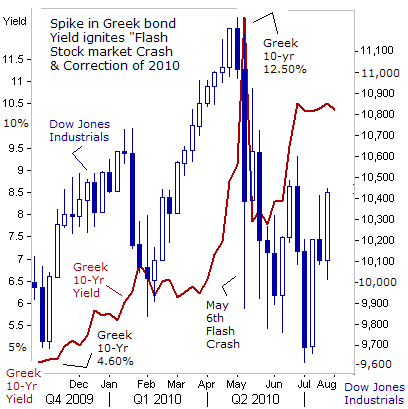
Seasonally, US-stock markets usually see a strong start to the New Year, but begin to flatten out in the second quarter. Often there’s a summer swoon that ends with a losing month in September. Traders call it “Sell in May and Go Away!” When analyzing the raw trading data since 1950, the worst period of performance for the US-stock markets, is between May 1st and Halloween. The month of October is famous for some of the biggest crashes in history, but it also has a reputation as a Bear market killer. Roughly 85% of the gains in the stock market are usually made in the months of November through April. In an eerie sense of déjà vu, the US-stock market is beginning to get a bit wobbly again, and has tumbled lower in the month of May, for the third year in a row. Two years ago, the Dow Jones Industrials topped out on April 26th. There was the infamous May 6th “Flash Crash,” when the Dow Industrials fell as much as -1,000-points lower within a few hours hours, wiping out about $1-trillion in market capitalization at one point, before recouping 600-points of its losses within 20-minutes of trading. The wild swings in the marketplace were exacerbated by computerized algorithm traders, but the catalyst for the crash was an unexpected upward spiral in Greek bond yields, that ushered in the Euro-zone’s debt crisis. Prior to the May 6th “Flash Crash,” the majority of professional investors were complacent and still in a bullish frame of mind, after watching the stock market bounce back from previous pullbacks and corrections, during the first year of recovery for the “Least Loved Bull.” Every decline in the stock market turned out to be a better buying opportunity. Earnings for S&P-500 companies were rebounding strongly, and surprising to the upside by a 3-to-1 margin. Yet the Greek debt crisis ushered in a whole new element of instability, and reopened the horrible memories of the subprime debt crisis. Following the initial shock from the May 6th “Flash Crash,” the Dow Industrials moved erratically lower, surrendering -15% of its value from its peak level. There were sporadic rallies, but on weak breadth and lower volume.
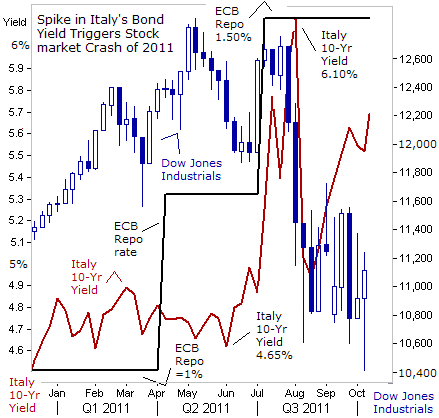
Last year, the “Least Loved Bull” rally began to run out of steam on May 2nd, 2011. Over the next two months, the Dow stumbled -1,000-points lower to the 11,900-level. There was a last gasp rally to the 12,650-level that fizzled out on July 26th, when stock markets across Europe were rattled by an upwards spiral in Italy’s 10-year bond yield, which suddenly jumped +145-bps higher to above 6-percent. The upward spiral in Italian bond yields triggered a meltdown in the Dow Jones industrials, knocking it -2,000-points lower. Swings of several hundred points in just minutes were commonplace.The most extreme was on August 9th, when the Dow soared +600-points in the one hour and 45-minutes after the Fed pledged to keep the fed funds rate locked at zero percent through mid-2013. HFT programs make up about half of the trading volume in a normal market day but 70% or more on a volatile one. The upward spike in Italy’s 10-year bond yield conjured-up fears that Italy could default on its €2-trillion pile of debt. That could’ve started a global credit freeze, through a chain reaction throughout the Euro-zone’s banking system, and spreading to large US-banks that have huge loans to European banks. Europe is a big consumer market for S&P-500 Multi-Nationals, accounting for 25% of their sales last year. On August 10th, US President Barack Obama met Fed chief Bernanke, Treasury chief Tim Geithner, National Economic Council chief Gene Sperling and White House chief of staff Bill Daley at the White House, - the infamous “Plunge Protection Team,” (PPT) and it was agreed that the PPT would put a floor under the US-stock market to prevent investors from dumping stocks in a selling frenzy. The PPT drew a line in the sand for the Dow Industrials at 10,600, aiming to prevent the widely watched index from falling into the clutches of a cyclical Bear market.
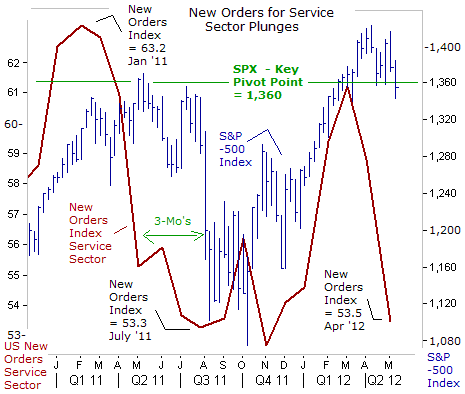
The Fed’s rescue operation - dubbed the “Bernanke Put” succeeded in putting a floor under the jittery stock market. The Fed’s agents on Wall Street began a massive buying spree, bidding up Dow Jones Industrial futures contracts, and signaled that it was safe to buy stocks. The Fed got plenty of help from its allies - the Bank of England and Japan unleashed additional rounds of QE. The ECB arranged a €1-trillion LTRO scheme that put a temporary lid on Italian and Spanish bond yields, recognized as a backdoor type of QE-scheme. History shows that when the US-stock market narrowly dodges a Bear market, the market quickly shifts into rally mode. Buying during a correction can be profitable. Following the past eight near misses of a Bear market, the S&P-500 index has rallied + 31.7% over the next 12-months, when fears of an imminent recession are not realized. Closely following the historical script, the S&P-500 index rallied +30% from above its October 4th low, over the next six months. The S&P-500’s recovery rally peaked on April 2nd, 2012, but didn’t begin to pullback at least -5% or more, until May 1st. Ominously, the New Orders index for US-services fell -5% in April to the 53.5-level. Ninety percent of US-economic activity is linked to the service sector, and a sharp drop in new orders signals a broader economic slowdown in the months ahead. Last year, the New Orders index for US-services plunged in April and June, and preceded a July-August swoon on Wall Street. To read the rest of this article, please click on the hyperlink located below: http://www.sirchartsalot.com/article.php?id=164 ### May 7, 2012 321gold Ltd |