| |||
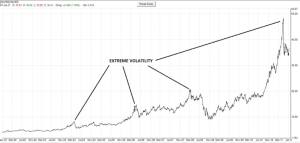
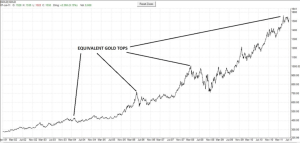
Decision Time for Silver InvestorsSilver Analyst What I will say comes with some reservation, mainly because the future is unwritten. However, based on the notion that markets will rhyme rather than repeat, I present a scenario in which a decision has to be made by silver investors in the near future. That decision is whether to hold onto silver, sell some of it or sell all of it. This is not because I foresee this nascent silver bull being strangled at birth, but rather because of the nature of the silver bull. The problem is silver in the past 13 years has seen some volatile action followed by periods of inactivity. These periods can be so volatile that some silver investors may wish to reduce their positions at such a time. Contrast the two charts below which compare periods of silver volatility (first chart) against the same time window for gold (second chart). (Click on images to enlarge) Volatility implies not just the drops but the preceding run ups as well. Silver charges up faster than gold but is more prone to dropping off quicker than gold. To quantify this, I measured two parameters for gold and silver over notable periods of volatility for silver. The first is the percentage drop from peak to bottom and the second is the time it takes gold or silver to recover and exceed the given peak price in the ongoing bull market.
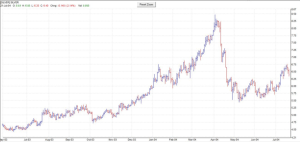
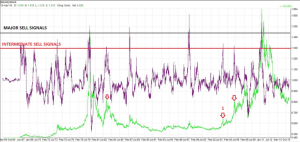
I think the statistics are clear enough, when silver corrects, there is more pain for investors as there is a greater “payback” for the bigger percentage moves than gold. The drops are bigger and the times to recovery are longer than gold. The question is therefore simple. Should silver investors bite the silver bullet and hang tight during these periods of volatility or cash in some of their silver profits for a lower re-entry? A case in point may be useful. Below is the run up in the silver price which broke out from $4.40 in mid-June 2003 to nearly double at $8.47 on the 2nd April 2004. The sell off which rapidly commenced afterwards may have unnerved many a silver investor as the price plummeted to $5.43 by the 10th May. The silver bull then recommenced its march to the distant hill of $50, though rather choppily as investors initially wondered if the silver bull was real. So, let us say you happily bought 1000 ounces of silver at $4.40 back in June 2003. By the 2nd April 2004, your stash is now worth $8470 instead of $4400 for a $4070 profit. You sit the correction out and your stash is now worth $5430 on the 10th May. Your profit is still $1030 and will continue to increase in value if you sit out the bull to April 2011 where it reaches just under $50000 in value. Like most investors, you may have slid down the “slope of hope” and now your stash is worth about $20000. Of course, this is a theoretical investor and we will all have our own individual tales. However, if our investor has sold out at $8.47 and reinvested at the bottom of the drop at $5.43, what would his stash be worth now? The answer is not $20000 but $31200 or a 56% appreciation. At $8.47 he cashed out for $8470. At $5.43 silver he can now purchase nearly 1560 ounces of silver. At our recent price of $20 an ounce, that gives you $31200. Now, no one is going to achieve these perfect figures, but we can try and get close to them. I have talked about my RMAR sell indicator before and it is currently raising an interesting prospect for my subscribers and myself as silver investors. If I get this right, I will make more out of this possible scenario than any number of subscriptions. And should it not be the case that silver writers make more from their silver holdings than writing newsletters? There is something wrong if they do not. The RMAR chart below covers 50 years of silver price action (silver price in green). The major sell signals trigger on crossing the black horizontal line at about the 1.45 level. However, there is an intermediate sell signal shown by the red line at about the 1.30 level. Some of the sell signals purely based on this level are shown by the red arrows. Our April 2004 example has a “1” above its arrow. Currently, the RMAR is rising and again approaching that 1.30 level. Its recent high was 1.15 and I report this number to subscribers on a weekly basis, becoming more frequent as it reaches such points of interest. If that 1.30 level is hit in the coming weeks and months, then I and my subscribers have to make individual decisions. The first is whether to ignore it and hold as the RMAR may progress to the higher more lucrative sell trigger at 1.45 and beyond. Alternatively, I may personally take the view that silver will do a mini blow off at this 1.30 level and I have to decide if I want to cash out some silver. That is my decision and mine alone, and that is the decision of each person who has that alert information and theirs alone. If you added to or initiated your silver hoard at a recent low of $15 per ounce, silver could go on to $25, $30 or more dollars. I don’t need to point out the potential profit at each of these prices. I believe silver will blow off soon and if the RMAR rings at 1.30 (if it rings, no indicator is perfect!), I will sell some of my silver awaiting an entry point way further down as silver goes through yet another major plummet. Whether this RMAR indicator goes off, remains to be seen. However, I would urge silver investors to consider the possibility that a price spike is coming soon with a disconcerting drop and you should seriously consider your options when that event comes. ### Silver Analyst Further analysis of silver can be had by going to our silver blog at http://silveranalyst.blogspot.com where readers can obtain newsletter subscription details. Comments and questions are also invited via email to silveranalysis@yahoo.co.uk. |


