| |||
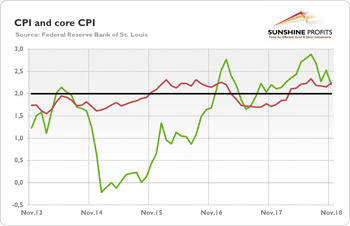
Does Flat CPI in November Imply Flat Gold?Arkadiusz Sieron Zero. The US inflation rate was unchanged in November. What does the flat CPI mean for the gold market? What Happened With Inflation? The CPI was unchanged in November, following an increase of 0.3 percent in October. It was the weakest number since March 2018, when monthly inflation fell about 0.1 percent. However, the flat reading was caused by a sharp decline in the price of gasoline – that subindex dropped 4.2 percent in November, offsetting increases in an array of prices including shelter and used cars and trucks. But the core CPI, which excludes food and energy prices, increased 0.2 percent last month, the same change as in October. So, don’t worry about the upcoming deflation. Over the last 12 months, the consumer prices increased only 2.2 percent, compared to 2.5 percent increase in October. The slowdown was obviously caused by a notably smaller increase in energy prices. The energy subindex increased just 3.1 percent on an annual basis, the smallest yearly increase since June 2017. However, the index for all items less food and energy climbed 2.2 percent, the same as last month, as the next chart shows. Chart 1: CPI (green line, annual change in %) and core CPI (red line, annual change in %) over the last five years. (Click on images to enlarge) How To Interpret This Data? Many analysts are shocked and interpret this data as a proof that inflation is waning. However, they are wrong. The underlying inflationary pressure is firm. The softer reading should not be actually surprising for anyone who carefully analyze the economic trends. As we do. The slowdown in inflation was precisely what we expected. In the Gold News Monitor published on November 20th, when we examined the October CPI reading, we wrote:
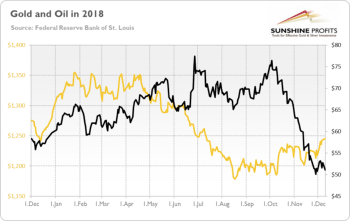
And, indeed, the overall CPI eased, as we predicted. If we did it once, maybe we will do it again – so let’s see what our crystal ball tells us. Hocus pocus, let’s focus! On the chart below, which shows the prices of oil (and gold) since December 2017. Chart 2: Gold prices (yellow line, left axis, London PM Fix, $) and oil prices (black line, right axis, WTI, $) over the last twelve months. As one can see, the oil prices collapsed in November, which lead to softer inflation reading. However, they have stabilized somewhat in December. Given that the recent slide is unlikely to persist, we could see a rebound in inflation. Of course, what we have in mind is the monthly rate, as the oil prices are now below the level seen last year. Implications for Gold That’s true. The inflationary pressure eased somewhat in November. However, inflation is still slightly above the Fed’s target. So we don’t expect any dramatic changes in the Fed’s thinking. The US central bank should continue its policy of gradual hiking the federal funds rate. It implies more of the same for the gold market. What does it mean? Well, gold is trapped in the sideways trend for a couple of years. But that trend is quite turbulent. If history is any guide, gold should reach the bottom in December and rally after the FOMC meeting. But this year might surprise us. On the one hand, the Fed may slash its economic projections, which could help the yellow metal. However, the markets expect just one hike in 2019 – so, if the Fed sounds more hawkish than expected, gold may suffer. Next week will bring us the answer. If you enjoyed the above analysis, we invite you to check out our other services. We provide detailed fundamental analyses of the gold market in our monthly Market Overview reports and we provide daily Gold & Silver Trading Alerts with clear buy and sell signals. If you’re not ready to subscribe yet and are not on our gold mailing list yet, we urge you to sign up. It’s free and if you don’t like it, you can easily unsubscribe. Sign up today! Thank you. ### Disclaimer: Please note that the aim of the above analysis is to discuss the likely long-term impact of the featured phenomenon on the price of gold and this analysis does not indicate (nor does it aim to do so) whether gold is likely to move higher or lower in the short- or medium term. In order to determine the latter, many additional factors need to be considered (i.e. sentiment, chart patterns, cycles, indicators, ratios, self-similar patterns and more) and we are taking them into account (and discussing the short- and medium-term outlook) in our trading alerts. |


