| |||
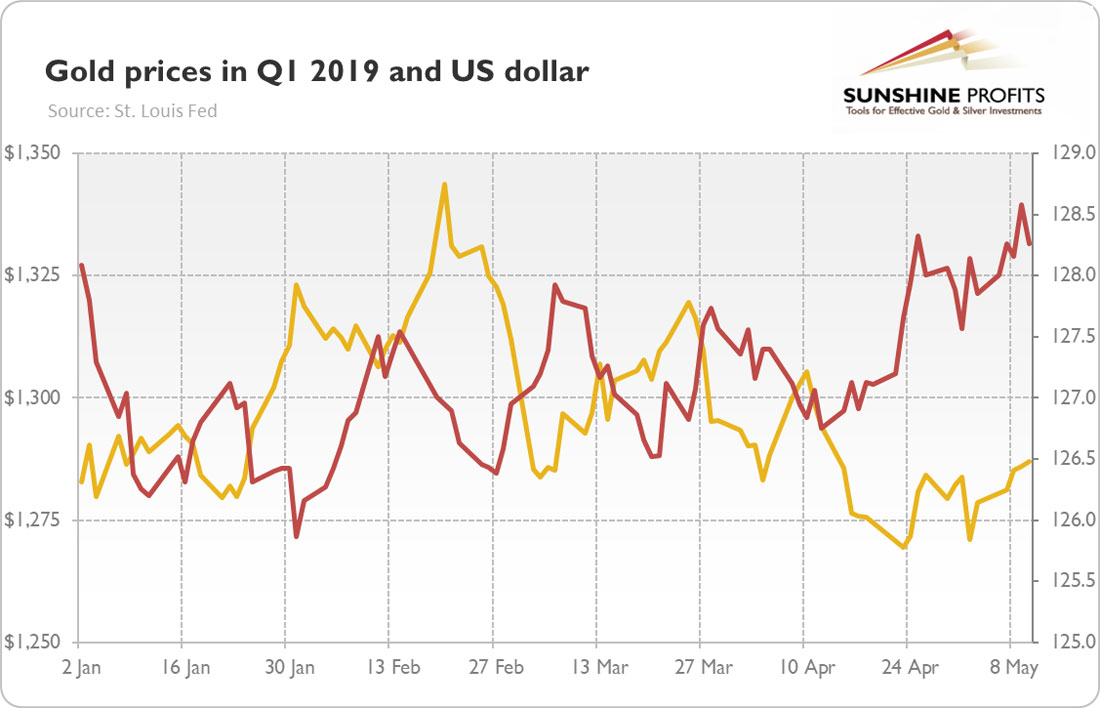
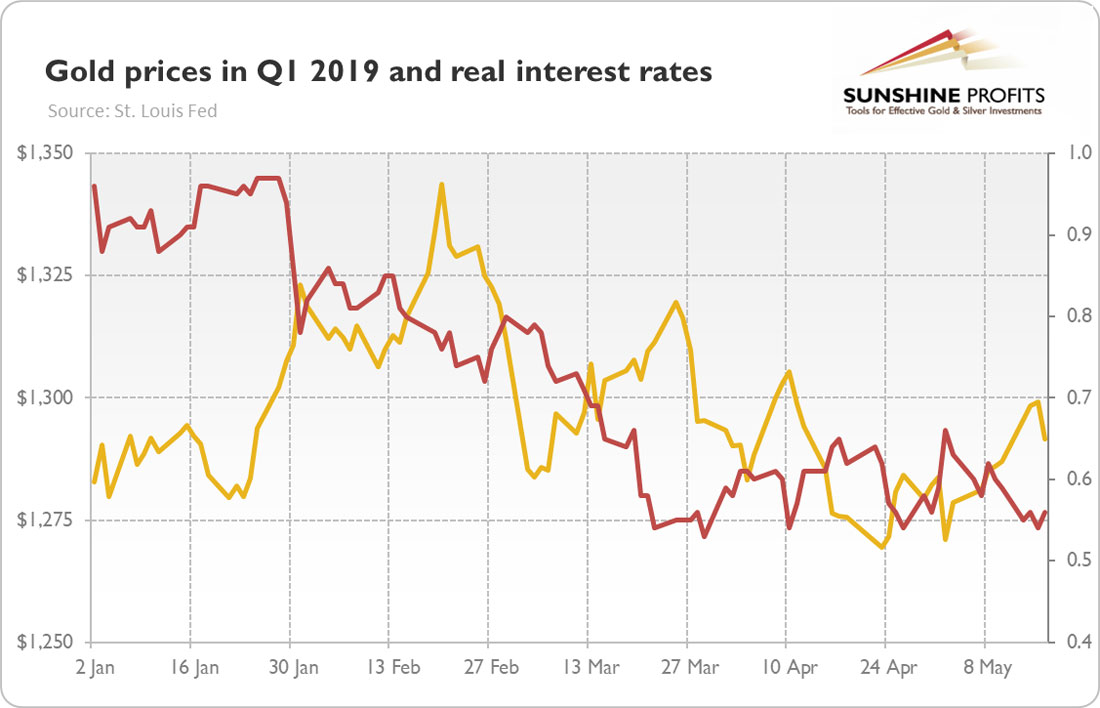
Gold Demand Rose 7% in Q1 2019. A Launching Pad Higher for Gold?Arkadiusz Sieron In May, the WGC published a new edition of its quarterly report on gold demand. It features interesting data about the changes in gold demand and supply. What does the Gold Demand Trends Q1 2019 say about the gold market in the first quarter of the year? How will its conclusions be reflected going forward in the gold price? WGC Publishes Report on Gold in Q1 2019 According to the newest WGC data, the supply of gold was virtually unchanged (modest growth in mine production and recycling were offset by a decline in hedging), while the gold demand rose 7 percent year-over year to 1,053.3 tons in the first quarter of 2019. The main driver of the increase were strong central banks’ purchases. The central banks bought 145.5 tons of gold, 68 percent more than one year ago. Low interest rates and uncertainty caused by trade wars pushed reserve managers’ appetite toward gold. However, Russia – which is not in a typical country’s position (Its purchases are motivated by strong political and economical reasons at the same time. This way, it’s shielding itself from tougher sanctions.) – was again the largest buyer. When it comes to other categories, jewelry demand edged up 1 percent, thanks to India. Technology demand declined 3 percent, hit by slower global economic growth and trade dispute between China and the U.S. Bar and coin investment fell 1 percent, while investors allocated 40.3 tons of bullion to gold ETFs, which means a huge boost from 27.1 tons in Q1 2018. The inflows were supported by the dovish shift in the US monetary policy. If we talk about gold ETFs and similar products, let’s point out that – according to the WGC’s market update from April – in Q1 2019, assets in European gold-backed exchanged trade products (ETPs) hit a record high, reaching 1,121.4 tons and accounting now for 45 percent of the global ETP market. Negative interest rates, stock market volatility, Italian turmoil, and geopolitical uncertainty including Brexit, fueled the European flight to gold. As always, we remind investors to take the WGC report with a pinch of salt. Their data is not adequate at best, or flawed at worst. Consider this: in Q1 2019, the supply was virtually unchanged, while the demand for gold jumped 7 percent from the first quarter of 2018. But the price of the yellow metal declined 2 percent over the same period! Where’s the point here, where is the logic? Someone should tell the WGC about the law of demand and the law of supply! Gold Behaves as Currency, not Commodity So what has really happened in the gold market in the first quarter of 2019? Let’s take a look at the chart below. As one can see, the price of the yellow metal at the start and end of the first quarter remained virtually unchanged. It rallied in January and the first half of February, but it entered a downward trend since then. Chart 1: Gold prices (yellow line, left axis, London P.M. Fix, $) and US dollar trade weighted index (red line, right axis, broad) in Q1 2019. (Click on images to enlarge) The main driver behind these movements was the U.S. dollar. Just take one more look at the chart above – the lines look almost like mirror reflections of each other. The mighty greenback was the major headwind for the yellow metal. Neither trade tensions nor the Fed’s dovish shift and the increased market expectations of interest rate cuts this year was able to derail the dollar and boost the gold prices. Indeed, take a look at the chart below, which shows the real bond yields. Chart 2: Gold prices (yellow line, left axis, London P.M. Fix, $) and real interest rates (red line, right axis, 10-year inflation-indexed Treasury) in Q1 2019. As one can see, the long-term real yield declined from almost 1.0 to almost 0.5 percent over the first quarter. But the gold prices did not rise on this, as they were hampered by the U.S. dollar. What does it mean for the gold market? The conclusions are clear. First, pay less attention to the jewelry demand data for gold and focus more on the financial markets. Gold behaves more as a currency than as a commodity. Second, as long as the greenback remains the least ugly currency game in town, we are unlikely to see a bull market in gold. If you enjoyed the above analysis, we invite you to check out our other services. We provide detailed fundamental analyses of the gold market in our monthly Market Overview reports and we provide daily Gold & Silver Trading Alerts with clear buy and sell signals. If you’re not ready to subscribe yet and are not on our gold mailing list yet, we urge you to sign up. It’s free and if you don’t like it, you can easily unsubscribe. Sign up today! Thank you. ### Disclaimer: Please note that the aim of the above analysis is to discuss the likely long-term impact of the featured phenomenon on the price of gold and this analysis does not indicate (nor does it aim to do so) whether gold is likely to move higher or lower in the short- or medium term. In order to determine the latter, many additional factors need to be considered (i.e. sentiment, chart patterns, cycles, indicators, ratios, self-similar patterns and more) and we are taking them into account (and discussing the short- and medium-term outlook) in our trading alerts. 321gold Ltd |