Super Force Signals - A Leading
Market Timing Service
We Take Every Trade Ourselves
Gold In 2011: Short & Long Term Analysis
Morris Hubbartt
Weekly Market Update Excerpt
posted Dec 31, 2010
Gold and Precious Metals
UUP Dollar Chart
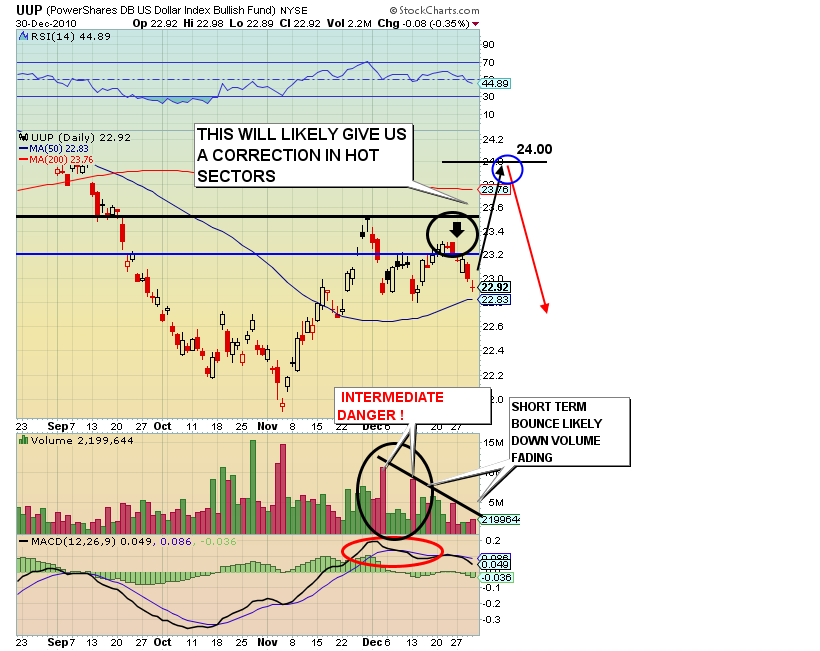
US Dollar Analysis:
-
The Federal Reserve, with the absence of a Gold Standard, is the worst financial system devised by mankind, or should I say, monster-kind. There has never been an audit of the monster, and there is no safety mechanism to limit how much your Fed can print.
SGOL 6 Month Price Chart
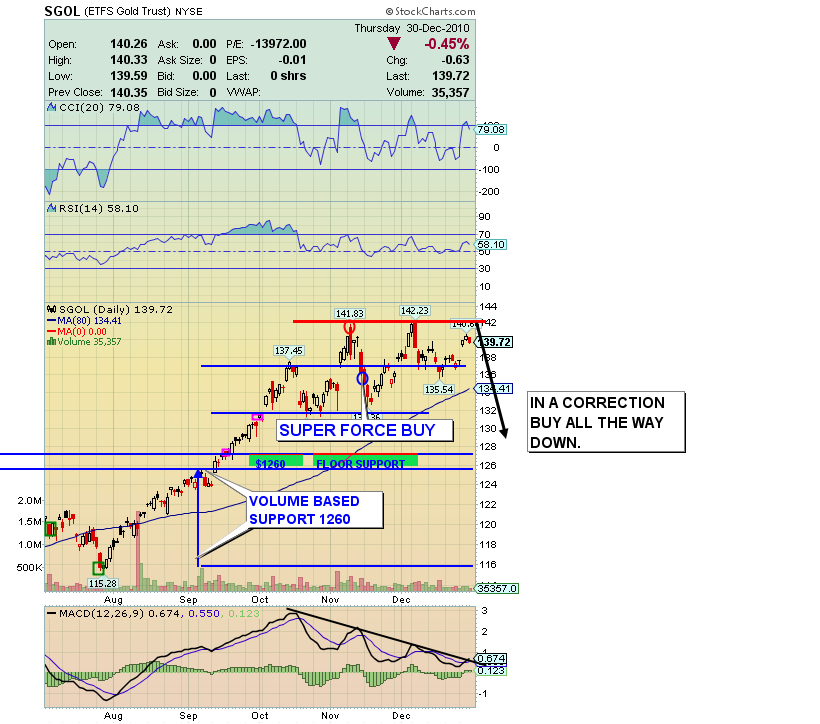
Gold Bullion Analysis:
-
Note the solid volume-based support on the above SGOL chart. Volume is the single most important technical indicator, and the most ignored indicator because it isn’t flashy. I would ask you to consider that profits are flashy, not squiggly lines on a chart. Get “intense” when looking at volume, if you want intense profits.
-
Longer term, the policies of the government in the US are starving the economy, failing in job creation, and feeding inflation. The “Shovel Ready” jobs are nothing more than Black Hole spending from 2008 forward.
-
Consider the inflationary Black Hole projects; spend 10,000 dollars to create 3000 dollars of economic activity. I own a manufacturing company. I don’t pay 10,000 dollars to get 3,000 dollars. I wonder how eager the US Congress would be to spend 3 dollars to get 1, if it was their personal funds that had to be spent?
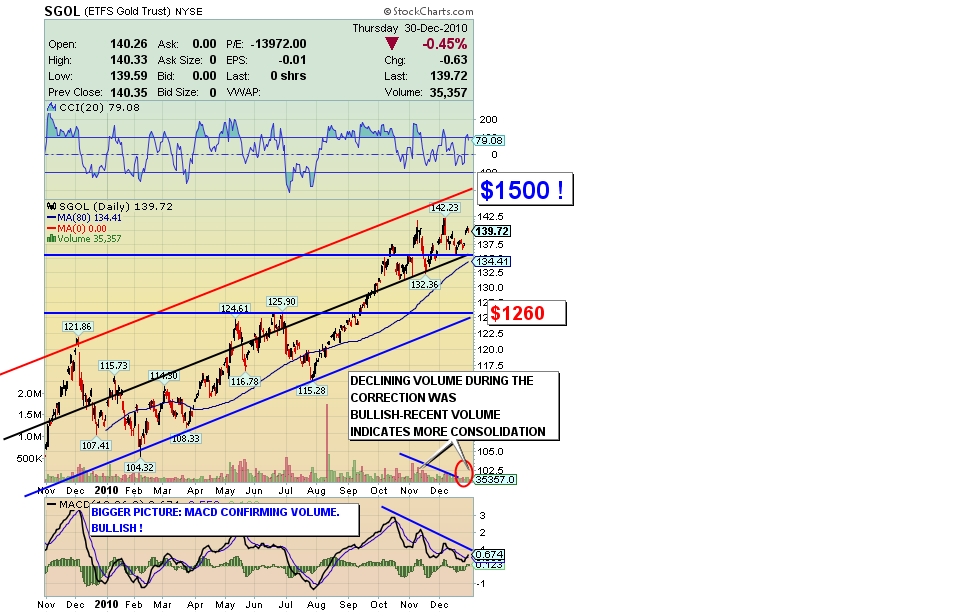
SGOL 14 Month Price Chart
-
I will continue to shave profits off as the market moves higher and will start the SuperForce power 2 re-buys on weakness, meaning I rebuy every 2% down, because 1260 is only the ultimate possible target, not a guarantee.
Gold Juniors GDXJ Chart
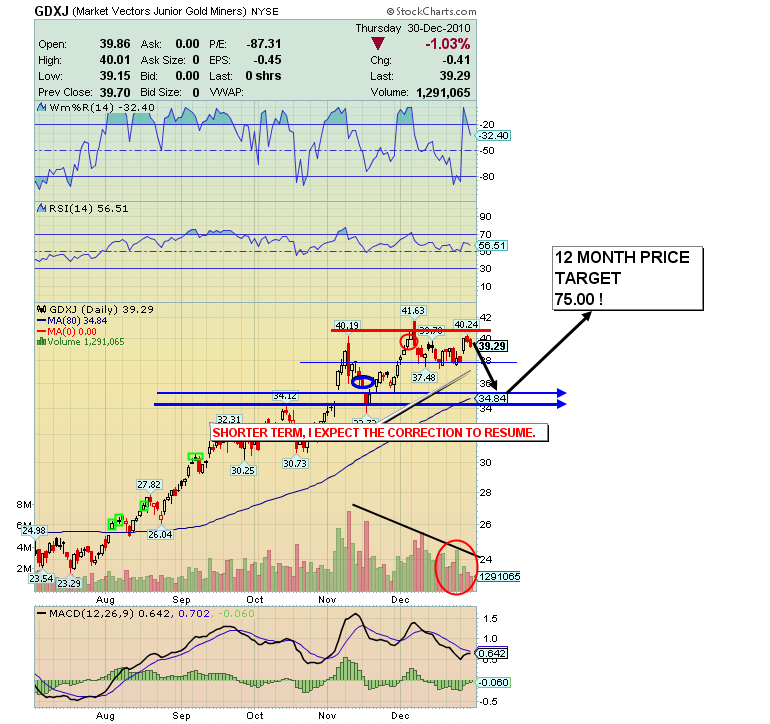
Gold Juniors Analysis:
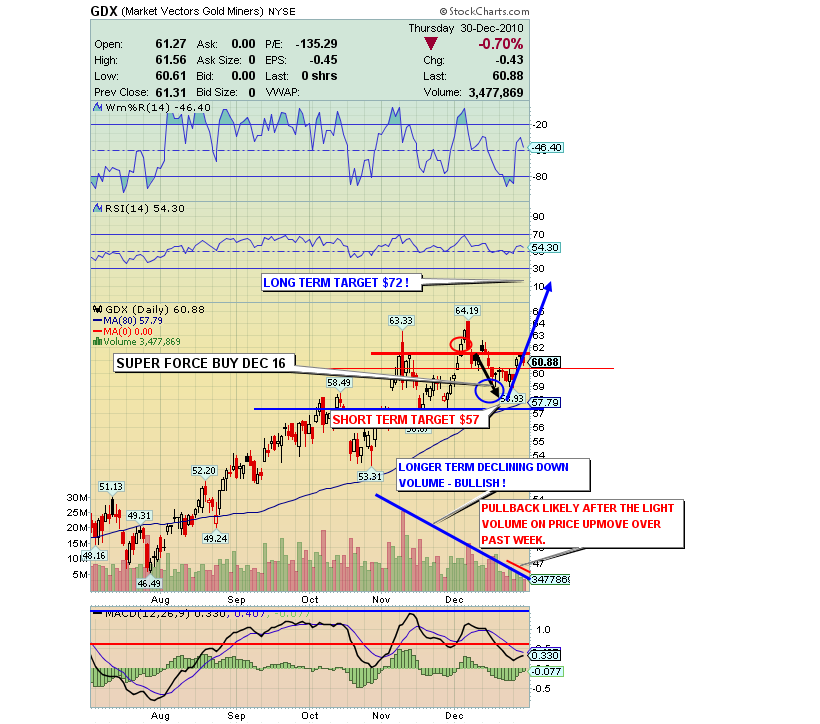
GDX 6 Month Chart
-
On the above chart, I have laid out the likeliest outcome for the coming year. GDX is going to $72 at a minimum! The entire precious metals sector has performed superbly in the past few weeks. There is a strong chance GDX enters a correction in January that bottoms around $57, then starts a huge climb to $72.
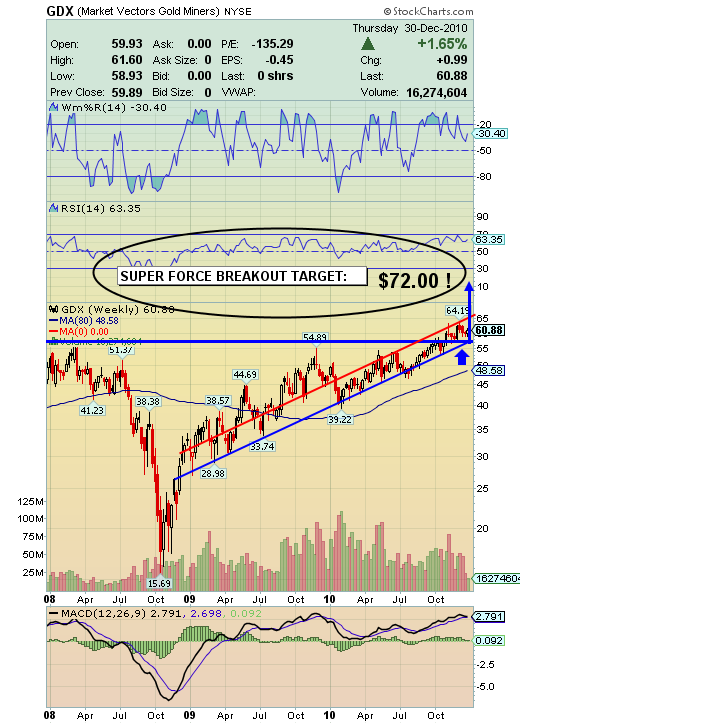
GDX Massive Breakout On 3 Year Chart
Use my SFS Gold Stock Ratio to get an idea where the gold stocks group is headed over the next few years.
SuperForce Gold Stock Ratios: Example: Gold, from 1387, moves up 10%. That’s a move to $1525.
GDX Current 65% Momentum Ratio to Gold: If Gold moves up 10%, GDX moves up 16.5%.
GDXJ 239% Momentum Ratio to Gold: If Gold moves up 10% GDXJ moves up 33.9%!
Super Force Arb Ratios
-
Because the structure of the triple leveraged ETFs is different from a trust or closed-end fund, enormous inefficiencies can develop as these funds attempt, unsuccessfully, to fully track the underlying commodity or market.
-
Over time, most investors in the gold community have become bitter about their experiences with such funds (ETFs) that fail to track the underlying items. As a long time manufacturer, I naturally lean towards the understanding that where there is large inefficiency, there is large profit to be made. The Arb Ratio Tables I have developed show the inefficiency can spiral into hundreds of percent over 12 to 24 months. My trading program seeks to build core positions in this very inefficiency for investors, and the gains here are already producing percentage returns that rival and even surpass my manufacturing business, so I am delegating there, and expanding here with the Arb Ratio Trading, which is really a mechanism to profit as the banks profit, by selling that inefficiency to unsuspecting investors! I’m preparing a series of educational videos detailing how to profit from these inefficiencies. Email me for details. Best Wishes to the entire Gold Community for 2011!
Friday, Jul 3, 2026 Super Force Signals Unique Introduction For 321Gold Readers:
Send me an email to admin@supergoldsignals.com and I’ll send you my free “Inflation Thunder Now!” gold and silver stocks video report. I’ll also include 3 of my next Super Force Surge Signals free of charge, as I send them to paid subscribers. Thank you!
|
Stay alert for our Super Gold alerts, sent by email to subscribers,
for both the daily charts on Super Force Signals at www.supergoldsignals.com and for the 60 minute
charts at www.supergoldsignals.com
About Super
Gold Signals:
Our Surge Gold Signals are created thru our proprietary blend
of the highest quality technical analysis and many years of successful
business building. We are two business owners with excellent synergy.
We understand risk and reward. Our subscribers are generally successfully
business owners, people like yourself with speculative funds,
looking for serious management of your risk and reward in the
market.
Frank Johnson:
Executive Editor, Macro Risk Manager.
Morris Hubbartt: Chief Market Analyst, Trading Risk Specialist.
website: www.supergoldsignals.com
email:
admin@supergoldsignals.com
email: admin@supergold60.com
Mail:
1276 Lakeview Drive
Oakville, Ontario, L6H 2M8
Canada
###
Dec 31, 2010
Morris Hubbartt
321gold
Ltd
 |
