Super Force Signals - A Leading
Market Timing Service
We Take Every Trade Ourselves
Gold Chart Walk 2012
Morris Hubbartt
Weekly Market Update Excerpt
posted Dec 30, 2011
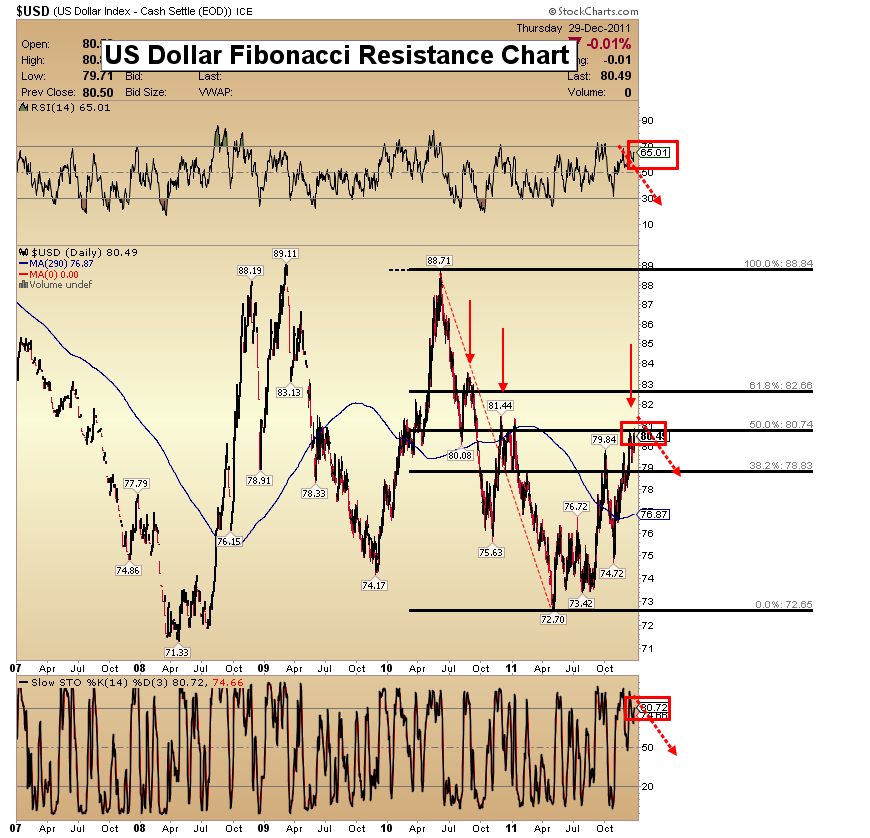
US Dollar Key Resistance Chart
Analysis
- Unlimited government requires unlimited funding. The unfunded liabilities of the USA are staggering. Over the next 20-25 years there is probably a gigantic $75 trillion unfunded liability problem for the US government. Think of the move in gold against the dollar with a debt of $15 trillion. Can you imagine the action in gold with a debt five times the current size?
- The United States could be headed towards decades of dollar devaluation. With all of the problems in Europe, why isn’t the euro hitting new lows? Why can’t the dollar mount a real rally, instead of this tiny bit of strength?
- The answer is that the dollar isn’t really very strong at all. If America goes into a crisis like you’ve just seen in Europe, the fall in the dollar could dwarf the euro’s fall, because America is the largest debtor nation in the history of the world.
- The nature of all fiat currencies is to be competitive, with each currency group looking for an advantage in trade, and more importantly, an advantage in debt relief for the governments that issue these currencies. Fiat currencies are designed to be depreciated over time. Buy Gold in this time of gold price weakness, because your opportunity won’t last forever.
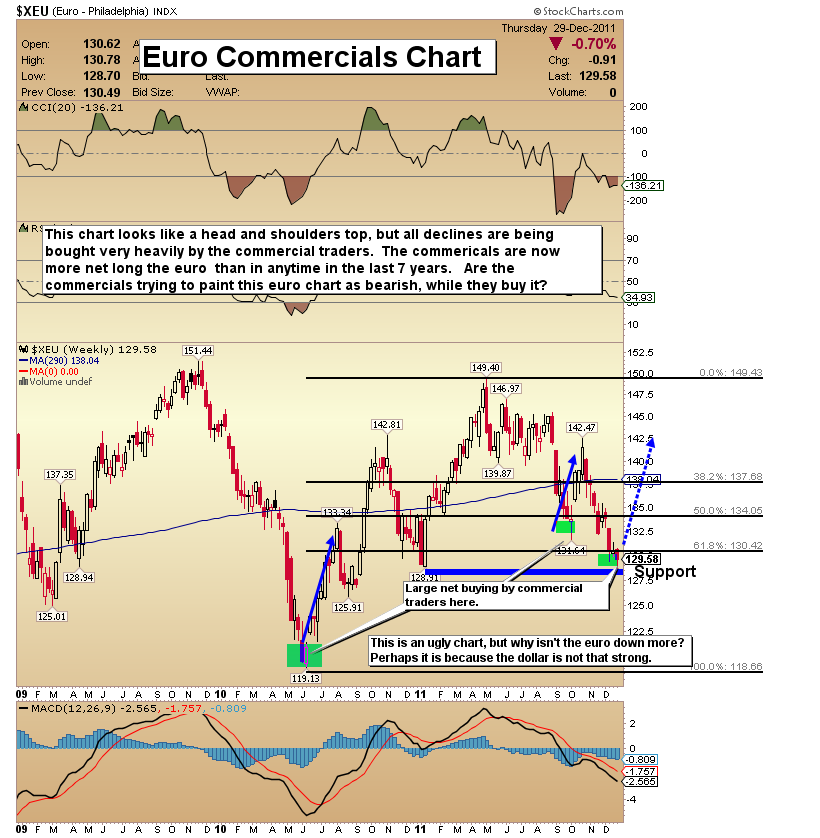
Euro Commercials Chart
- I’d like you to take a look at the despised euro. The euro is not breaking new lows, and the dollar is not exploding to record highs. The commercials group is now heavily buying the euro. Could this mean the euro is actually headed higher?
- The euro often moves in line with gold and I think this is an opportunity to build your holdings of gold and silver, rather than betting one fiat currency against another. I am doing it now in most of the precious metals sectors.
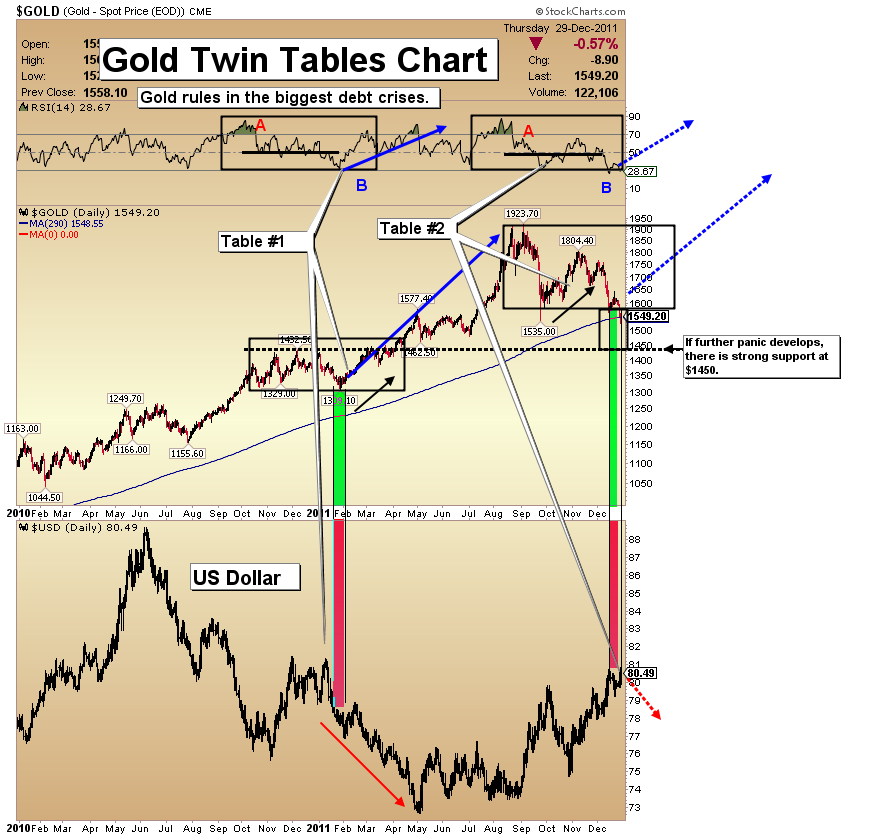
Gold Twin Tables Chart
- Market correlations are very important to determine where markets might be headed into the future. Strong sentiment indicators like commercial buying in gold are currently telling a very bullish story.
- For timers, commercial buying in gold acts more as general guide than as a laser pointer. Commercial buying doesn’t mean that the trend is about to reverse, and large drawdowns can greet investors who buy as the commercials buy. The key point to remember when studying commercial buying is that assets bought when commercial traders buy them can usually be sold at a very good profit, but you need to have patience.
- When you combine the significance of commercial buying with other technical action, you can be more confident in your decision to buy, and stick with it during the drawdown period. Note the current RSI action. It is very similar to that of last February’s correction, which also saw commercial traders buying heavily, as they are now.
- Keep yourself generally aligned with smart commercial money, rather than running with the herd. Gold is absolutely the best all-around long term investment for this historic debt crisis, and the technical posture of the market suggests that a powerful move to the upside is likely very near for gold.
Gold Super Highway Chart
- While nothing is a sure thing, this chart shows the potential for gold to move towards the $2300 area by around mid-year. This past summer saw gold up and out of a fairly large uptrend channel, with a push into the $1900 area. My expectations are to see gold blast into the super highway zone, and begin a new trajectory to much higher prices.
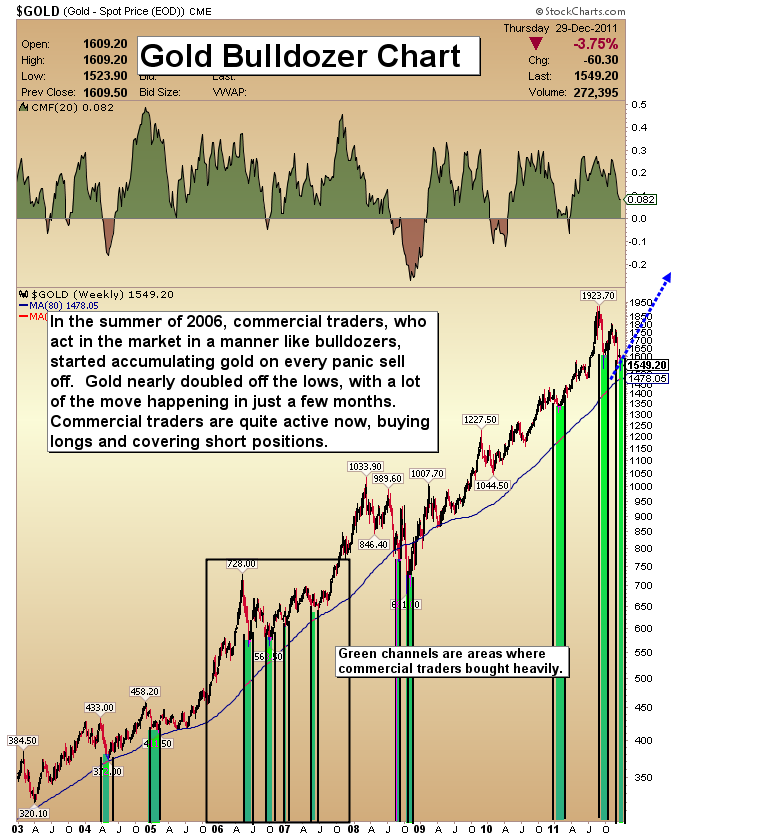
Gold Bulldozer Chart
- Technical analysis suggests certain scenarios. It does not guarantee them. I want to address another possible scenario for gold, which would be something similar to what happened in the 2006-2007 gold market. In that time frame there were four terrifying corrections. When the fear moved in, so did the commercial buyers. After a full year and four corrections, price broke out to the upside, and new highs were hit. In Sept of 2007 gold rallied from the $600 area to well over $1000. The best strategy for any correction is to sensibly and calmly buy the price weakness as it presents itself.
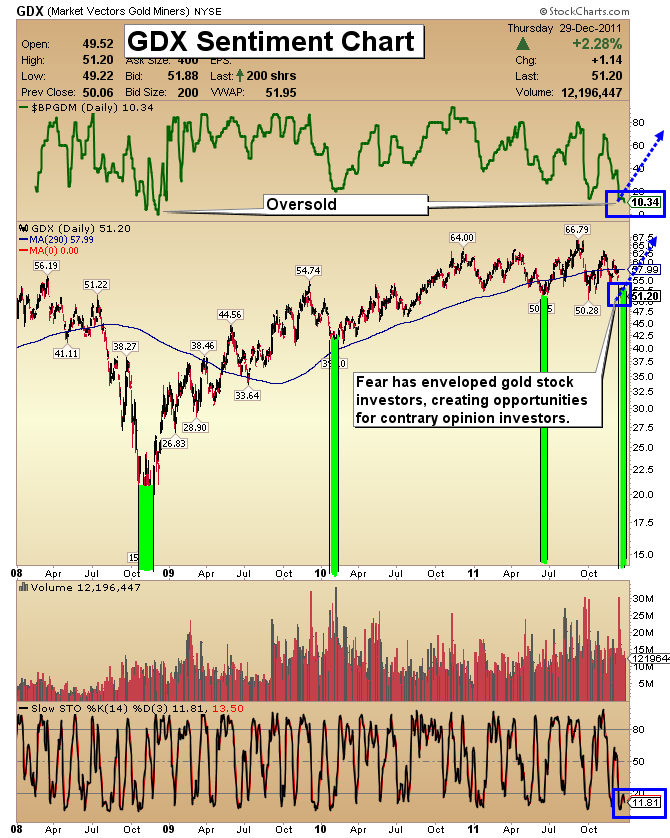
GDX Sentiment Chart
- As we look back at gold stocks going into the 2011 new year, price is oversold and sentiment indicators are screaming, “buy me!”. The Slow Stochastic indicator is at the bottom of the range, and solidly in the buy zone. Be patient, because your pay day will come.
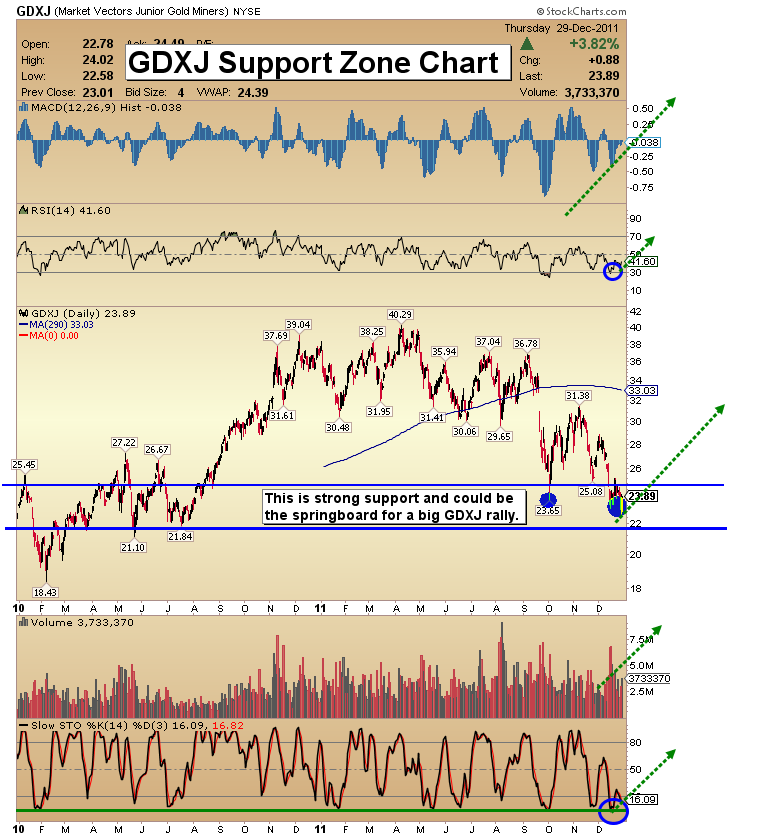
GDXJ Support Zone Chart
- The price is low, the value is great, sentiment is where I want it to be for a major move, and we are in major support area. I simply have to be a buyer of GDXJ.
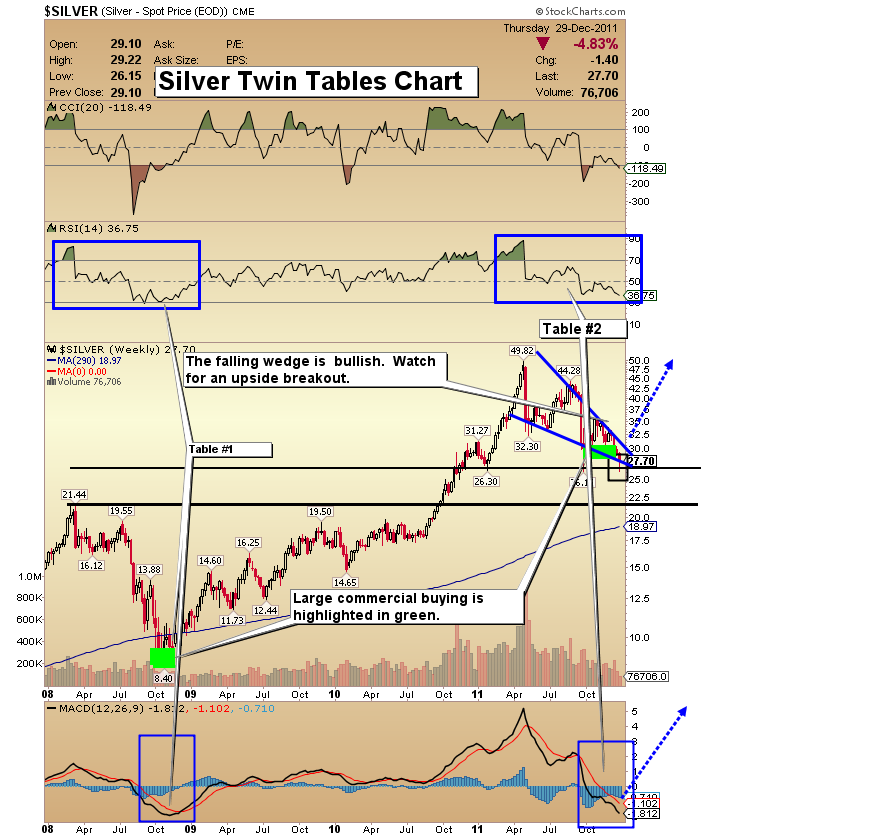
Silver Twin Tables Chart
- Silver is a volatile metal, but there is a compelling opportunity to transfer other assets to silver in these times of extreme weakness of silver against the dollar. Silver is currently my favorite investment. I prefer to buy the physical metal and store it securely. Buyers of silver are in good company, because the net positions of the commercials traders are now actually larger than 2008 when price got as low as about $9! Buy the metal and wait patiently. If you are looking for triple digits, as I am, it is important to hold physical metal because the volatility is probably as “here to stay” as silver itself!
Friday, Jul 24, 2026 Super Force Signals Unique Introduction For 321Gold Readers:
Send me an email to admin@supergoldsignals.com and I’ll send you my free “Inflation Thunder Now!” gold and silver stocks video report. I’ll also include 3 of my next Super Force Surge Signals free of charge, as I send them to paid subscribers. Thank you!
|
Stay alert for our Super Gold alerts, sent by email to subscribers,
for both the daily charts on Super Force Signals at www.supergoldsignals.com and for the 60 minute
charts at www.supergoldsignals.com
About Super
Gold Signals:
Our Surge Gold Signals are created thru our proprietary blend
of the highest quality technical analysis and many years of successful
business building. We are two business owners with excellent synergy.
We understand risk and reward. Our subscribers are generally successfully
business owners, people like yourself with speculative funds,
looking for serious management of your risk and reward in the
market.
Frank Johnson:
Executive Editor, Macro Risk Manager.
Morris Hubbartt: Chief Market Analyst, Trading Risk Specialist.
website: www.supergoldsignals.com
email:
admin@supergoldsignals.com
email: admin@supergold60.com
Mail:
1276 Lakeview Drive
Oakville, Ontario, L6H 2M8
Canada
###
Dec 30, 2011
Morris Hubbartt
321gold
Ltd

|
