Super Force Signals - A Leading Market Timing Service
We Take Every Trade Ourselves
The Spike Indicator And Gold Morris Hubbartt
Weekly Market Update Excerpt
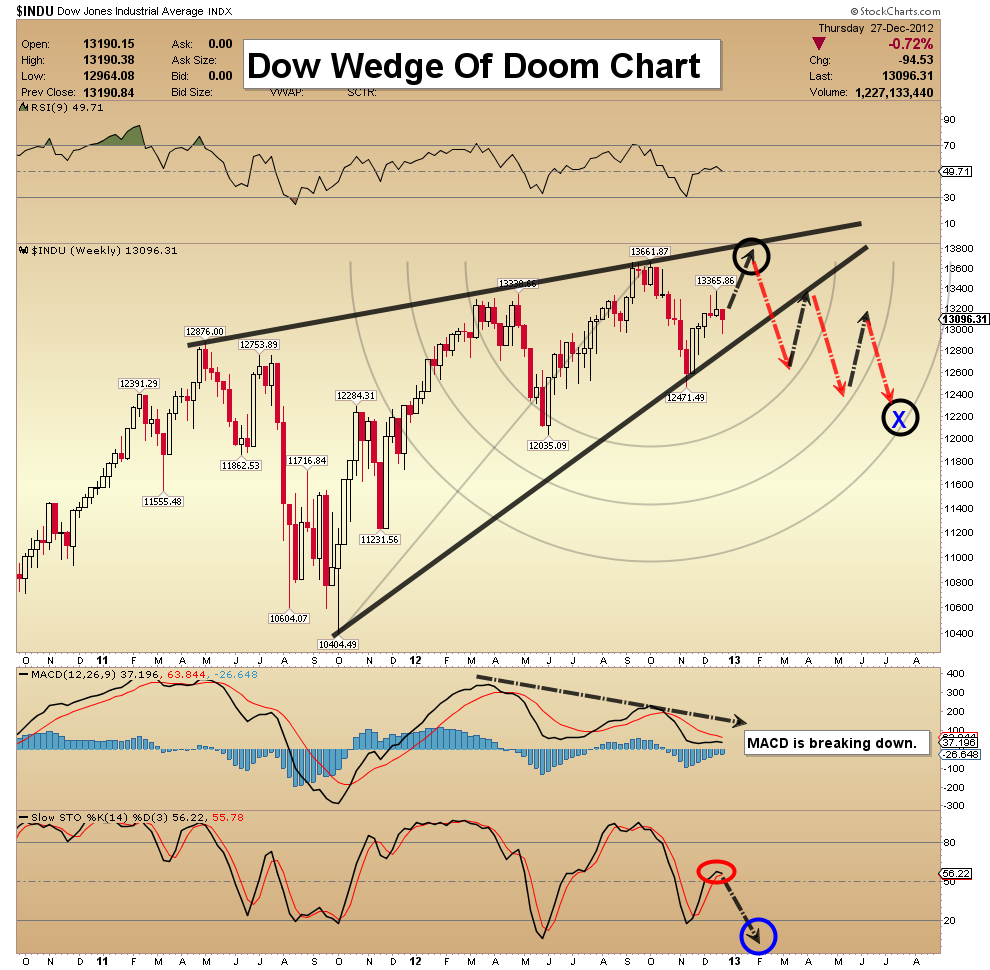
posted Dec 28, 2012 Dow Wedge Of Doom Chart - I want to focus your attention on the Dow, because most investors believe that resolution of the fiscal cliff could give stocks a lift. Unfortunately, this chart suggests that after a tiny rally towards 14,000, there could be an enormous correction that takes the Dow to as low as 11,800.
- The sell-off could begin very quickly, so the next rally should be used to lighten up on long positions. Risk takers should short the market as it moves towards 14,000.
- Note the enormous wedge pattern in play. My minimum downside target is the outer Fibonacci arc, which is "near" 12,200.
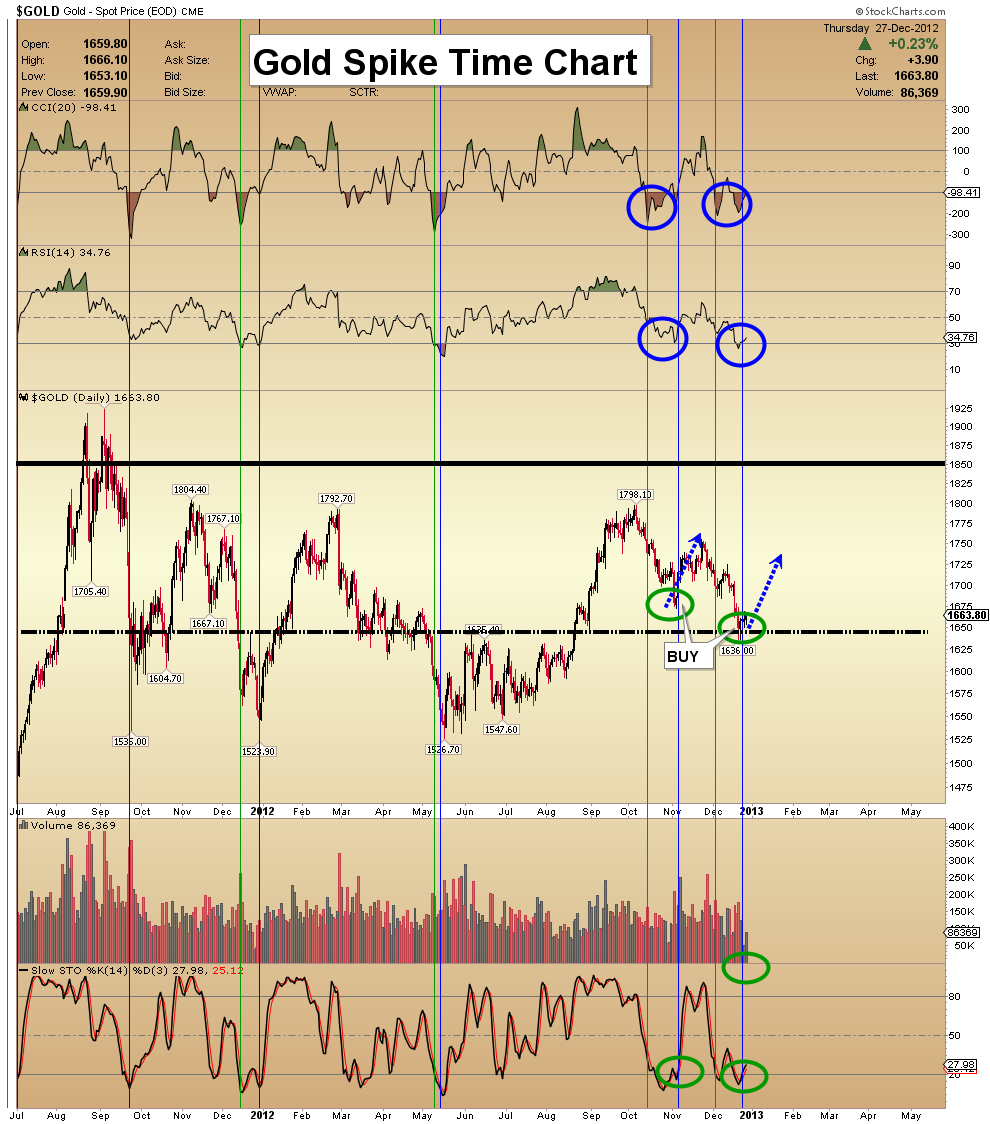
Gold Spike Time Chart - On the charts of numerous precious metals sectors, the CCI spike indicator is in bullish play. I use it to measure the intensity of upward or downward movement. Typically, spike movements indicate the end of a bearish move, rather than the beginning of a new bullish one.
- Once the spike has formed, investors should look for RSI to confirm the CCI spike, by moving higher.
- Still, no system is perfect. Investors should strictly limit the amount of capital deployed when buy signals are generated.
- Accumulating gold may not sound “sexy” at this point, but it is a very solid strategy.
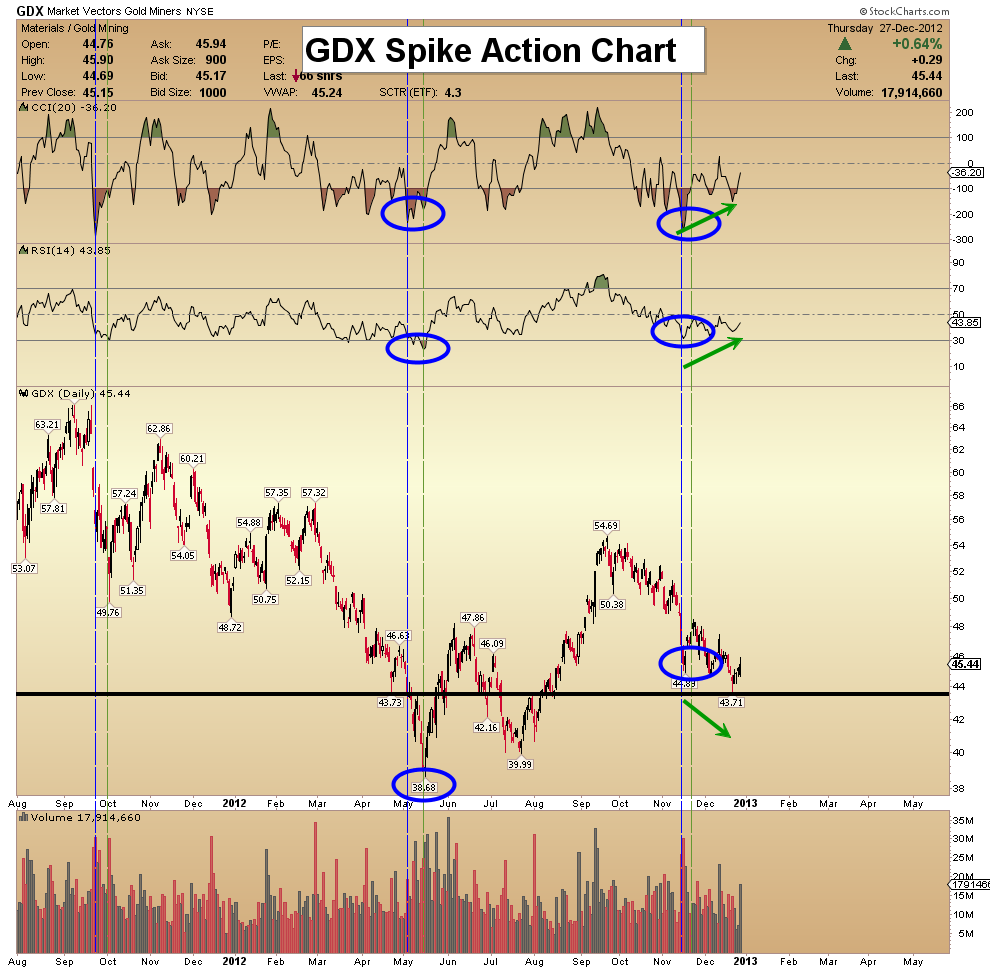
GDX Spike Action Chart - Watching price go lower, as indicators offer positive divergences, is a small consolation to most gold stock investors today. It’s important to remember that entire farm crops begin with the planting of a seed, and so does the growth of a portfolio.
- If you're low on cash, simply hold your positions.
- The latest CCI spike occurred in mid-November. Now, RSI is beginning to confirm that spike, and there is a significant bullish divergence with the price of GDX in play. The size of the divergence suggests that a major bull leg is beginning, for most gold stocks.
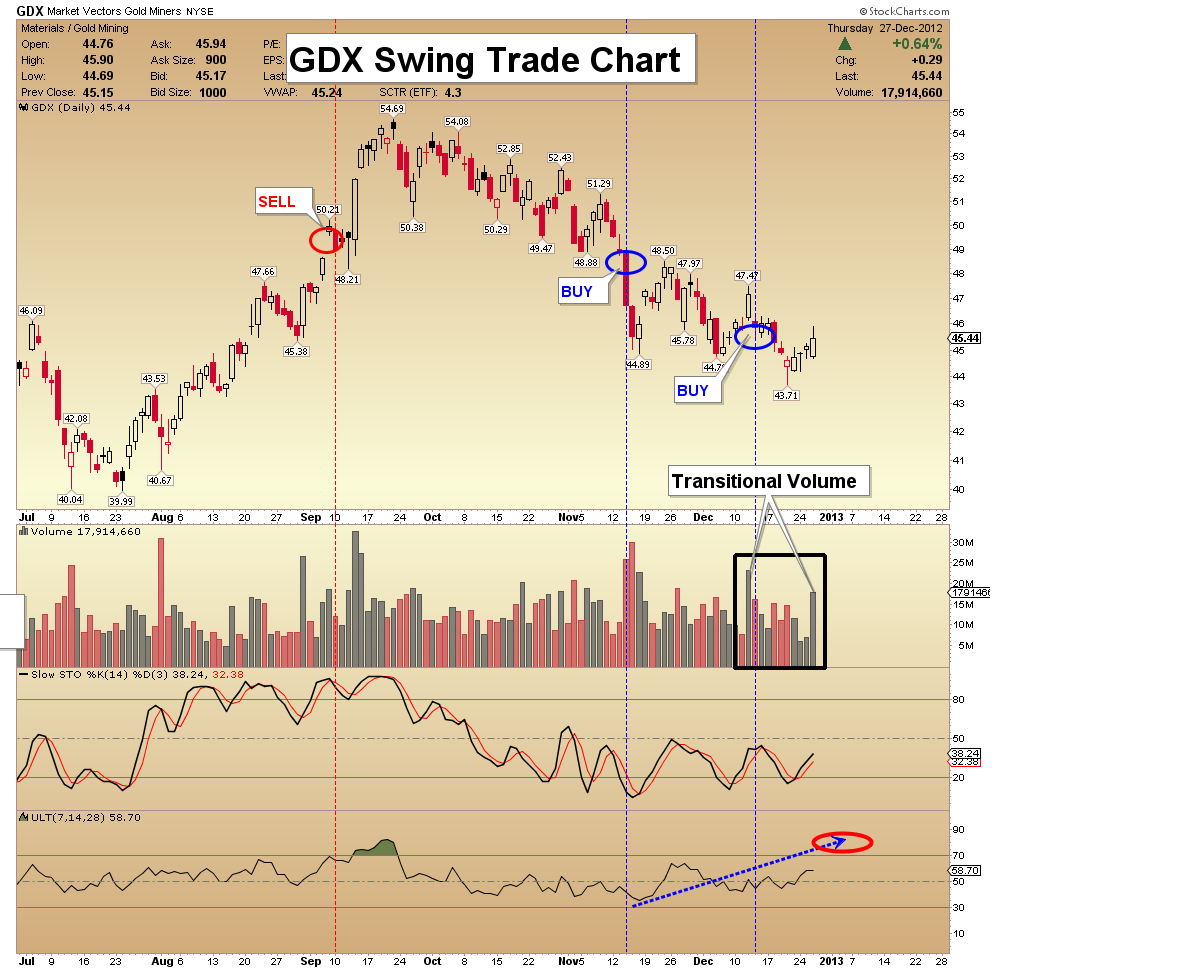
GDX Swing Trade Chart - I allocate 30% of my GDX risk capital to swing trading. Note the positive divergences on the slow “Stokes” and the Ultimate Oscillator.
- I’m very excited about a volume pattern that is now in play, and I’ve highlighted what I believe are two key “transitional” bars. The tide is slowly turning, in favor of the bulls!
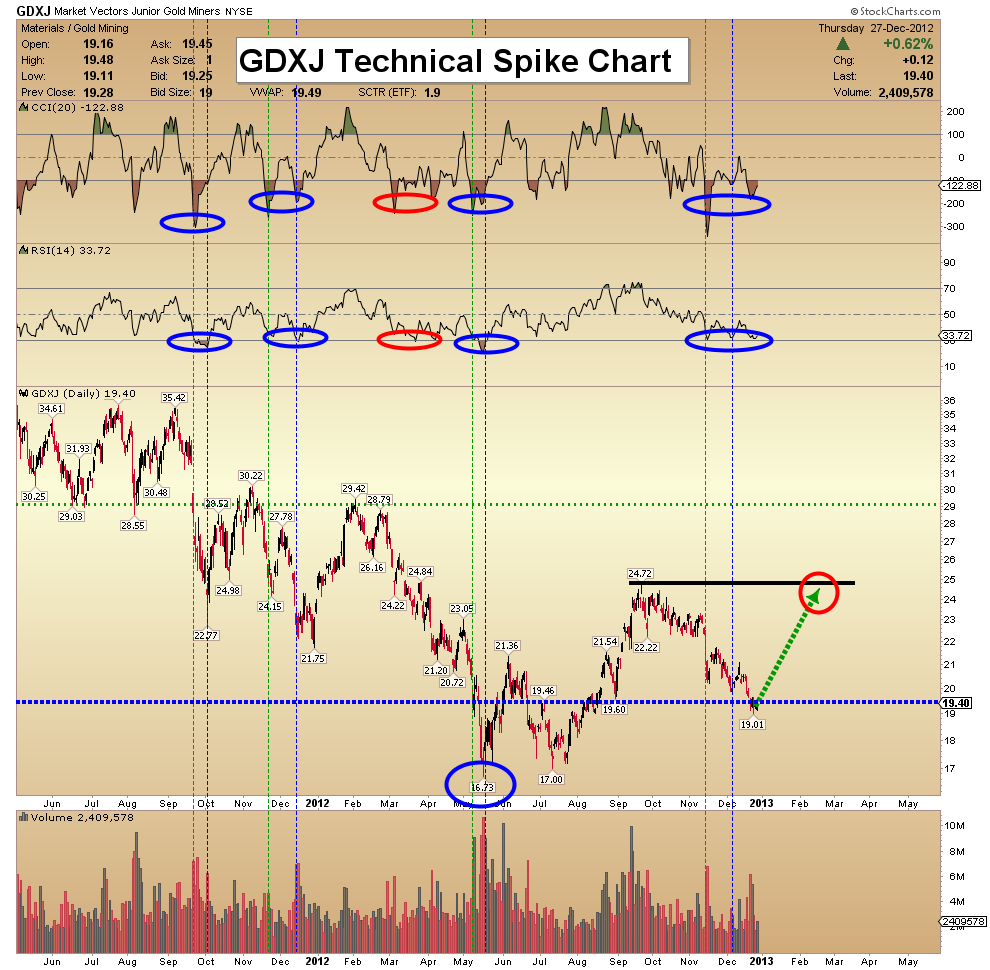
GDXJ Technical Spike Chart - I’ve highlighted five examples of the CCI buy spike signal on this chart. Four of them were followed by decent rallies, but no trading system is perfect. Note the red circles on the chart. That’s one example of a signal that was a “dud”.
- I am projecting a solid rally occurs soon. GDXJ should acquire my $24.72 target early in January, after a brief rest near resistance at $22.22.
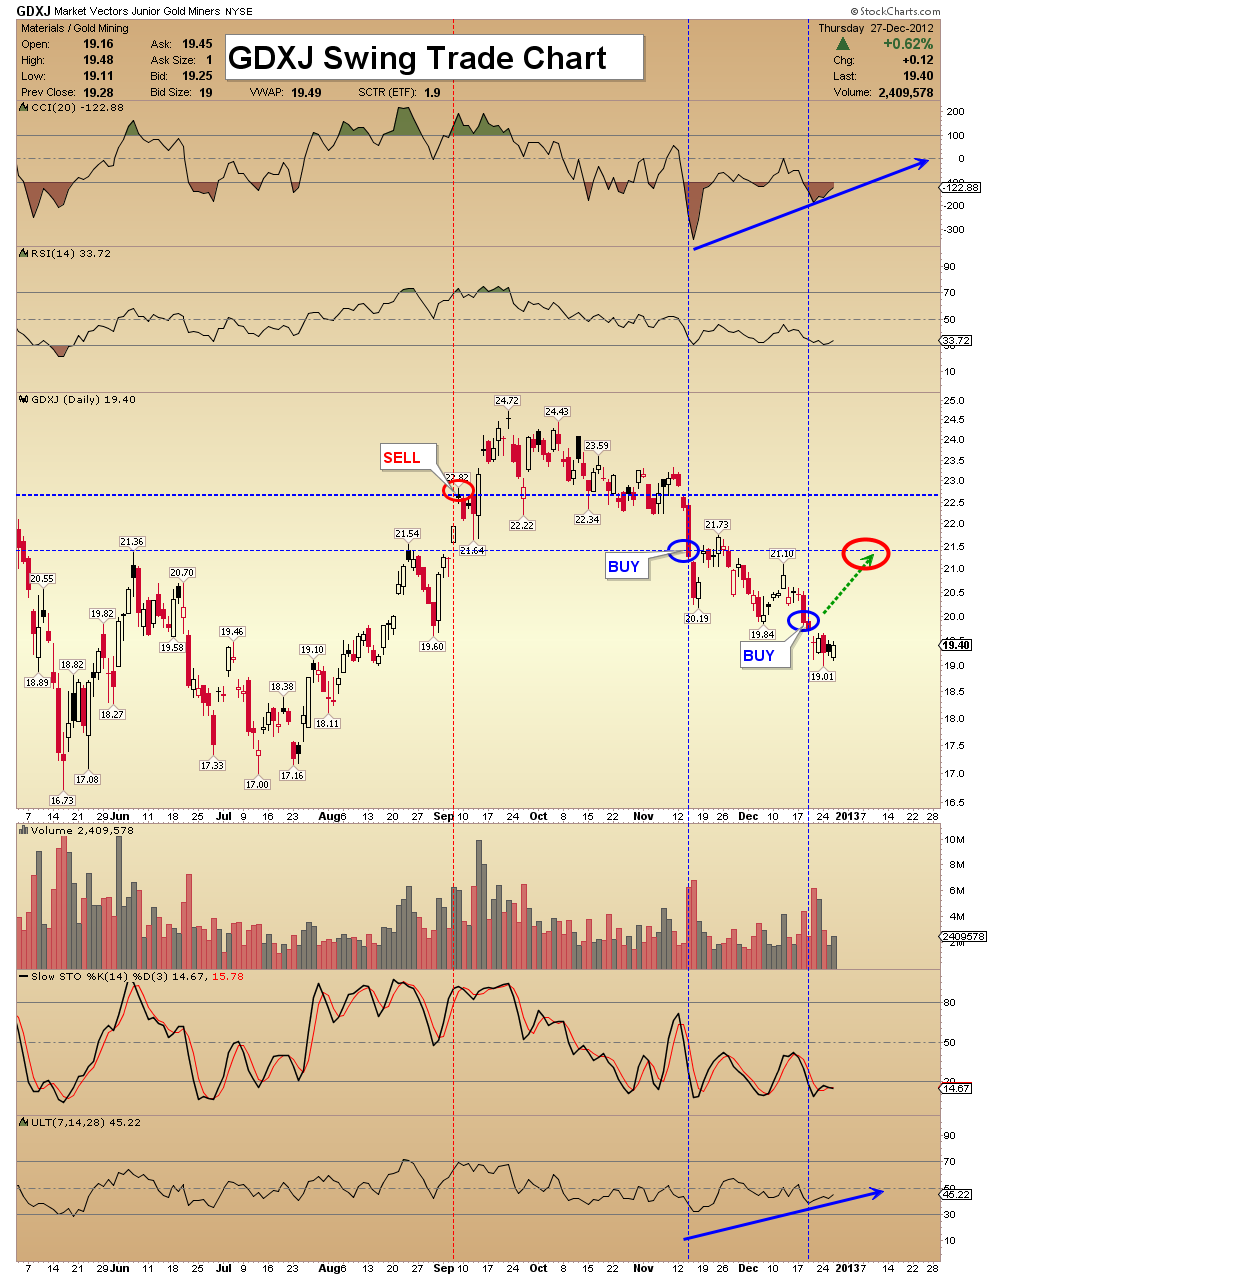
GDXJ Swing Trade Chart - 70% of the capital earmarked for investment in the juniors sector should be held as core positions. The other 30% can be used for swing trading.
- There are important bullish technical divergences in play now. Both the slow “Stokes” and the Ultimate Oscillator are predicting much higher prices are coming soon! Swing traders can book light profits near $21.50.
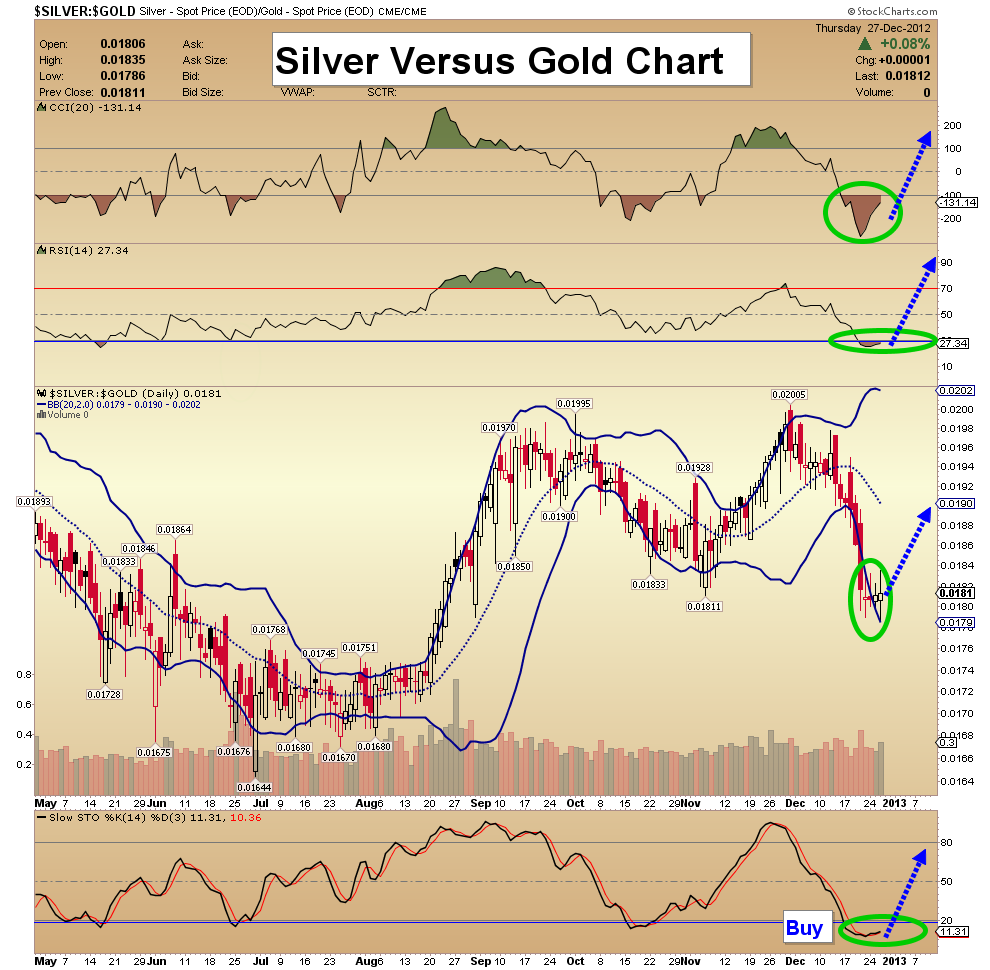
Silver Versus Gold Chart - This is a ratio chart of silver versus gold, and it suggests silver is set to dramatically outperform gold, in the intermediate term. RSI is close to confirming the latest CCI spike, and the Stokes oscillator at the bottom of the chart is flashing a significant buy signal.
- A bullish Doji candle recently occurred, just outside of the lower Bollinger band. No technical pattern has a 100% success rate, but a Doji is highly dependable. The silver bears are treading on thin ice here, and the bulls are looking good.
- The best trade for 2013 could turn out to be buying silver now.
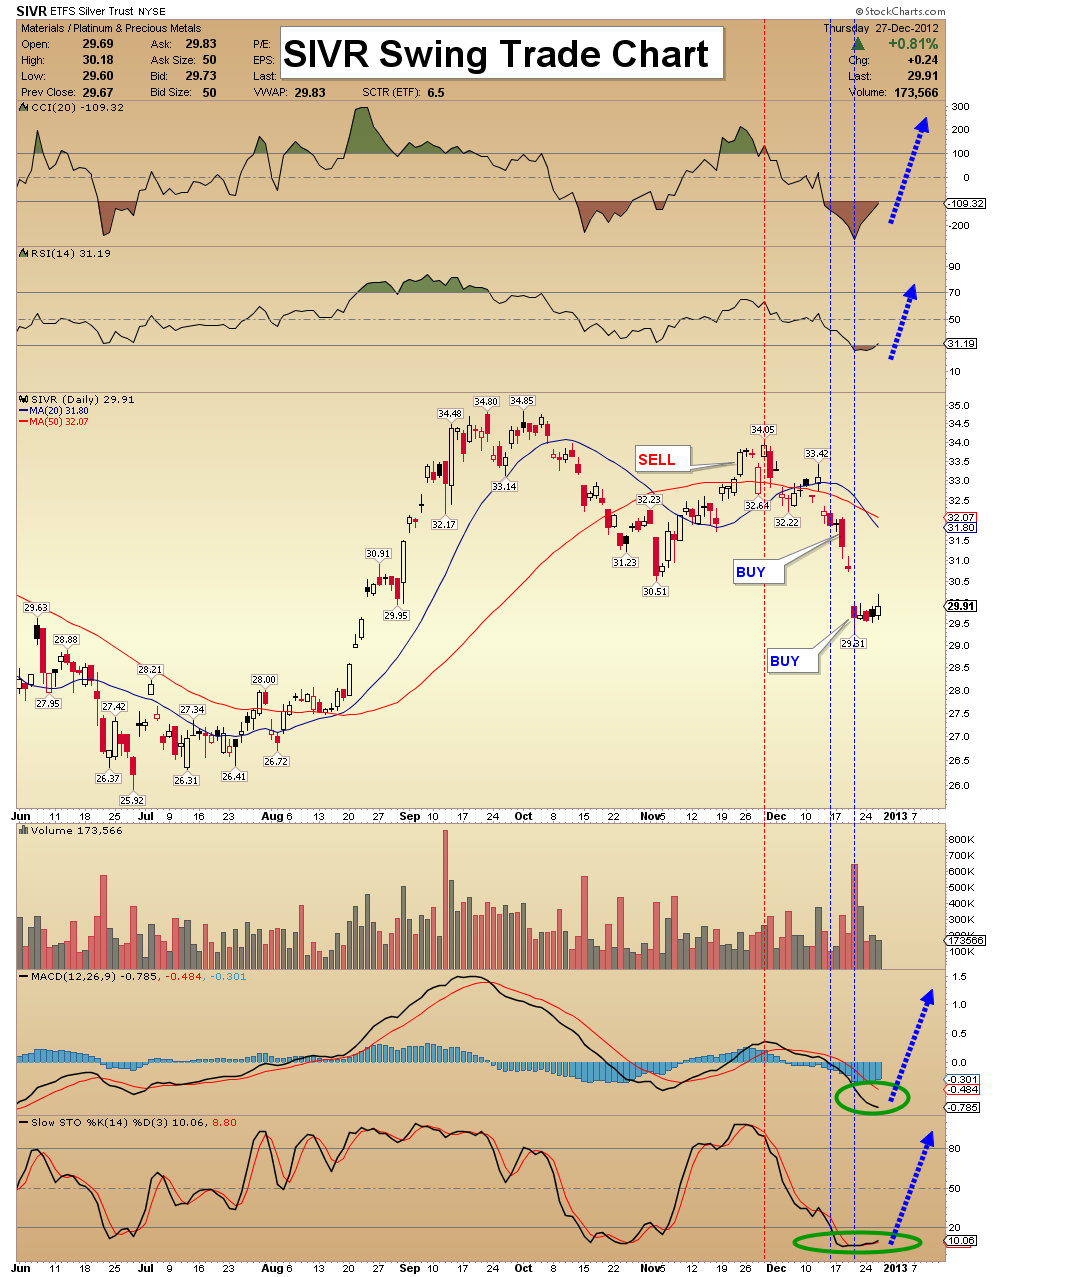
SIVR (Silver Proxy) Swing Trade Chart - Physical silver bullion is one of my favorite places to put new investment capital. On this chart, the RSI oscillator has just poked above the oversold line at 30, producing a nice buy signal.
- CCI, MACD, and the slow Stokes are also in a position to fuel a big rally, almost immediately. A substantial move higher by silver would be a great start to the new year, for the entire precious metals sector!
Friday, Jul 24, 2026 Super Force Signals Unique Introduction For 321Gold Readers:
Send me an email to admin@supergoldsignals.com and I’ll send you my free “Inflation Thunder Now!” gold and silver stocks video report. I’ll also include 3 of my next Super Force Surge Signals free of charge, as I send them to paid subscribers. Thank you!
|
Stay alert for our Super Gold alerts, sent by email to subscribers,
for both the daily charts on Super Force Signals at www.supergoldsignals.com and for the 60 minute
charts at www.supergoldsignals.com
About Super
Gold Signals:
Our Surge Gold Signals are created thru our proprietary blend
of the highest quality technical analysis and many years of successful
business building. We are two business owners with excellent synergy.
We understand risk and reward. Our subscribers are generally successfully
business owners, people like yourself with speculative funds,
looking for serious management of your risk and reward in the
market.
Frank Johnson:
Executive Editor, Macro Risk Manager.
Morris Hubbartt: Chief Market Analyst, Trading Risk Specialist.
website: www.supergoldsignals.com
email:
admin@supergoldsignals.com
email: admin@supergold60.com
Mail:
1276 Lakeview Drive
Oakville, Ontario, L6H 2M8
Canada
### Dec 28, 2012
Morris Hubbartt
321gold Ltd
 |
