Super Force Signals - A Leading
Market Timing Service
We Take Every Trade Ourselves
Fibonacci Supports Gold Market
Morris Hubbartt
Weekly Market Update Excerpt
posted Dec 23, 2011
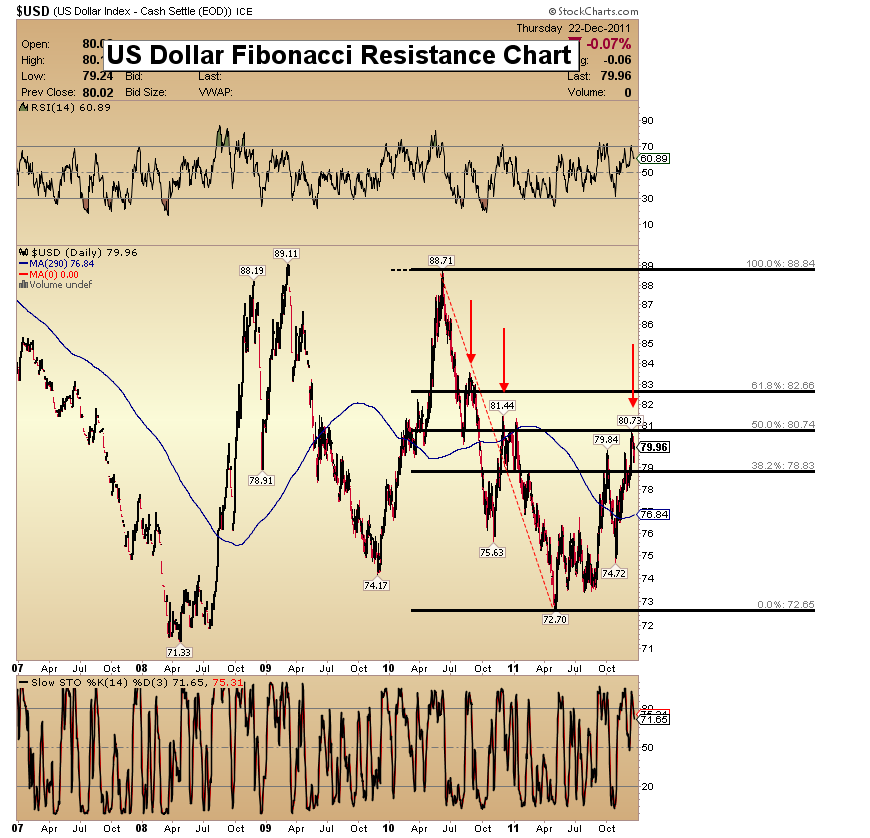
US Dollar Fibonacci Resistance Chart
Analysis
- Money is being created worldwide, but not through work and investment. I’m referring to money printing. Assets are being held at above market value with accounting techniques, to protect bank balance sheets. This new “state of the union” requires ongoing money creation to maintain itself.
- When the US government speaks of a strong currency, what they really mean is a competitive currency. The European crisis is causing a rally in the dollar and negatively affecting gold.
- That very rally is making the United States even less competitive than it already is, and nothing significant has changed in regards to the US debt crisis.
- Use the dollar rally as an opportunity to build your position in the ultimate currency, which is gold.
- Do you believe that a crisis in Europe just solved America’s enormous debt problems? The US remains the greatest debtor nation in the history of the world, and the debt problem is worsening. The dollar’s fundamentals are unchanged, and it remains in a long term bear market.
- Take a good look at the above chart of the US dollar, and the Fibonacci resistance points. The dollar is at the 50% Fibonacci retracement line now. Traders are making a serious error betting large capital on a terrible fundamental situation like the dollar, and the technical situation is not very good either.
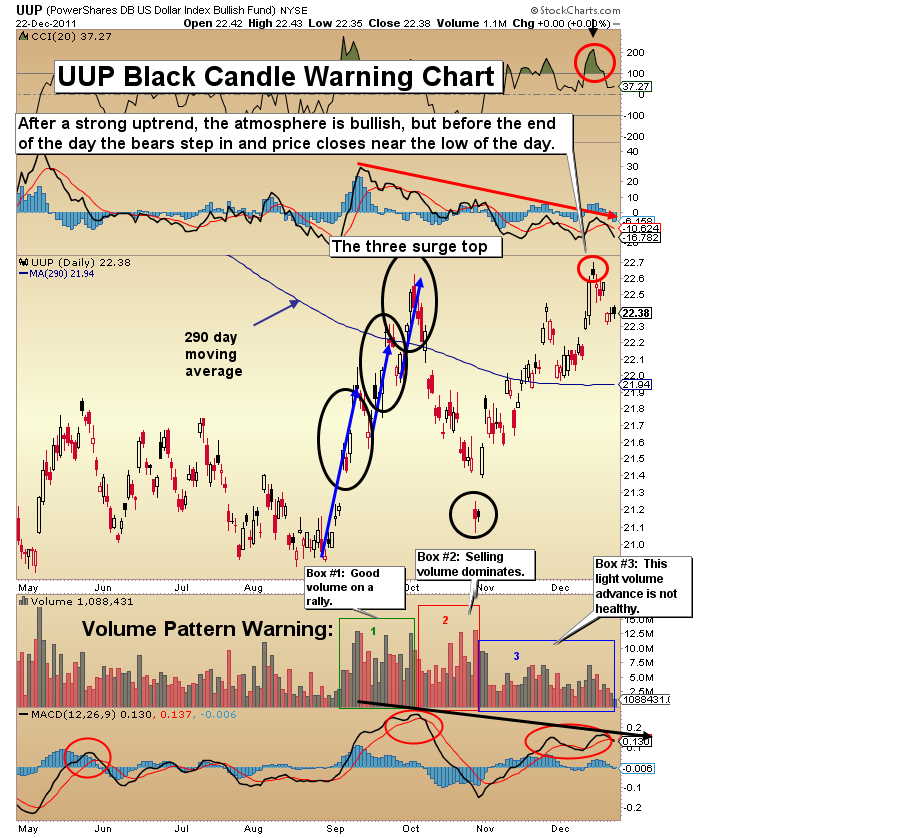
UUP (US Dollar Proxy) Chart
- I mentioned the black candle warning, and suggested that was opening the door for price appreciation in the metals and that is exactly what we got. I see the dollar headed much lower over the long term.
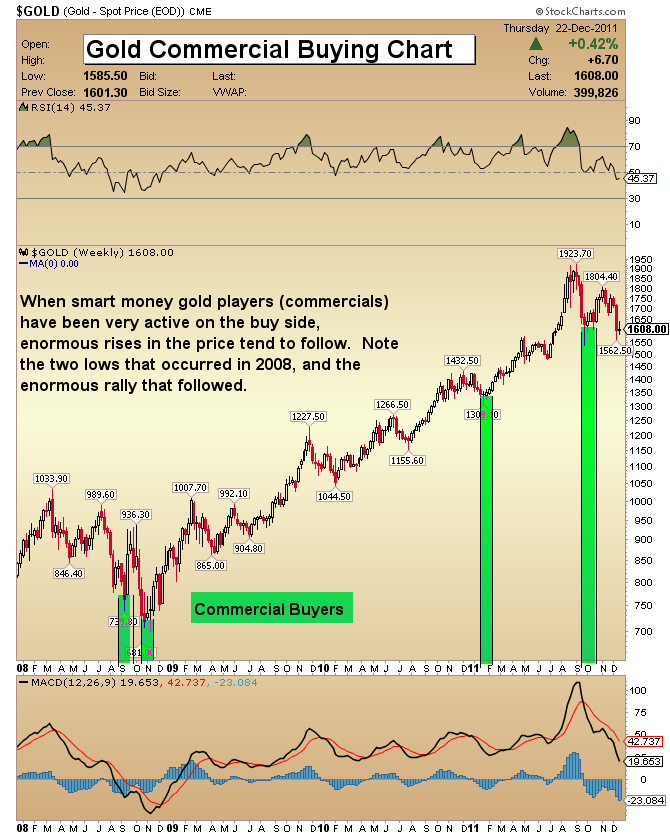
Gold Commercial Buying Chart
- Be careful about thinking you can outsmart the gold bull. Prices decline in every market, at times. This gold market has been hit with selling and fear, but it is a necessary cleansing process that puts gold into stronger hands.
- No gold investor enjoys this process, but gold should make new highs, many more times before this bull market ends. Gold is the ultimate long term winner in any debt crisis, and selling out because Europe’s debt woes are growing simply makes no sense at all.
- Looking at the above chart, you can see that in 2008, the gold price shot up about 33%, after the initial commercial buying. From there the low was violated by about $57. That technical failure was greeted with even more commercial buying. From there, the price soared almost 50% in just four months, hitting an all-time high.
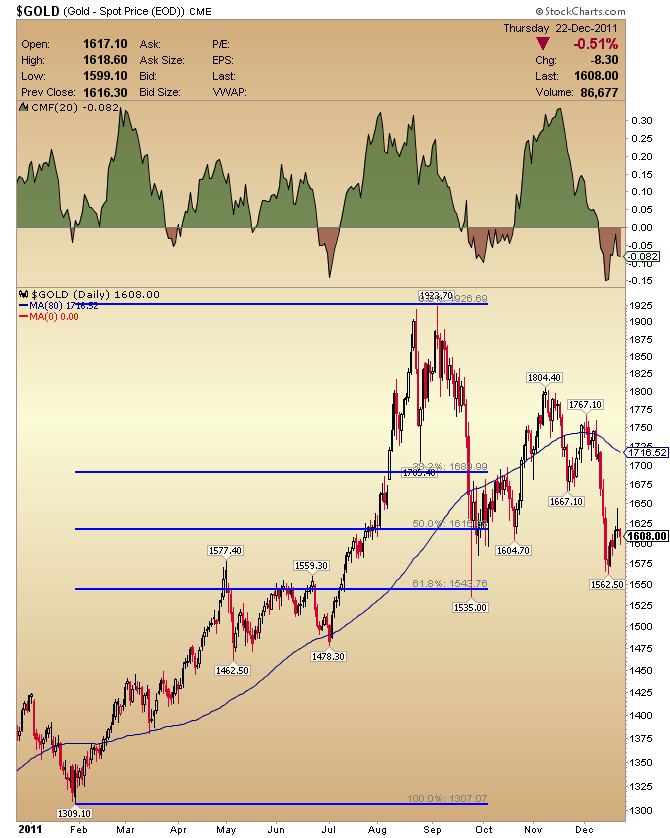
Gold Fibonacci Support Chart
- $1540 is a very important price point for gold. It is a major area of support. There is potential for a double bottom in play, and it is accompanied by heavy commercial buying. Historically, such buying has had great impact on the gold price, carrying it substantially higher.
- Further, the upwards trending 290 day moving average is near $1540 now. The key Fibonacci 61.8% retracement line also sits near $1540. If this market does go down to test $1540, I see a strong chance it passes that test with flying colors.
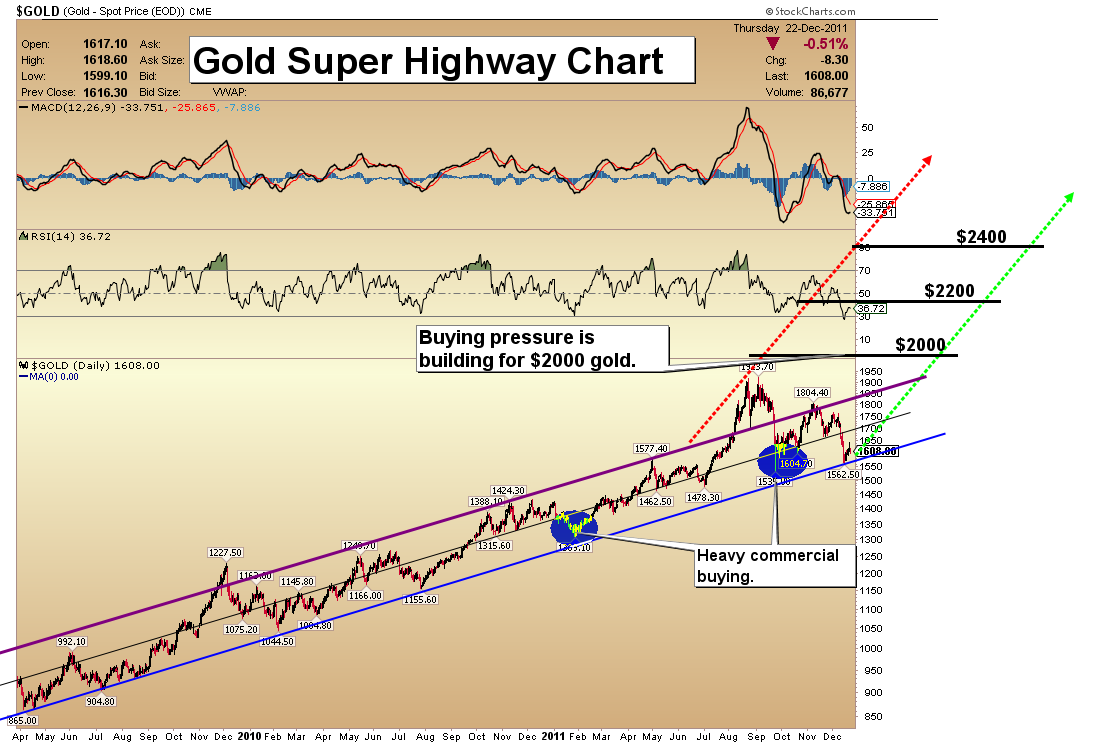
Gold Super Highway Chart
- All signals look good to see gold $2330 in 2012 and likely by mid-year. I was becoming concerned that my superhighway price channel was too narrow, but this correction has made the channel I envision more realistic.
- Quite a number of gold investors are now shorting gold, and that is becoming a bit of a wild card. A short-covering rally is very possible as the tax-loss selling dries up and buyers begin to dominate sellers.
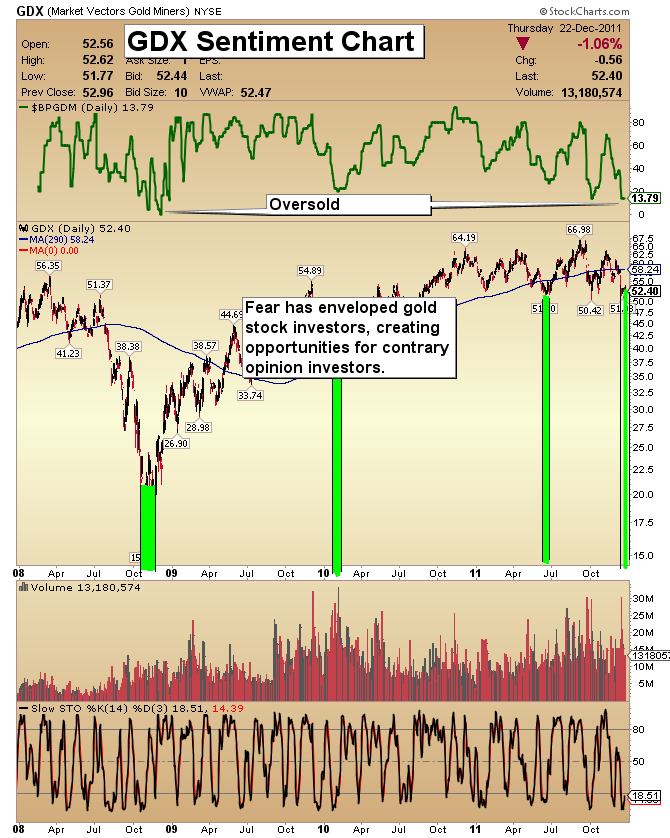
GDX Sentiment Chart
- In recent weeks I have used the COT report to highlight key support for the gold bullion market. In addition, I have now identified key sentiment indicator support for gold stocks.
- Note the times of extreme sentiment on gold stocks over the past several years. These extremes are present now, and have historically offered good times to buy gold stocks.
- Although there is no guarantee that history will repeat the same way as it has in the past, you do not invest in high risk gold stocks for guaranteed returns, but rather for the kind of possible reward that is offered now. Nobody should invest in gold stocks for “safety”.
- Gold stocks are all about taking big risks and hoping for even bigger rewards. The message of gold stocks sentiment now is to hold existing positions and buy new ones.
- As a group, my current sentiment indicator readings are the most extreme dating back to the days of the Lehman collapse in 2008.
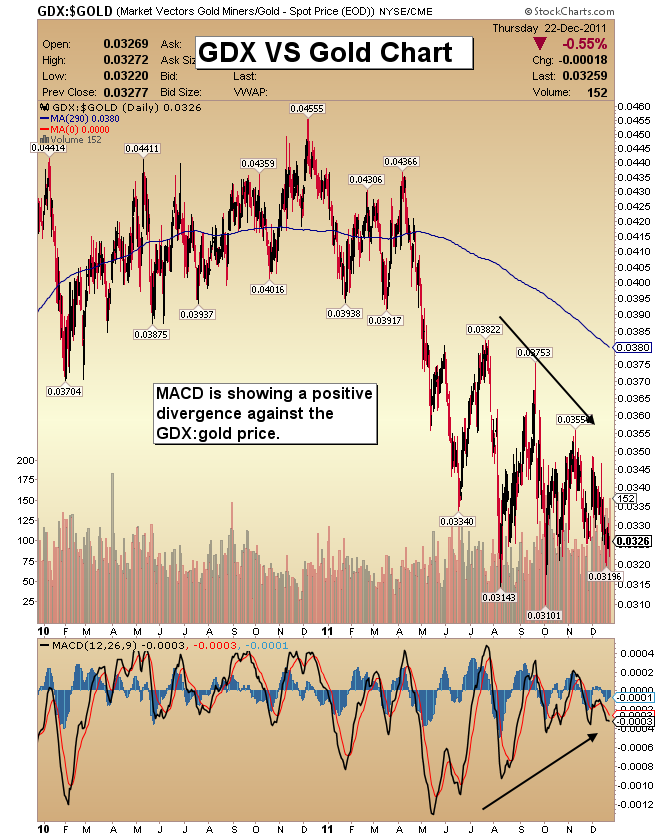
GDX Versus Gold Chart
- Every Indicator I look at is saying that if the bottom is not in, it is very close to being here. The MACD on the above GDX versus gold ratio chart is phenomenally bullish, and projects a big upside move for the gold sector. It indicates that gold stocks will likely also outperform when the next breakout in gold occurs. Position yourself now for price appreciation in gold stocks.
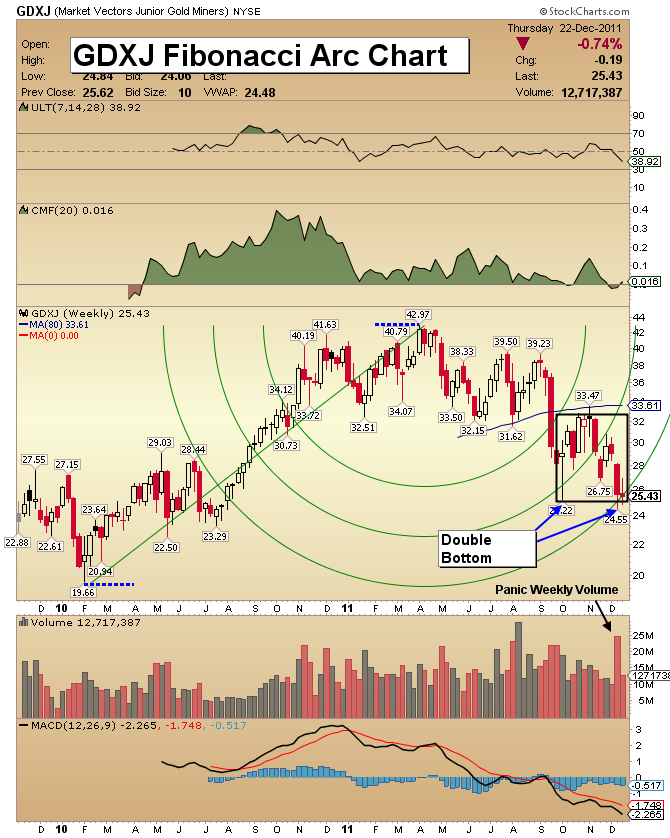
GDXJ Fibonacci Arc Chart
- A week ago I pointed out the double bottom that was forming on GDXJ. That bottom now looks to be solidly in place. Note that the weekly chart MACD is completing a one-year decline and is close to turning up.
- The difference between an arc and a regular Fibonacci line is that the price can retrace to any price point along the arc.
- The Fibonacci arc defines a certain time point as more important than any particular price point.
- Fibonacci arcs can reveal possible turning points in time, and we are at an important Fibonacci arc point now. For GDXJ, the price at $26 is resting on the 3rd retracement arc. Significant rallies can begin from these types of technical set-ups.
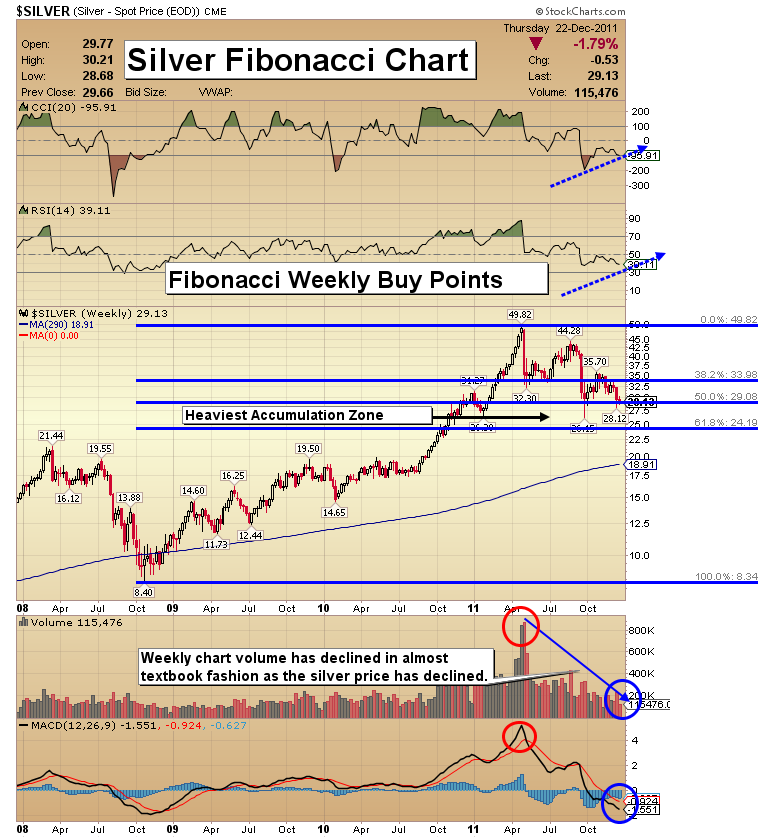
Silver Fibonacci Chart
- The silver bottom may very well be in, but if it’s not, the above chart gives a clear indication of where the bottom will likely be found. I continue to see the likelihood that silver is ready to begin its next ascent, but the 61.8% Fibonacci retracement line sits near $25, and that is a key buying area, if it happens.
- If it does happen, my plan is to dramatically enlarge my already-large silver position. I am holding most of my silver for triple digit targets (more than $100 per ounce).
- Volume patterns are textbook bullish. It is important for silver investors to be careful about using it only as a trading vehicle. Silver is also a key asset and your focus should be on getting more!
Merry Christmas to everyone. Thank-you for your patronage!
Friday, Jul 3, 2026 Super Force Signals Unique Introduction For 321Gold Readers:
Send me an email to admin@supergoldsignals.com and I’ll send you my free “Inflation Thunder Now!” gold and silver stocks video report. I’ll also include 3 of my next Super Force Surge Signals free of charge, as I send them to paid subscribers. Thank you!
|
Stay alert for our Super Gold alerts, sent by email to subscribers,
for both the daily charts on Super Force Signals at www.supergoldsignals.com and for the 60 minute
charts at www.supergoldsignals.com
About Super
Gold Signals:
Our Surge Gold Signals are created thru our proprietary blend
of the highest quality technical analysis and many years of successful
business building. We are two business owners with excellent synergy.
We understand risk and reward. Our subscribers are generally successfully
business owners, people like yourself with speculative funds,
looking for serious management of your risk and reward in the
market.
Frank Johnson:
Executive Editor, Macro Risk Manager.
Morris Hubbartt: Chief Market Analyst, Trading Risk Specialist.
website: www.supergoldsignals.com
email:
admin@supergoldsignals.com
email: admin@supergold60.com
Mail:
1276 Lakeview Drive
Oakville, Ontario, L6H 2M8
Canada
###
Dec 23, 2011
Morris Hubbartt
321gold
Ltd

|
