Super Force Signals - A Leading Market Timing Service
We Take Every Trade Ourselves
Silver Shoots For Lucky Number 7 Morris Hubbartt
Weekly Market Update Excerpt
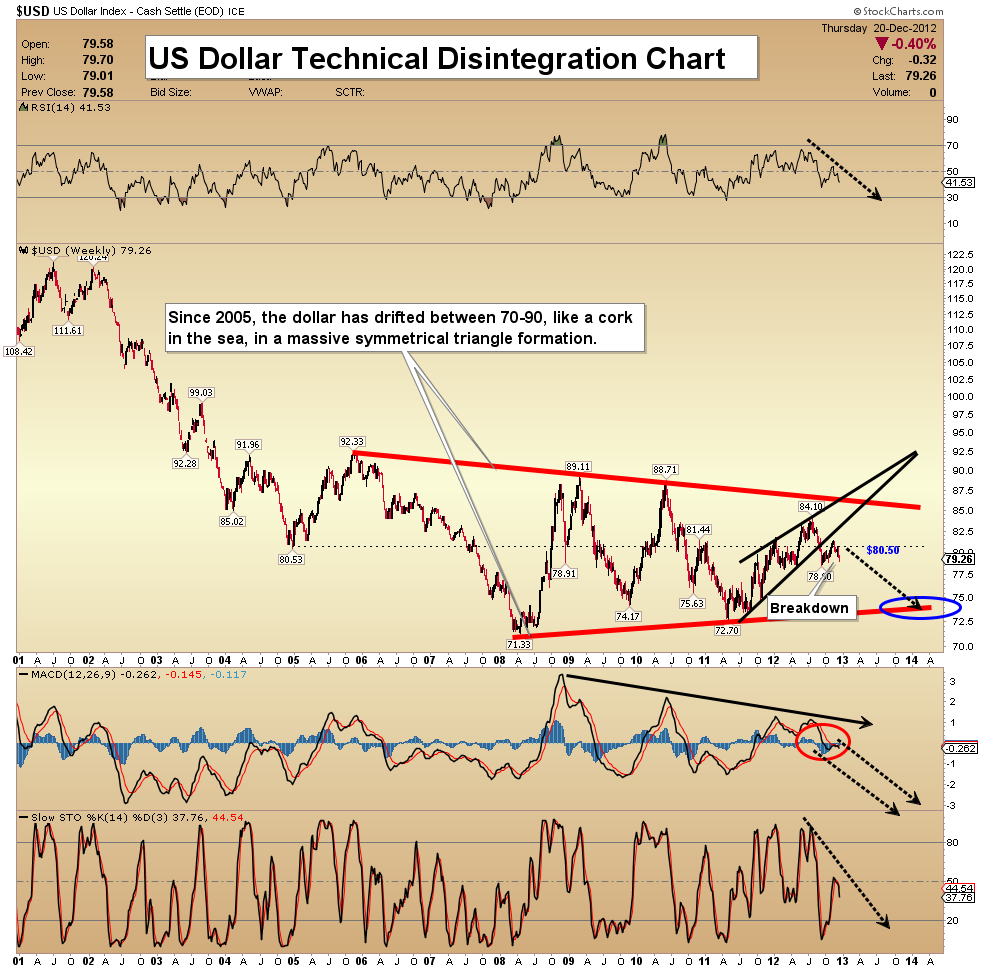
posted Dec 21, 2012 US Dollar Technical Disintegration Chart - The dollar continues to drift sideways to lower, within the enormous triangle formation. I’ve highlighted that in red color.
- RSI was unable to hold above the key 50 level. It’s breaking down now.
- MACD shows a negative divergence. The dollar made a minor high at 84.10, but MACD failed to do so, and it’s rolling over.
- Slow “Stokes” (Stochastics) also failed at the 50 line, and is heading lower.
- When buying gold based on strength in the dollar, it’s very important to avoid the use of heavy leverage. My suggestion is to use dollar strength and gold weakness to purchase physical gold.
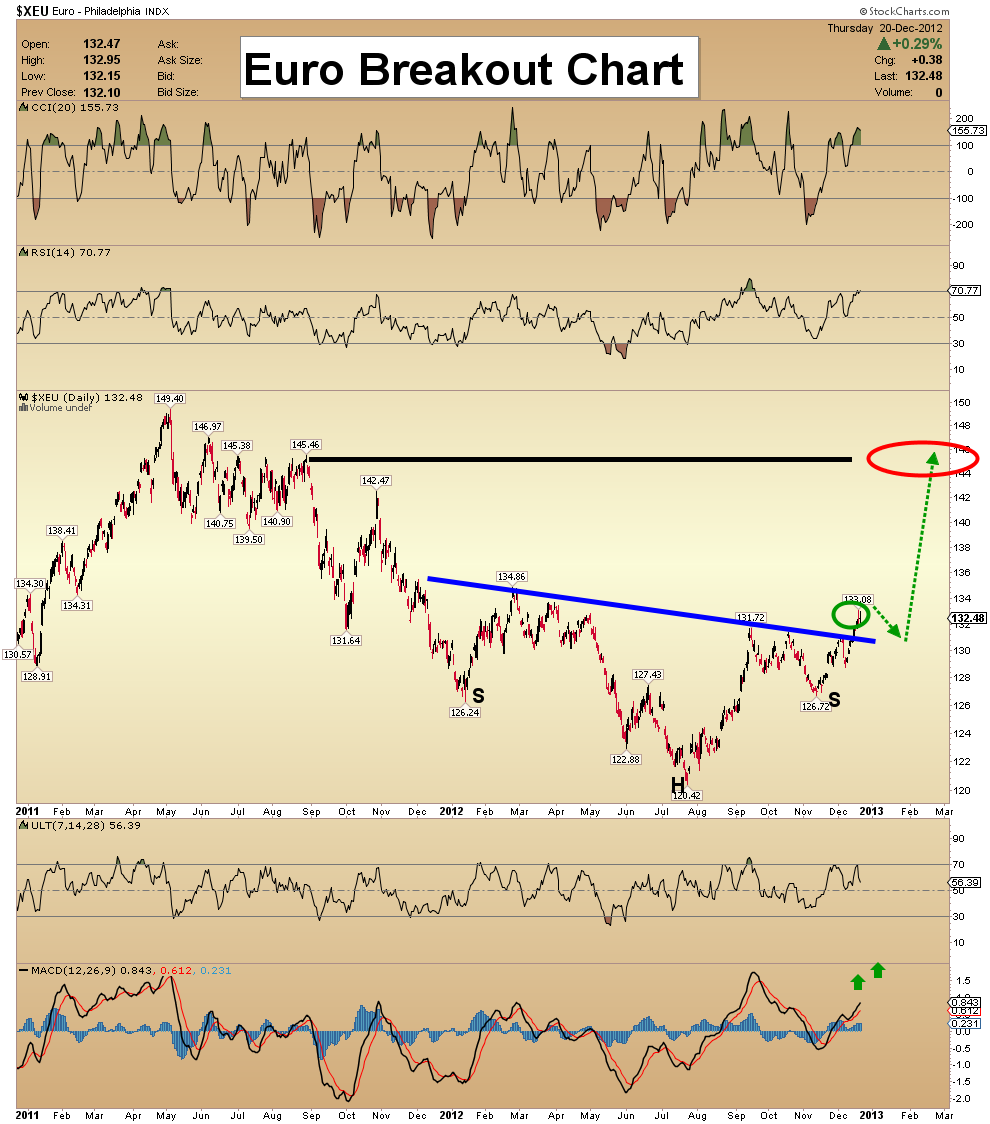
Euro Breakout Chart - I am highlighting a nice inverse head and shoulders formation on this chart. The euro has “officially” broken out to the upside. The H&S pattern is projecting an additional gain of 14 points, which is about 10%.
- The euro has now gotten overbought and the price could drop back to the neckline area, before making a move to my upside target at 146.
- In the big picture, a stronger euro is good for gold.
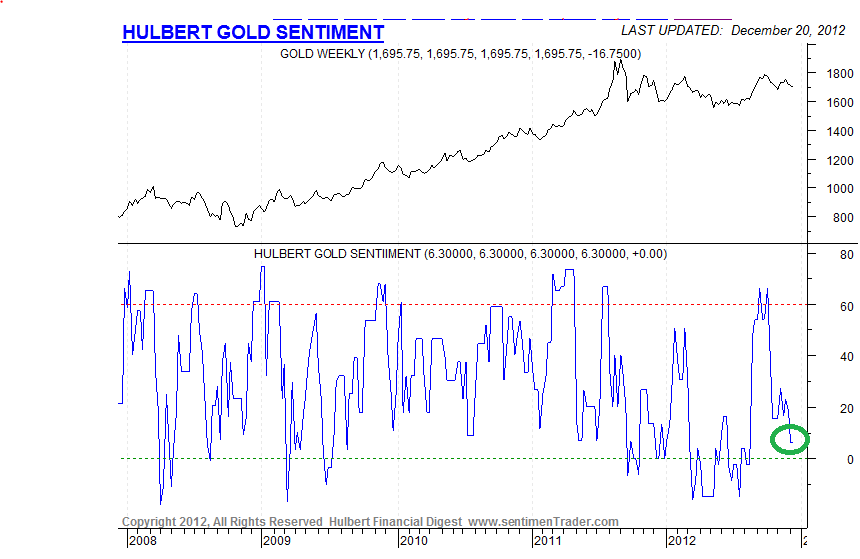
Gold Sentiment Chart - This chart shows gold sentiment, courtesy of www.sentimentrader.com and Hulbert's gold survey. Gold timers are only about 10% long gold.
- There is a real possibility that the next report will show they are actually net short the gold market. The mood amongst gold investors now is downright pessimistic.
- I think the pendulum has swung far enough, and gold is now ready for a major advance.
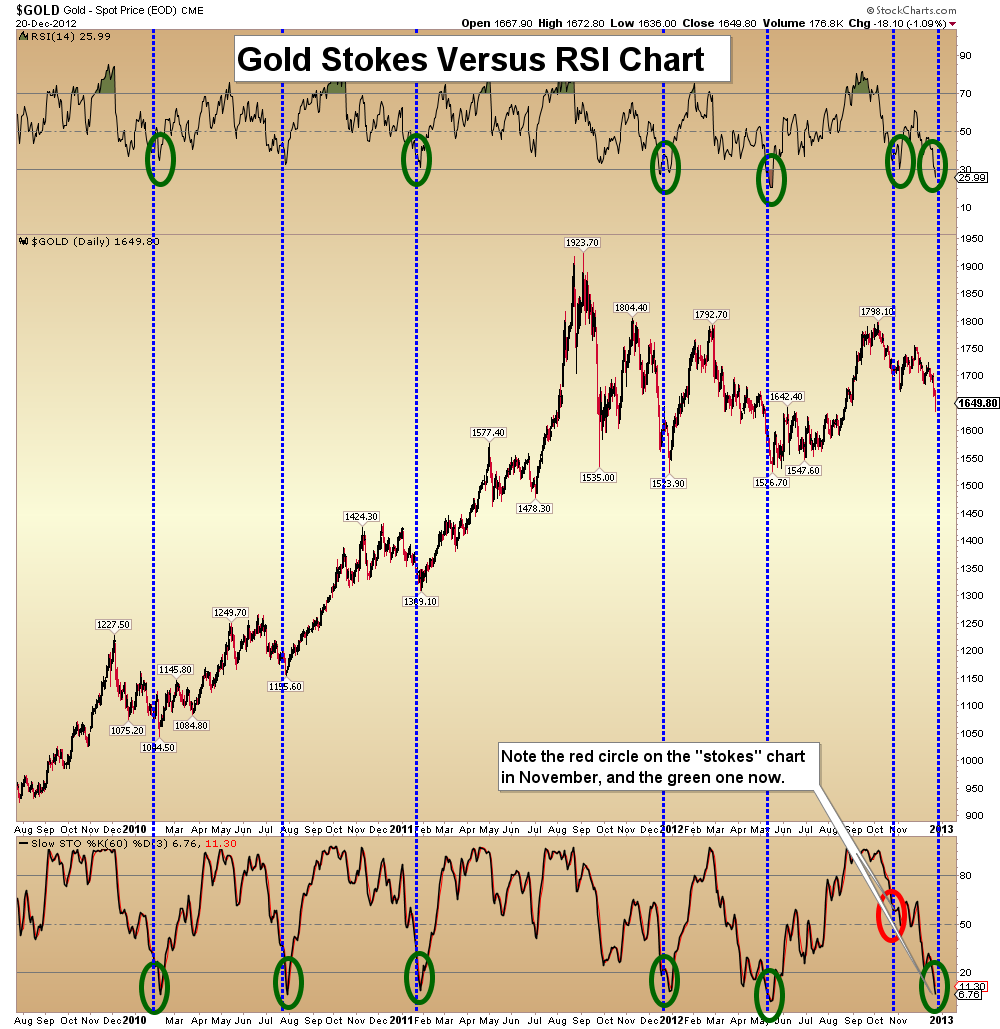
Gold Stokes Versus RSI Chart - My technical work suggested an upside breakout would occur in the October to December time frame. I was clearly wrong.
- The bullish move didn’t happen, largely because of tax-loss selling and the fiscal cliff. Investors still need to hold their positions. There has been a set-back in technical timing, but not in the main fundamentals of this gold bull market.
- To feel more comfortable in the gold market, use both fundamental and technical analysis.
- Technically, gold is on very solid footing. The market is oversold now. Hold your positions. In May, both the “Stokes” and RSI oscillators became heavily oversold, and gold rallied from about $1550 to $1800.
- In November, I thought gold could stage another big rally, even though the Stokes were sitting near the 50 level on this chart. A small rally occurred, but now both the Stokes and RSI are set up more like they were in May. I’m predicting a very big rally will occur in January, much like the one that began in the spring.
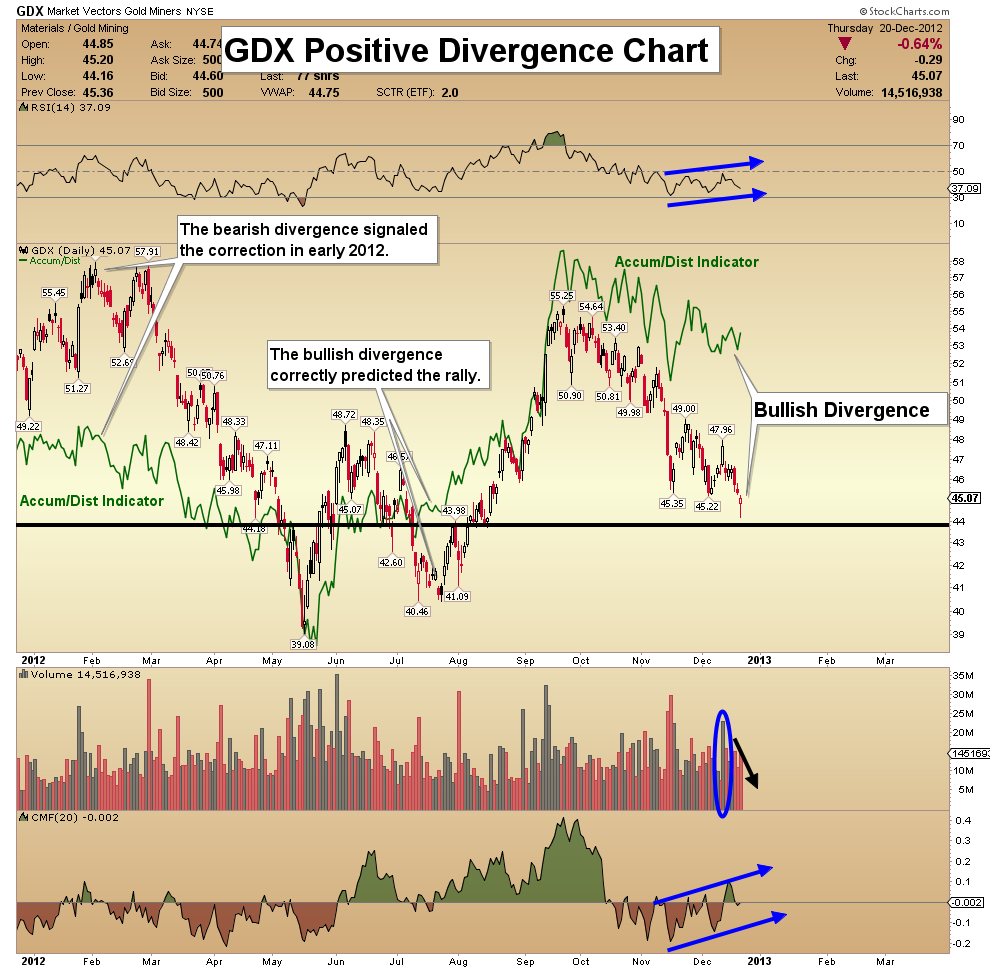
GDX Positive Divergence Chart - During this tax loss selling season, volume-based support has been tested, but it has not broken.
- Note the positive divergences that are in play on both the RSI and CMF indicators.
- The accumulation/distribution indicator has a strong record of calling turns, and it is suggesting GDX is about to turn higher.
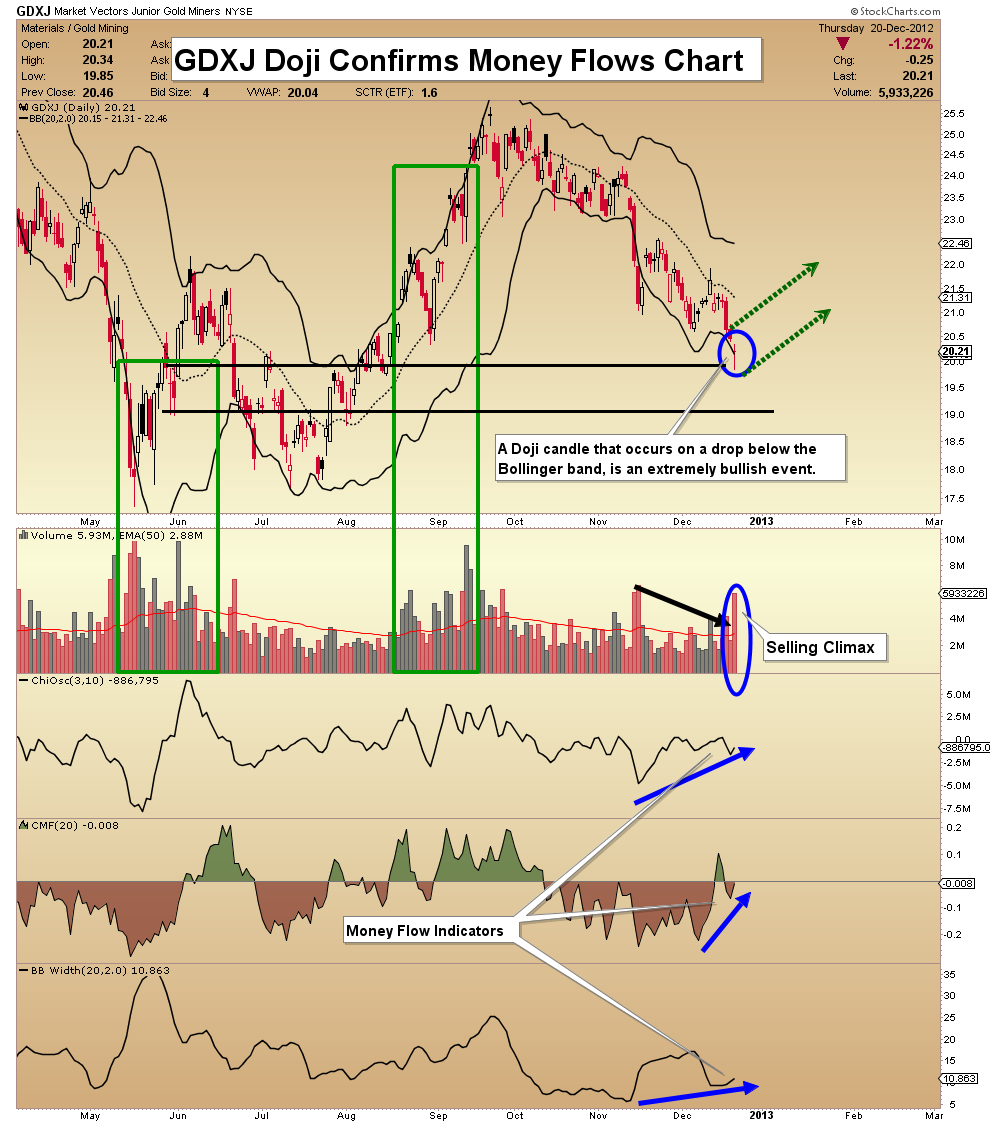
GDXJ Doji Confirms Money Flows Chart - My money flow indicators are demonstrating that accumulation is likely occurring in the junior gold stocks sector.
- The Doji candle that occurred outside the lower Bollinger band yesterday, is a very bullish event. It is technical confirmation of the money flows.
- Note the volume-based support in this price area. I’ve highlighted it with green boxes on the chart.
- Junior gold stocks are ending the year on a disappointing note, but the technical set-up suggests a big rally will occur early in the New Year.
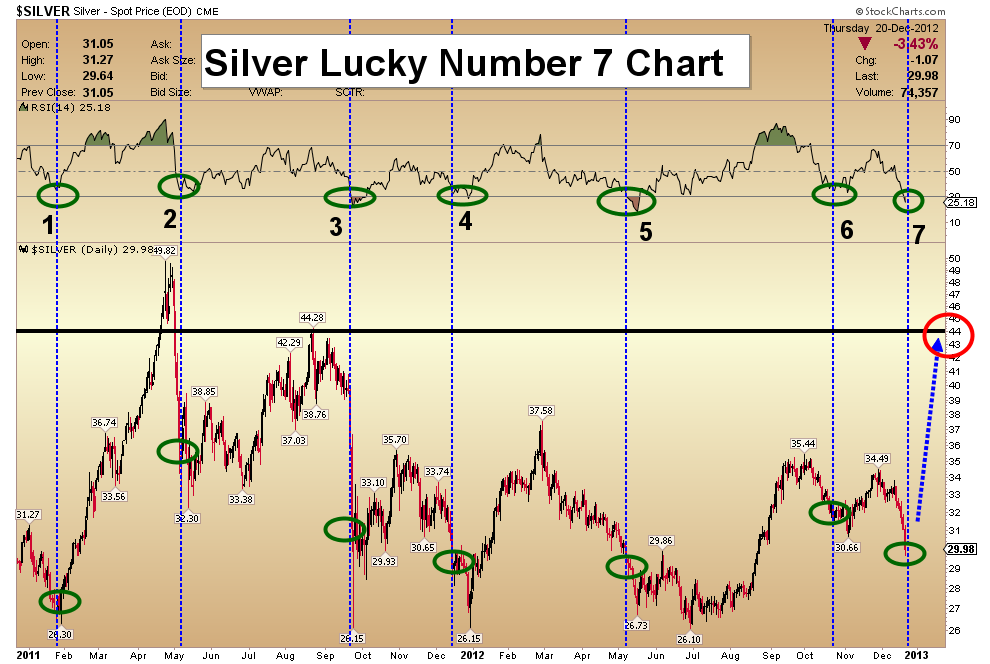
Silver Lucky Number 7 Chart - The pullback in silver this week brought the important RSI indicator back down to the key 30 area. Silver is one of my favorite long term growth investments.
- On this chart, RSI for silver has declined to 30 area, seven times. Six big rallies have occurred after each of those events. Will this time be “lucky number 7”? I think so, and my target for this rally is $44.
Friday, Jul 3, 2026 Super Force Signals Unique Introduction For 321Gold Readers:
Send me an email to admin@supergoldsignals.com and I’ll send you my free “Inflation Thunder Now!” gold and silver stocks video report. I’ll also include 3 of my next Super Force Surge Signals free of charge, as I send them to paid subscribers. Thank you!
|
Stay alert for our Super Gold alerts, sent by email to subscribers,
for both the daily charts on Super Force Signals at www.supergoldsignals.com and for the 60 minute
charts at www.supergoldsignals.com
About Super
Gold Signals:
Our Surge Gold Signals are created thru our proprietary blend
of the highest quality technical analysis and many years of successful
business building. We are two business owners with excellent synergy.
We understand risk and reward. Our subscribers are generally successfully
business owners, people like yourself with speculative funds,
looking for serious management of your risk and reward in the
market.
Frank Johnson:
Executive Editor, Macro Risk Manager.
Morris Hubbartt: Chief Market Analyst, Trading Risk Specialist.
website: www.supergoldsignals.com
email:
admin@supergoldsignals.com
email: admin@supergold60.com
Mail:
1276 Lakeview Drive
Oakville, Ontario, L6H 2M8
Canada
### Dec 21, 2012
Morris Hubbartt
321gold Ltd
 |
