Super Force Signals - A Leading
Market Timing Service
We Take Every Trade Ourselves
USD Black Candle In Play
Morris Hubbartt
Weekly Market Update Excerpt
posted Dec 16, 2011
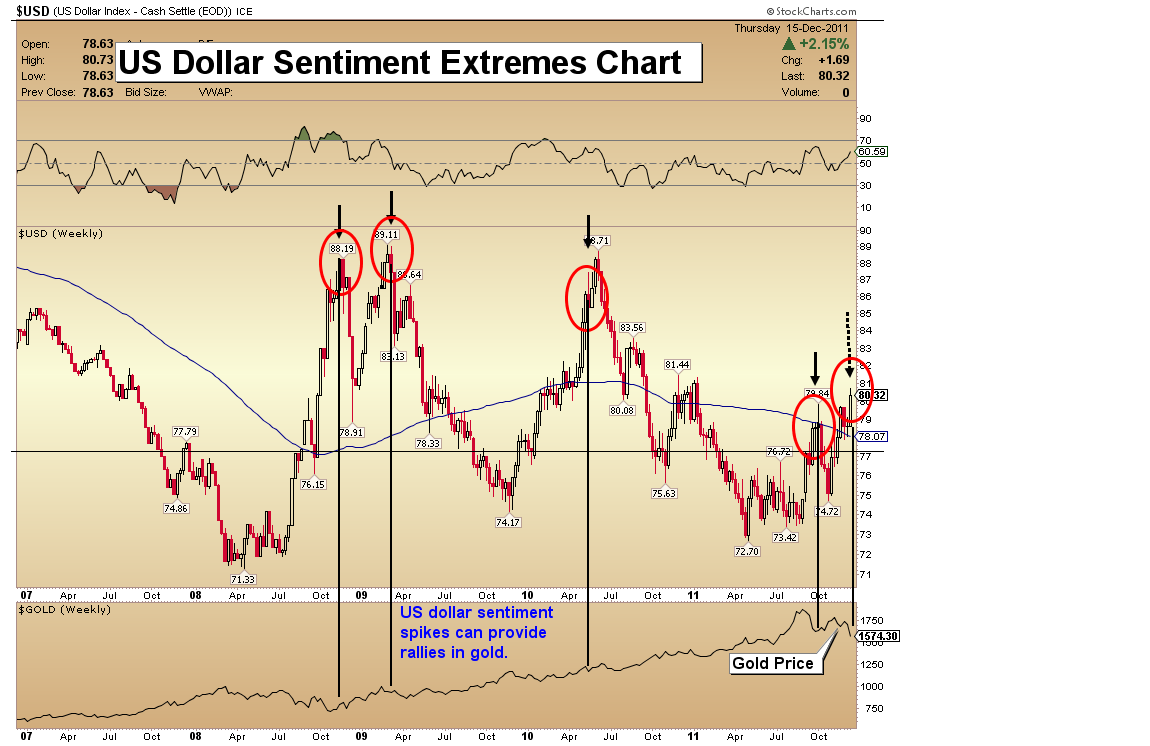
US Dollar Sentiment Extremes Chart
Analysis
- When Rome burned, you have to wonder if the news carriers of the day called the dilution of their currency a reason to buy it as a safe haven, as they do with the US dollar today. Un-payable US debt and dilution of our nation’s currency are twisted into fundamental buy signals for the dollar, by today’s media. Unfortunately, most investors have no problem with acting on these “buy signals”. I have two interesting US dollar charts for you to look at today.
- The first is my sentiment extremes chart. Note the areas of price spikes for the dollar. These spikes are generally associated with fear-induced money flows. Without exception, the dollar has tanked within a few days of the appearance of these spikes.
- Even more interesting is the effect that these spikes have had on gold. Rallies in gold tend to follow the spikes, and the current gold correction looks to be coming to an exhaustive end.
- How much weaker is the financial system now than it was 2008? Fiat currencies are not the solution to your financial security. Quite frankly, too many people in the west just don’t understand that gold is the ultimate currency.
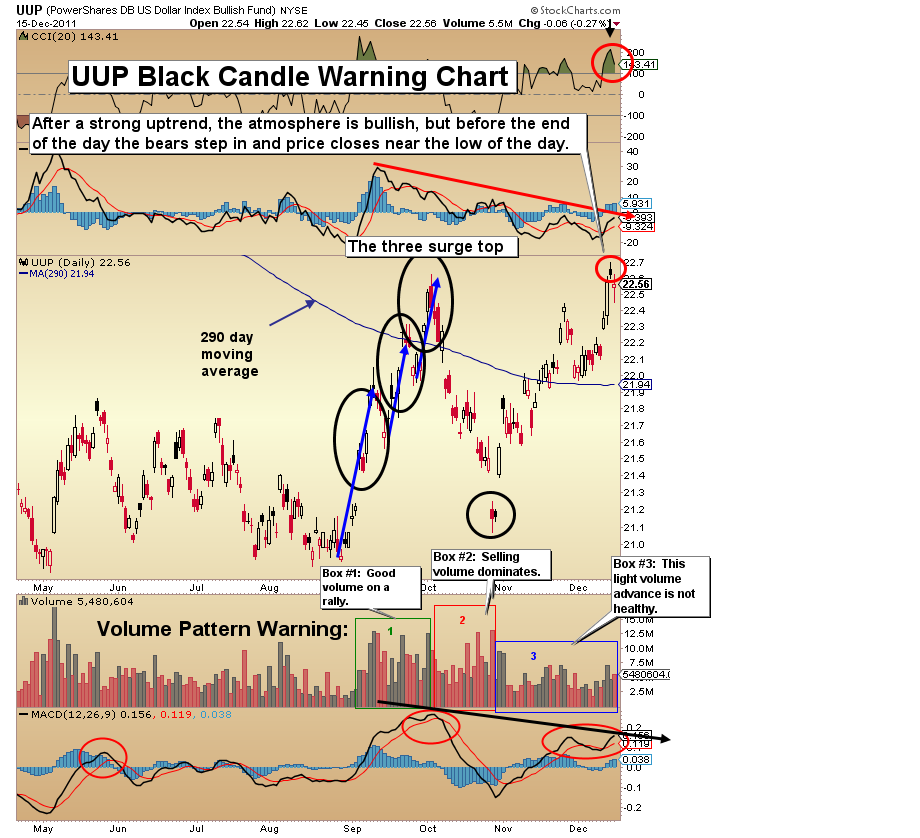
UUP (US Dollar Proxy) Chart
- My second chart of the dollar is the UUP black candle warning chart. This chart demonstrates the dollar is in a strong uptrend, yet the uptrend is accompanied by a myriad of technical indicators issuing substantial warnings, and non-confirmation set-ups.
- A black candle offers a severe warning. After a strong uptrend, bears with deep-pockets stepped in, and UUP closed near the low of the day. There are just too many bulls in the dollar arena. Volume patterns are horrible. This is not major breakout volume, and the overall technical action indicates a top is either here or days away.
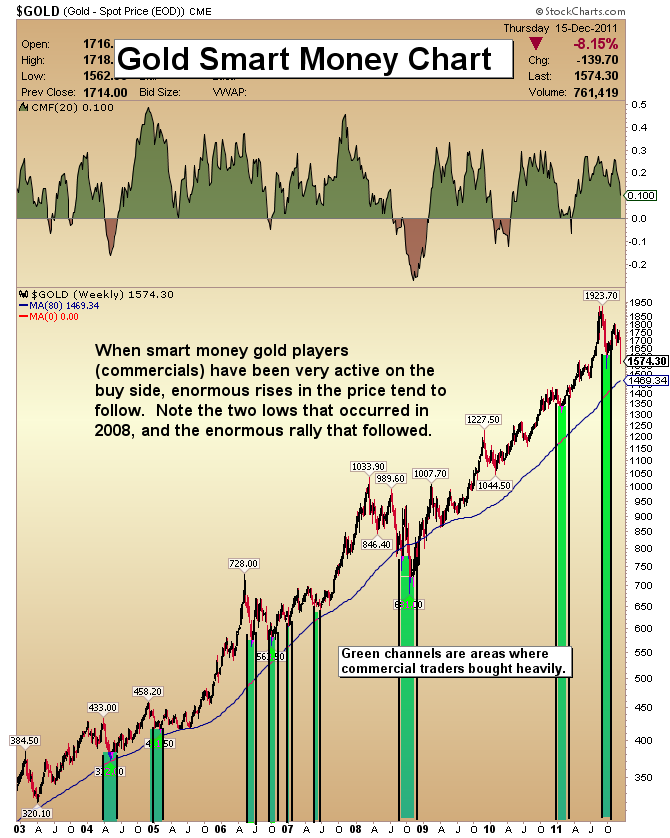
Gold Smart Money Chart
- I have updated this chart and set the time all the way back to 2003, to pinpoint heavy comex gold buying by commercial traders. Note the time period in late 2006 through mid-2007. After nearly a year, the price suddenly shot up 60% in just a few months.
- I believe the current setup in the gold market correlates best in that 2006-2007 period, rather than the “2008 again” theme that is currently so prevalent amongst analysts.
- My midyear 2012 target is $2330.
- On all of these “smart money lows”, the gold price did not generally break down to new lows once the commercials completed their buying. In many cases the lows were tested, as we see now, but not penetrated.
- There is a chance this week’s price weakness puts the commercials in the green (heavy buying and short covering) zone, and this afternoon’s COT report is going to be one of the most important reports released in this gold bull market. I will post a detailed follow-up for subscribers on the week-end about the report.
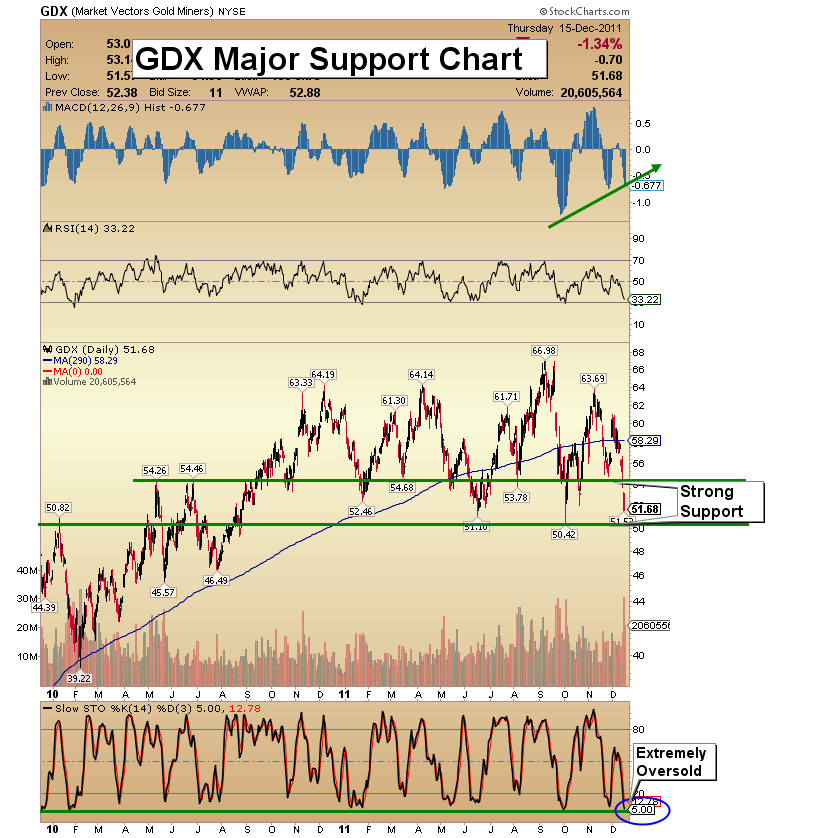
GDX Major Support Chart
- I have forecast bold intermediate and long term targets for gold stocks. One must understand that in any market, and in particular the precious metals sector, a quick punishing decline can unfold just prior to a major rally.
- Caution and fear are the ingredients necessary for sharp, sustainable rallies. As the caution and fear recede, sideline cash emerges and short covering unfolds, unleashing a powerful rally. The latest sentiment indicators are setting the stage for such an event.
- I see the risk trade coming back with a vengeance in 2012. People have panicked all year, and that type of selling runs only so far before it is exhausted. For 2012, I like general US equities, commodities, Chinese stocks, and above all, gold and silver and gold stocks.
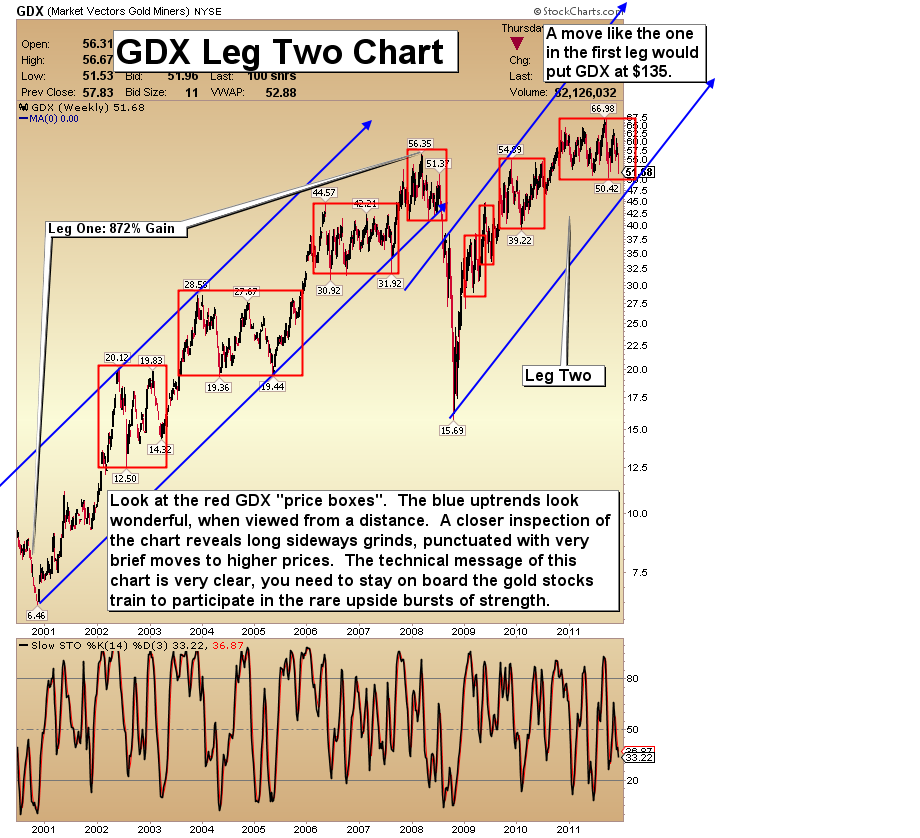
GDX Leg Two Chart
- It’s more important than ever to have the correct perspective on gold stocks. The potential gain from here is huge, yet it’s easy to let the current market psychology defeat you. As you can see, gold stocks make very little progress most of the time, but then dramatic bursts higher in their prices suddenly occur.
- You cannot afford to miss those moves by being out of gold stocks. Do not try to avoid falling prices. Just be sure you are in when the price rises occur. Hold your positions and keep a long term perspective!
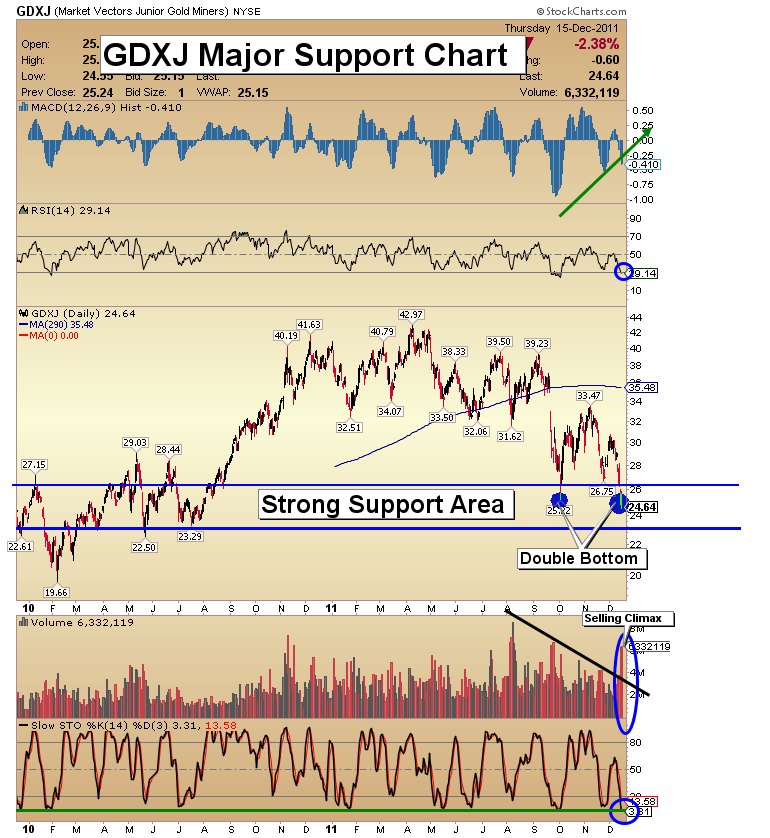
GDXJ Major Support Chart
- I want you to focus on the long term support areas for gold juniors. A two month double bottom is in place, and fundamentally, the value here is tremendous.
- Note the massively oversold slow Stochastics indicator, rising MACD histograms, and falling volume followed with selling climax day. All of this bullish technical action is occurring right in this zone of massive support.
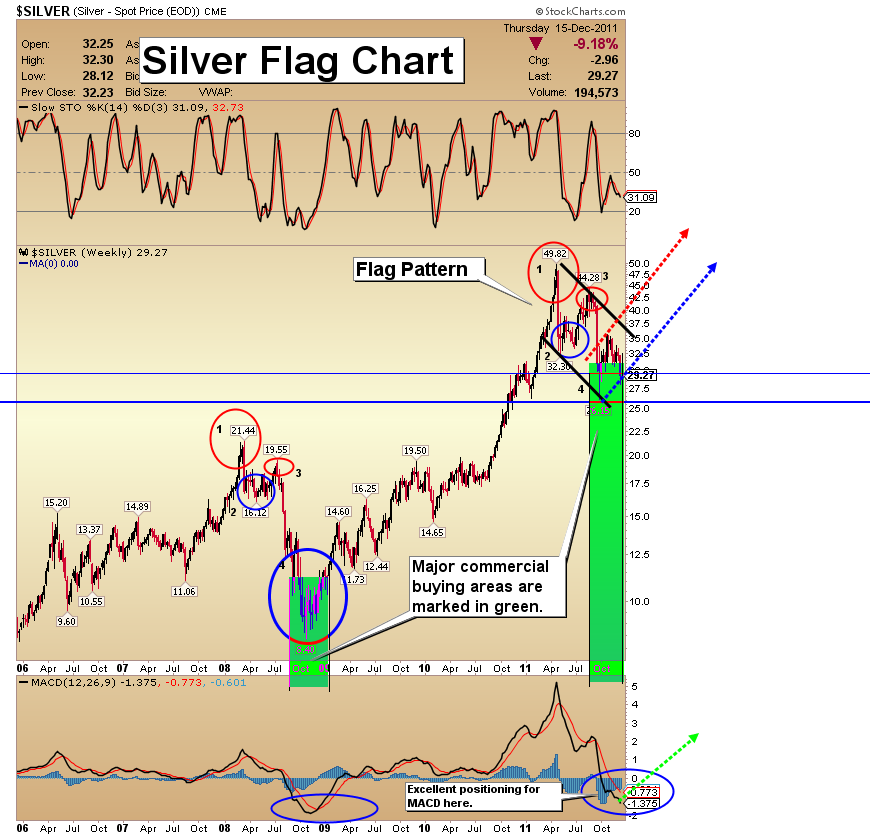
Silver Flag Chart
- Compared to gold, silver didn’t experience much of a sell-off, and the enormous flag pattern is absolutely intact. Technically, MACD continues to work its way lower while the histograms are not confirming those lows. Use this price weakness to build a position. Note the blue dotted arrow which I use to indicate that a new uptrend is either starting or about to start!
Friday, Jul 10, 2026 Super Force Signals Unique Introduction For 321Gold Readers:
Send me an email to admin@supergoldsignals.com and I’ll send you my free “Inflation Thunder Now!” gold and silver stocks video report. I’ll also include 3 of my next Super Force Surge Signals free of charge, as I send them to paid subscribers. Thank you!
|
Stay alert for our Super Gold alerts, sent by email to subscribers,
for both the daily charts on Super Force Signals at www.supergoldsignals.com and for the 60 minute
charts at www.supergoldsignals.com
About Super
Gold Signals:
Our Surge Gold Signals are created thru our proprietary blend
of the highest quality technical analysis and many years of successful
business building. We are two business owners with excellent synergy.
We understand risk and reward. Our subscribers are generally successfully
business owners, people like yourself with speculative funds,
looking for serious management of your risk and reward in the
market.
Frank Johnson:
Executive Editor, Macro Risk Manager.
Morris Hubbartt: Chief Market Analyst, Trading Risk Specialist.
website: www.supergoldsignals.com
email:
admin@supergoldsignals.com
email: admin@supergold60.com
Mail:
1276 Lakeview Drive
Oakville, Ontario, L6H 2M8
Canada
###
Dec 16, 2011
Morris Hubbartt
321gold
Ltd

|
