Super Force Signals - A Leading Market Timing Service
We Take Every Trade Ourselves
Ultimate Oscillator Gold Analysis Morris Hubbartt
Weekly Market Update Excerpt
posted Dec 14, 2012
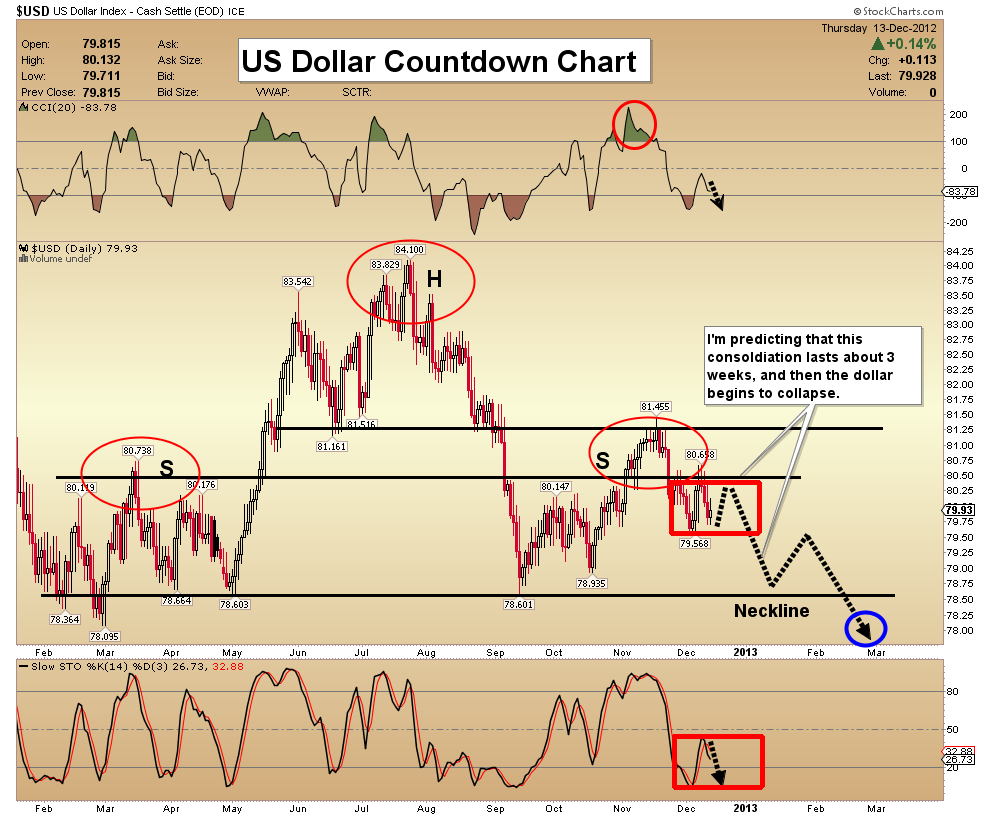
US Dollar Countdown Chart - I am looking for a pause in the movement of the dollar, for about 3 weeks. Note the large head & shoulders top on the chart.
- When significant top patterns are in play, traders should ignore buy signals given by technical indicators like CCI and Stochastics.
- The right shoulder needs time to build symmetry with the left one, and the 3 week consolidation should do it. From there, I am projecting that the dollar attempts to penetrate the neckline, near 78.50.
- Once the neckline breaks, a target of 73 will be activated, and gold should begin to rally aggressively.
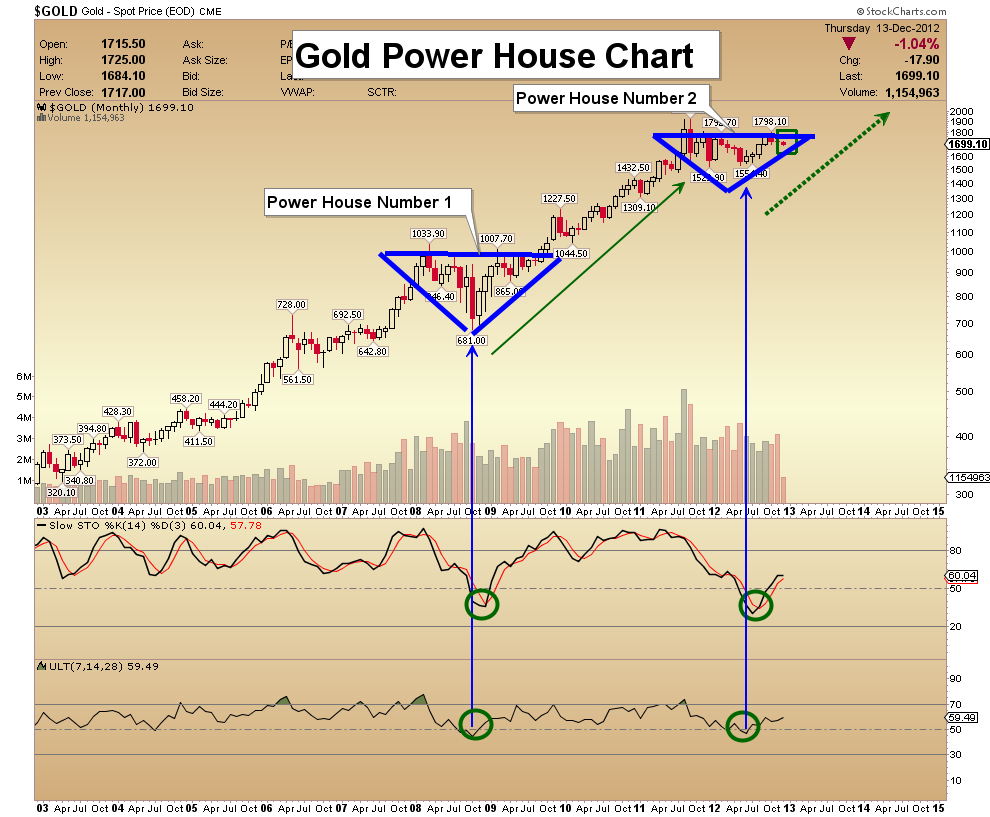
Gold Power House Chart - The general attitude from Wall Street about the gold bull market is disbelief and denial. From the standpoint of contrary opinion, this viewpoint is bullish for the precious metals.
- The longer gold takes to break out of the current “power house” consolidation, the more explosive the move is likely to be.
- On this key monthly chart, note the action of “Slow Stokes” (Stochastics) indicator and the Ultimate Oscillator (UO). The UO incorporates longer timeframes into the basic formula that creates it, which makes it very dependable.
- It has a spectacular record of calling exact bottoms in gold, and the Slow Stokes tends to reliably confirm these turns.
- Note how similar this market rally is to the one that was born at the 2008 lows. I believe that gold is on the cusp of entering a “new price era”.
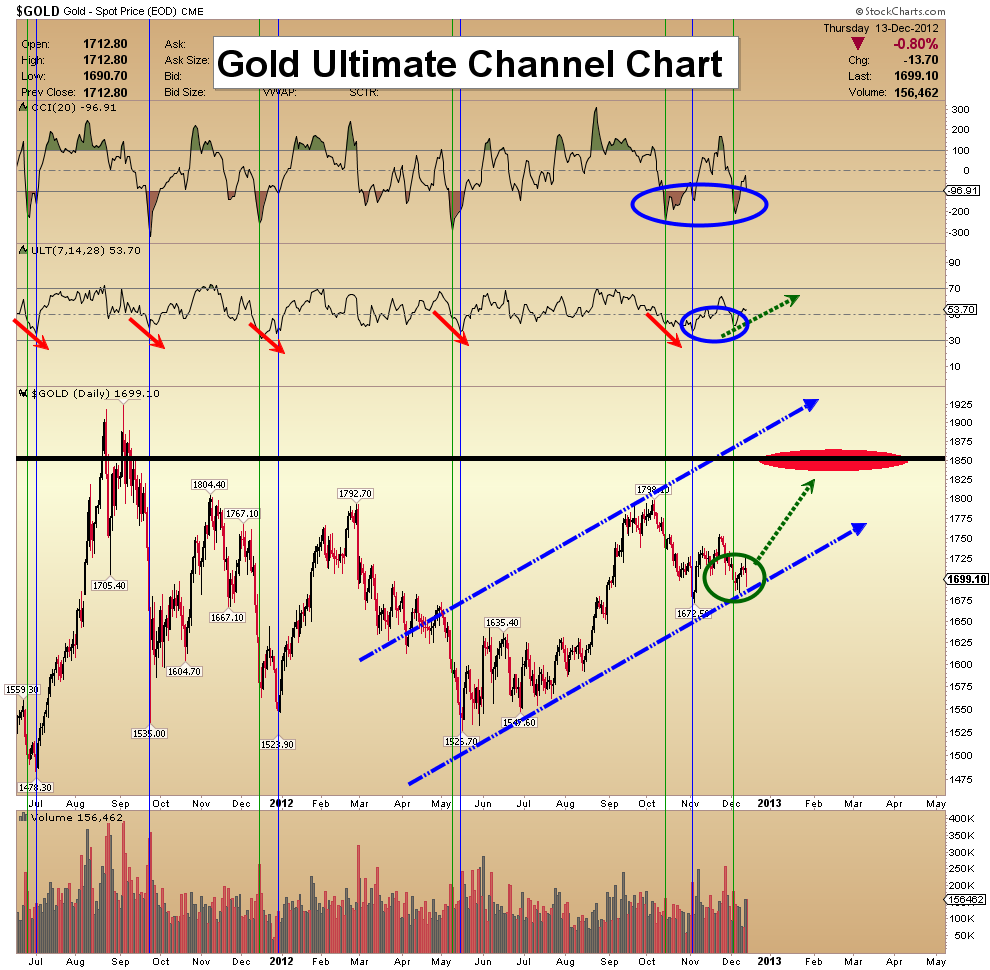
Gold Ultimate Channel Chart - This daily chart shows that gold has been in a solid uptrend since bottoming in May. A double bottom formed, and now a wide channel is in place. The indicators are positioned nicely. My target is $1850, and it should be acquired early in the new-year.
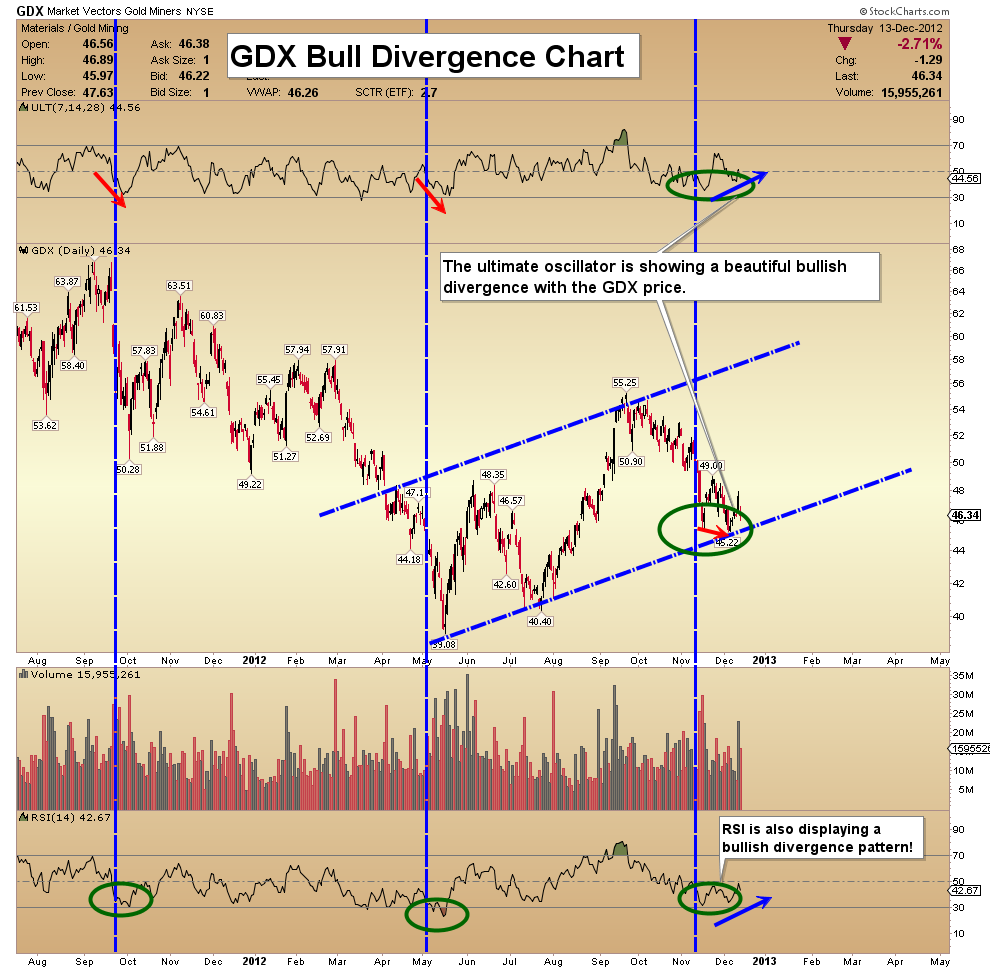
GDX Bull Divergence Chart - Both RSI and the UO are showing strong bullish divergences with the GDX price, in the short term.
- There is also a channel forming that is very similar to the channel that has formed in gold itself.
- I have a $58 target for GDX, and I expect it to be acquired later in January, as the bearish consolidation in the US dollar comes to a close, and a new leg down in the dollar helps push gold stocks higher.
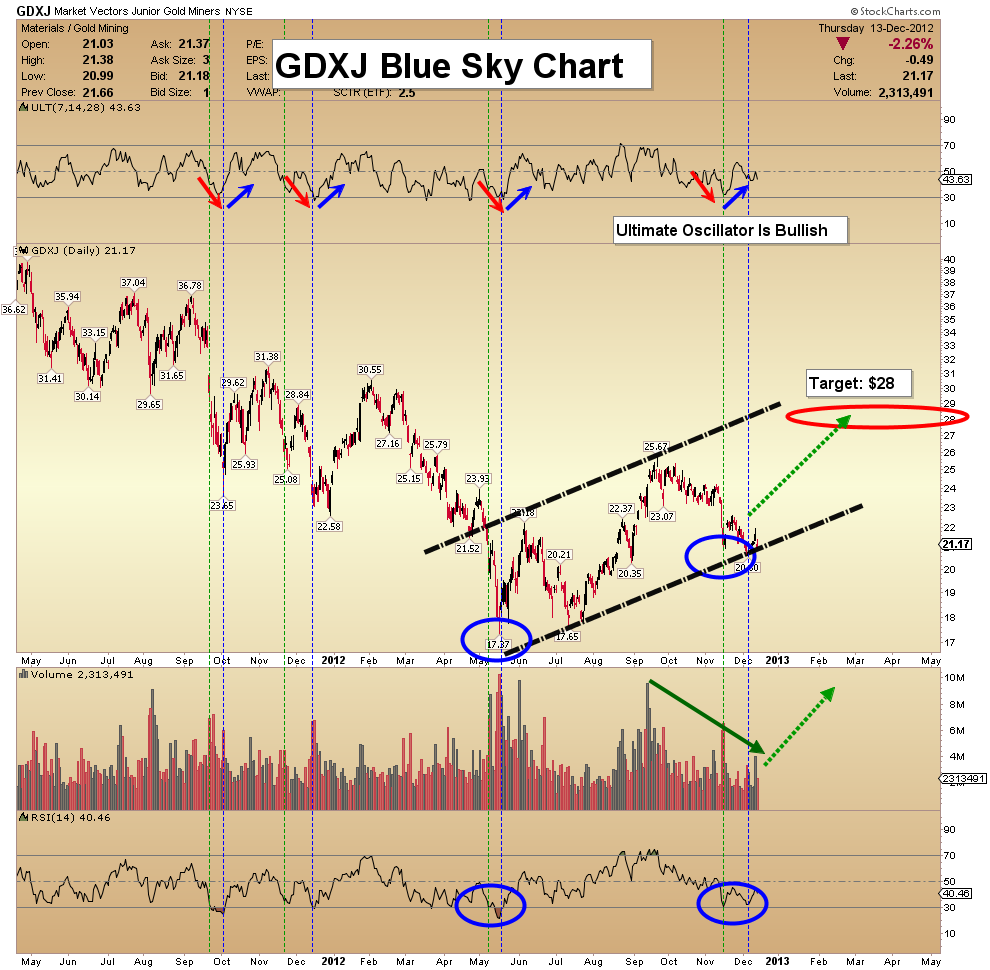
GDXJ Blue Sky Chart - The UO and RSI divergences are as bullish for GDXJ as they are for GDX.
- Note the drop in volume that has occurred all through this correction. The volume pattern suggests that a powerful rally should occur, and my target is $28.
- Technically, for junior gold stocks, the sky is blue!
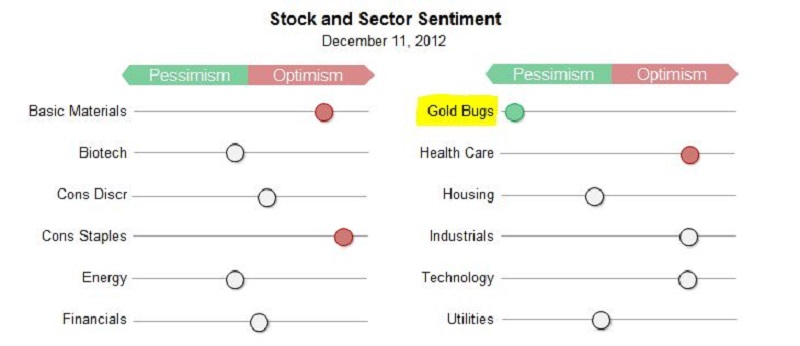
Gold Stock Sentiment Chart - This chart is courtesy of www.sentimentrader.com . You can see that of all the stock sectors on Wall Street, gold stocks are the least favoured group. The current sentiment occurs with prices about 20% above the May lows, and that is setting the stage for a significant rally.
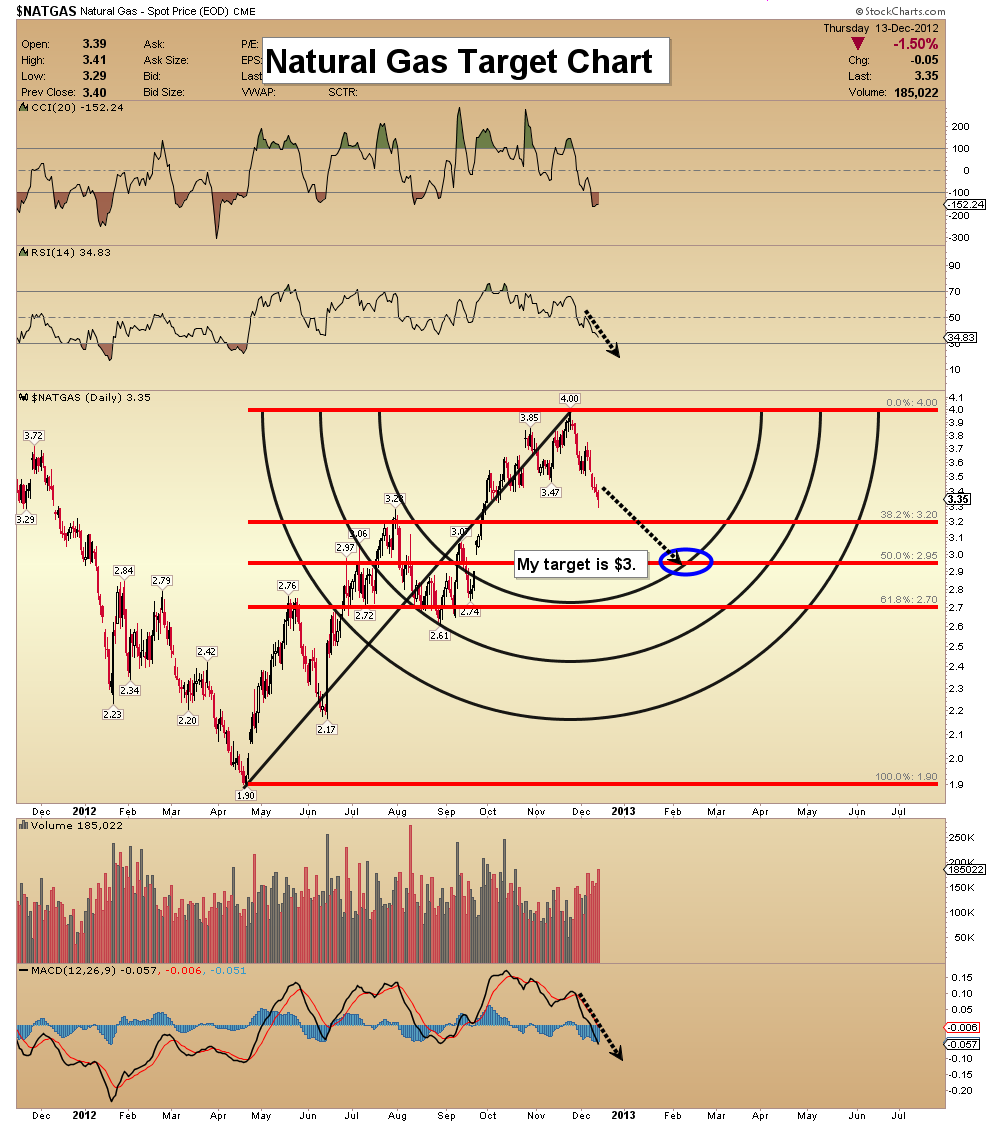
Natural Gas Target Chart - I brought Nat Gas to your attention about a month ago, and projected a correction would occur, with a target of $3.
- It is now approaching that price, and I don’t expect it to move much lower than that target area.
- The inner Fibonacci arc and the 50% retracement line both coincide with the $3 level. Investors should feel comfortable placing some buy orders there.
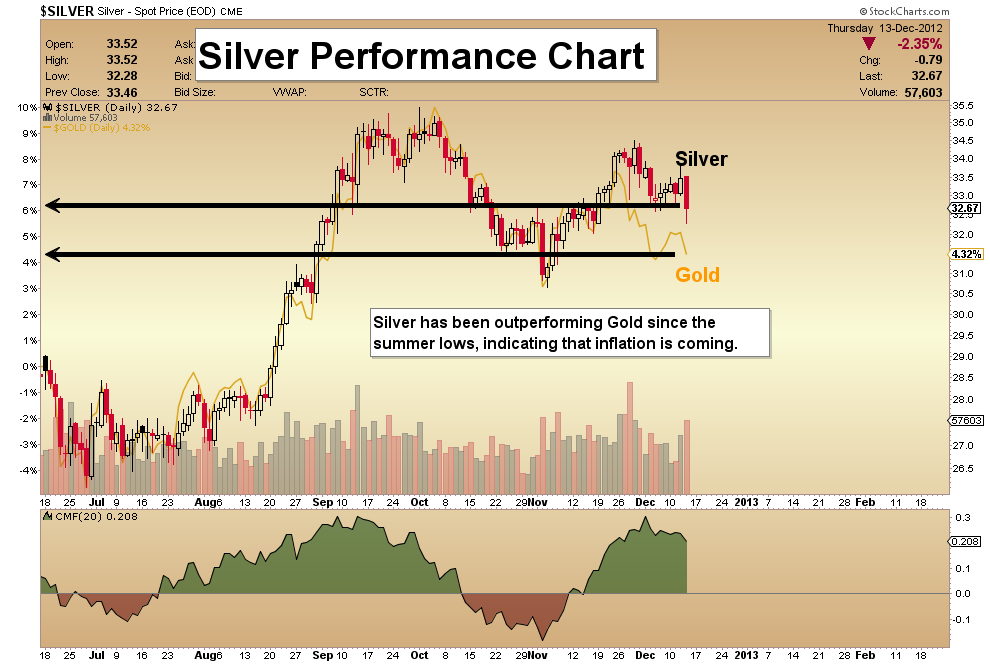
Silver Performance Chart - Rather than staging a dramatic “blow off top”, silver is now outperforming gold in a measured fashion. From a fundamental standpoint, silver’s price action may foretell coming inflation. With all the money printing and deficits, this should not be a surprise.
- Silver is the best performing precious metal now, which is encouraging for gold stock investors. When silver leads, the other sectors typically follow!
Friday, Jun 26, 2026 Super Force Signals Unique Introduction For 321Gold Readers:
Send me an email to admin@supergoldsignals.com and I’ll send you my free “Inflation Thunder Now!” gold and silver stocks video report. I’ll also include 3 of my next Super Force Surge Signals free of charge, as I send them to paid subscribers. Thank you!
|
Stay alert for our Super Gold alerts, sent by email to subscribers,
for both the daily charts on Super Force Signals at www.supergoldsignals.com and for the 60 minute
charts at www.supergoldsignals.com
About Super
Gold Signals:
Our Surge Gold Signals are created thru our proprietary blend
of the highest quality technical analysis and many years of successful
business building. We are two business owners with excellent synergy.
We understand risk and reward. Our subscribers are generally successfully
business owners, people like yourself with speculative funds,
looking for serious management of your risk and reward in the
market.
Frank Johnson:
Executive Editor, Macro Risk Manager.
Morris Hubbartt: Chief Market Analyst, Trading Risk Specialist.
website: www.supergoldsignals.com
email:
admin@supergoldsignals.com
email: admin@supergold60.com
Mail:
1276 Lakeview Drive
Oakville, Ontario, L6H 2M8
Canada
### Dec 14, 2012
Morris Hubbartt
321gold Ltd
 |
