Super Force Signals - A Leading
Market Timing Service
We Take Every Trade Ourselves
Gold Technicals & ETF Inefficiencies
Morris Hubbartt
Weekly Market Update Excerpt
posted Dec 10, 2010
Gold and Precious Metals
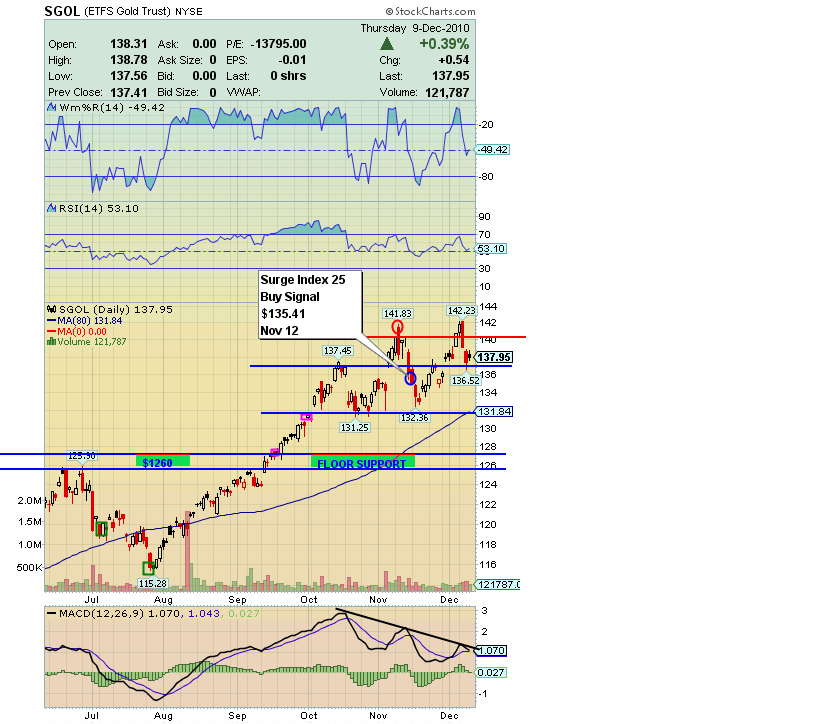
SGOL 6 Month Price Chart
Super Force Gold Bullion Analysis
Gold has a solid Super Force Buy Signal as of Friday Nov. 12th.
-
Gold is the only one of the precious metals sector that did not get a sell signal from me, issued on my daily chart surge system on the major risk market assets, after the recent blast to up to almost $1430.
-
Honest Ben needs to look at the consumer sectors of the economy. Take a look at the rising moves in cotton, wheat, corn, soybeans - just to name a few. This action must translate into higher consumer costs across the board. Do you think rising food prices have a correlation with record numbers of food stamps being handed out? The “Bernank” doesn’t want you to think about that possibility. See the recent youtube cartoon on 321Gold about “The Bernank” if you haven’t viewed it for a horror lesson on what QE really is all about.
-
Ben’s claim that QE is not money printing is laughable. This is a man who is known, even amongst the establishment, as “Helicopter Ben”. QE2 is what I call low key money printing. He is buying Bonds in the open market with printed money. What would you call that, “non-printed” money purchases? I see another writer has referred to Dr. Bernanke as “Dr. Pinocchio”. I think the moniker is accurate.
-
When a government can’t pay back debt, printing or default are the only strategies employed as so-called solutions to inherent structural problems with government itself. Companies go bankrupt, governments print.
-
Note the activity in the Bond market this week. It doesn’t appear the Fed's actions are helping all that much, whether by design or just as a failed strategy. Either way, Bonds have taken it on the chin.
-
As you all know, I take every trade that I give you, every buy and sell alert, myself. I don’t think any other writer can claim that kind of “putting my money where my mouth is” confidence. So, I have raised my core positions in all sectors in precious metals.
-
Volatility could bring prices lower in Gold and, in particular, Silver. When this chapter of World History is written, people may not be so keen to sell their metals for Government paper money. There is growing distrust of the currency markets in many nations. What if the growing distrust turns into a panic? Compare any currency to Gold over five years. Gold has already won!
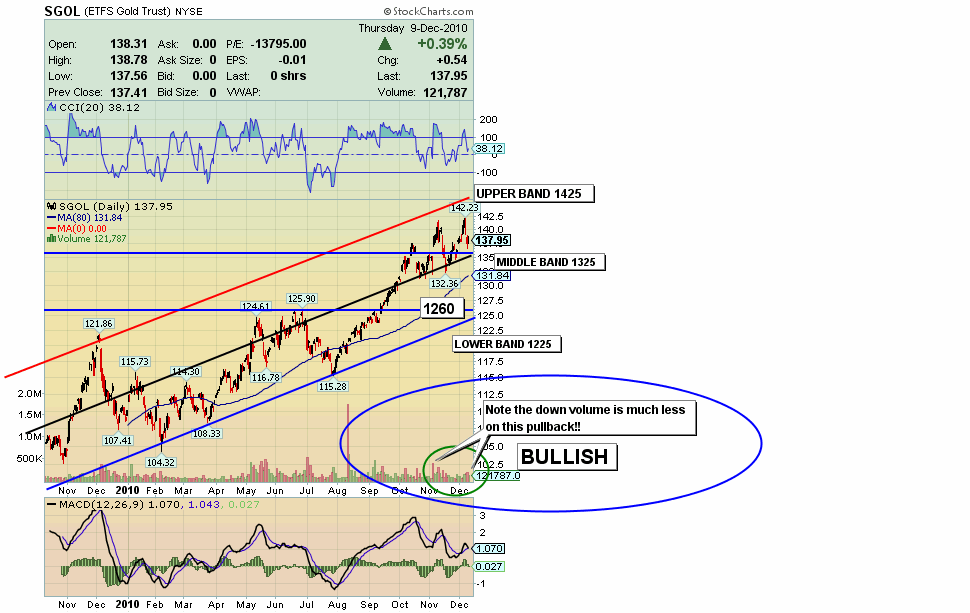
SGOL One Year Price Chart
-
Note the circled area on the above chart. This is good action. I wanted to see less volume in this pullback and we are! The last time price was pulling back in this area, there was much heavier volume. This is very good news for you, for the gold community!
-
At superforcesignals I’m in charge of all buy and sell targeting. It’s a job too important to delegate. I set buy targets and accumulate all the way down to those targets. That’s why, while most were experiencing some big draw downs this week, my Super Force portfolio was again hitting new highs!
-
I am a price predictor, but my goal is to make myself money first and pass on exactly what I’m doing, to empower you to make the same money.
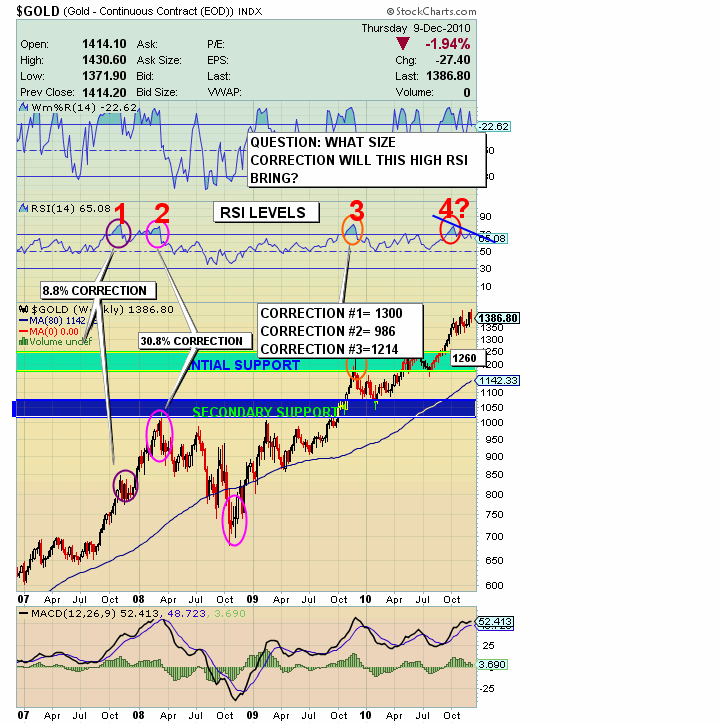
Gold Bullion Weekly Chart
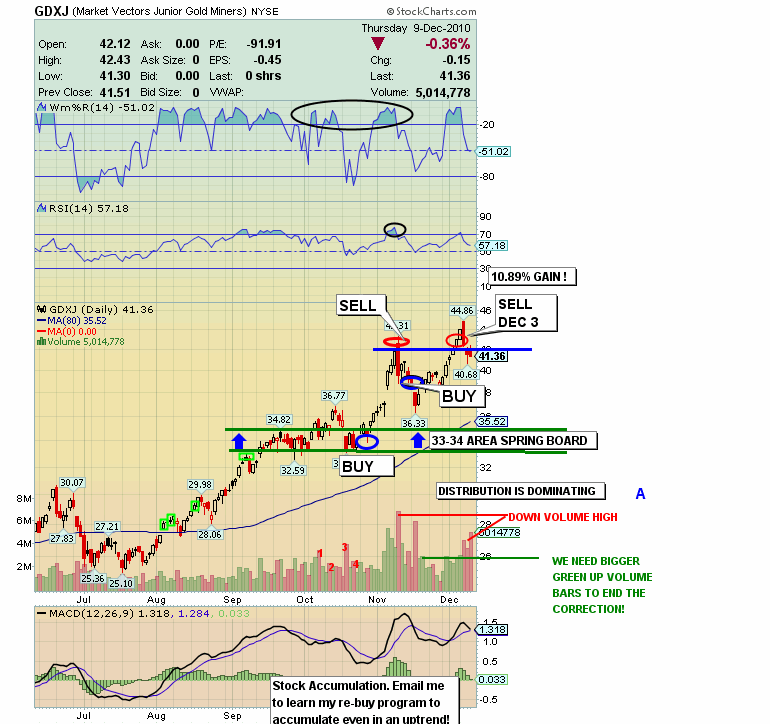
Gold Juniors – GDXJ Chart
Super Force Gold Juniors Analysis.
- I issued a Sell Friday Dec. 3rd. This is a Surge Index 25 sell signal. If further weakness comes into this market, it will intensify the signals.
- In the Gold sector, the juniors continue to be leaders. That’s a great bullish development in the overall precious metal Bull Market. This is very important. The Juniors leadership phenomenon is evidence that there is a shortage of Gold. Future Gold will come from the Gold Mines and in particular from the Gold Juniors, where future exploration comes from.
“I invest in real assets, therefore I don’t book losses!”
Positions in the SF60 program can also be part of your Core Positions Portfolio.
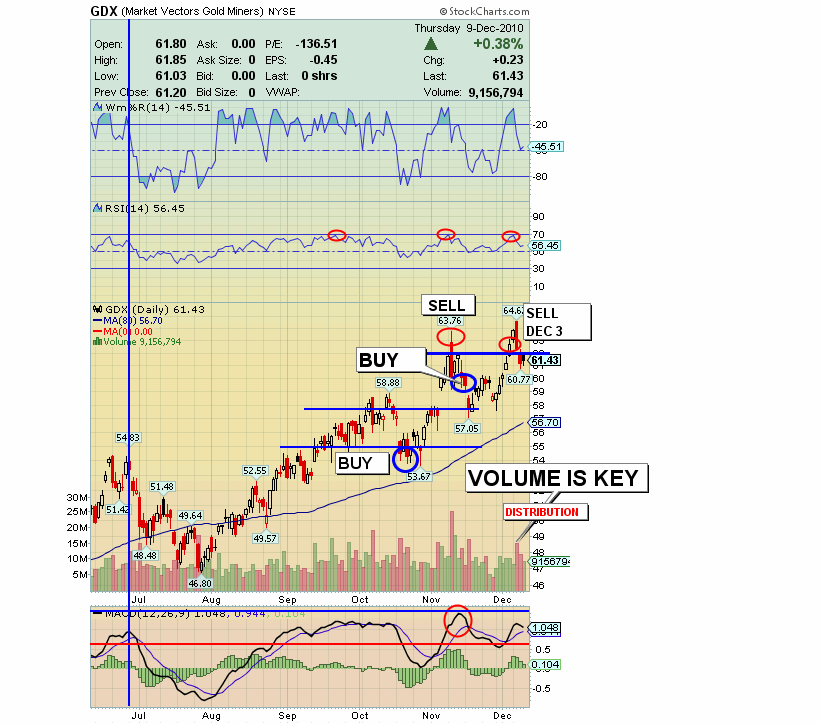
GDX 9 Month Chart
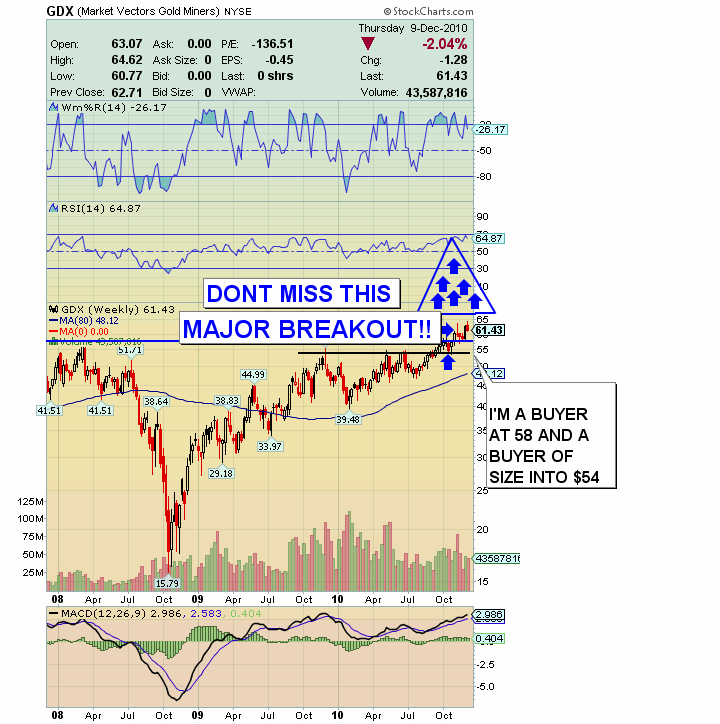
GDX Massive Breakout On 3 Year Chart
Super Force Gold Stocks Analysis
-
The story that has to be repeated here is the 2008 market crash that smashed Gold Stocks. This is a critical factor to making money now in gold stocks. The Market Action in 2008 and the continued rise in Gold, have created a situation where stocks are at least 40% behind and possibly up to 100% behind Gold’s price. These stocks should have been leading Gold, and in a normal Bull market, that would be happening!
-
Bottom line: There are signs the correction has resumed. At the same time, note all the positives I highlight for you today. Couple that with the special undervalued situation surrounding the Gold Seniors, especially now that they have pulled back. Gold Stocks headed much, much higher.
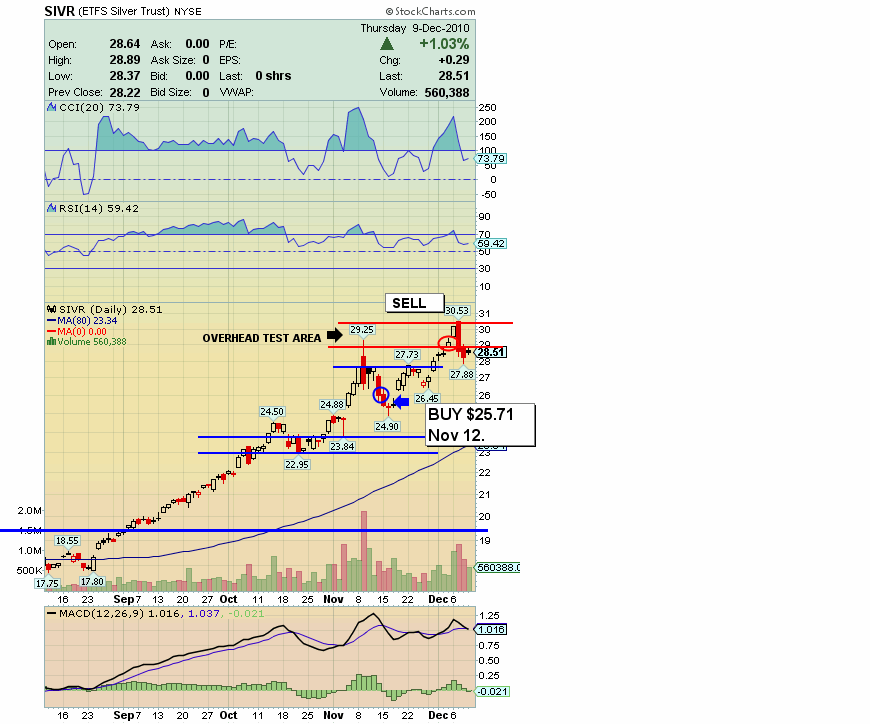
Silver Chart
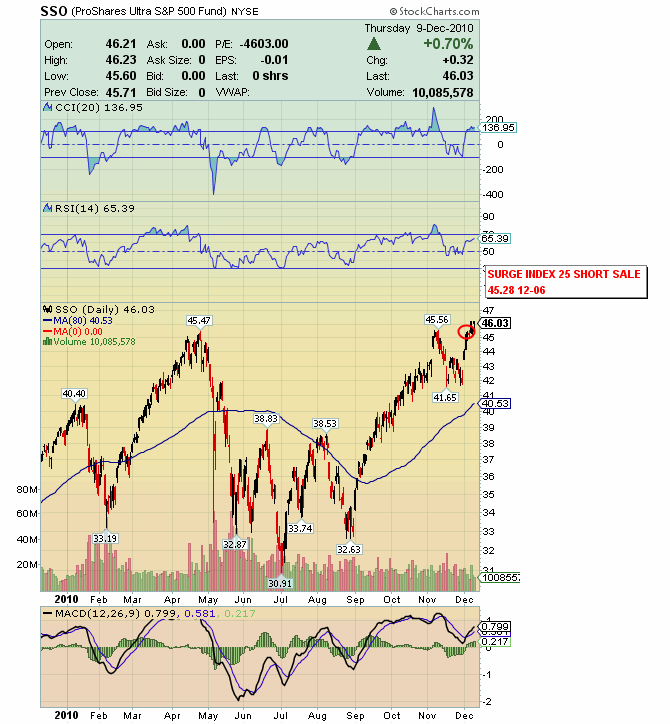
Short the leveraged S&P etf SSO
-
Have you ever traded a leveraged ETF and lost money? There’s more than just timing as a monkey wrench. The losses are also because of volatility and the time holding a structurally imperfect investment. Rather than fighting harder to get the timing perfect, or just complaining about the “bad ETFs”, use their inherent structural failures to make yourself consistent profits from that very structural failure!
-
As always, I place every trade myself too, and you don’t book losses. Only gains! Even if the American stock market doesn’t top out here, you could still make money with the structural inefficiency strategy!
Friday, Jul 24, 2026 Super Force Signals Unique Introduction For 321Gold Readers:
Send me an email to admin@supergoldsignals.com and I’ll send you my free “Inflation Thunder Now!” gold and silver stocks video report. I’ll also include 3 of my next Super Force Surge Signals free of charge, as I send them to paid subscribers. Thank you!
|
Stay alert for our Super Gold alerts, sent by email to subscribers,
for both the daily charts on Super Force Signals at www.supergoldsignals.com and for the 60 minute
charts at www.supergoldsignals.com
About Super
Gold Signals:
Our Surge Gold Signals are created thru our proprietary blend
of the highest quality technical analysis and many years of successful
business building. We are two business owners with excellent synergy.
We understand risk and reward. Our subscribers are generally successfully
business owners, people like yourself with speculative funds,
looking for serious management of your risk and reward in the
market.
Frank Johnson:
Executive Editor, Macro Risk Manager.
Morris Hubbartt: Chief Market Analyst, Trading Risk Specialist.
website: www.supergoldsignals.com
email:
admin@supergoldsignals.com
email: admin@supergold60.com
Mail:
1276 Lakeview Drive
Oakville, Ontario, L6H 2M8
Canada
###
Dec 10, 2010
Morris Hubbartt
321gold
Ltd
 |
