Super Force Signals - A Leading
Market Timing Service
We Take Every Trade Ourselves
Ominous Double Top In US Dollar
Morris Hubbartt
Weekly Market Update Excerpt
posted Dec 9, 2011
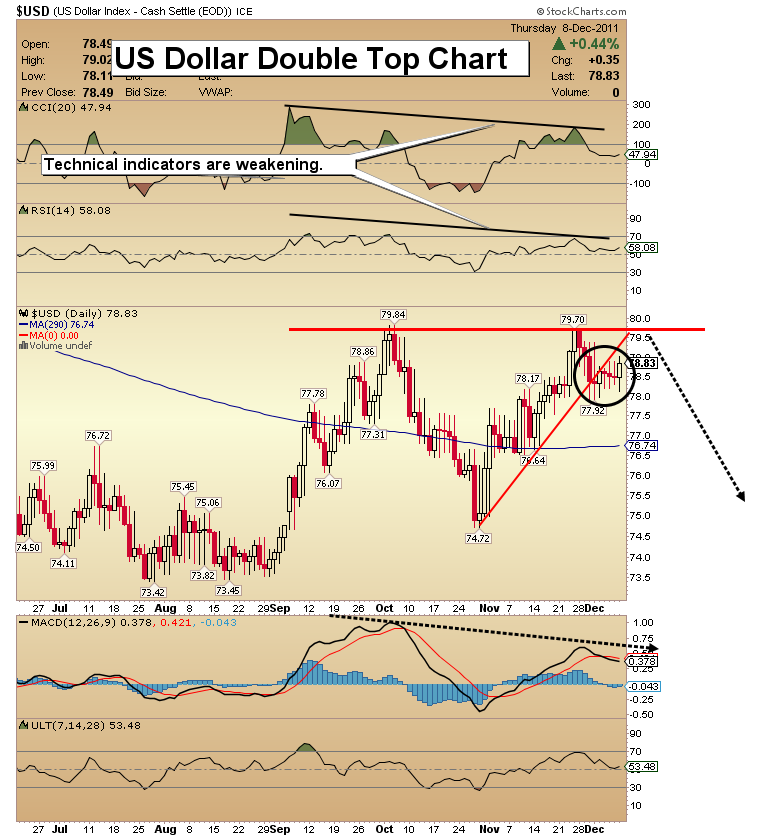
US Dollar Double Top Chart
Analysis
- The US Dollar looks to have put in the classic two month double top. The above chart this week continues to show divergences in the dollar. When a market is expected to move higher, and instead falls at a two month potential double top, this is an ominous technical sign.
- Fundamentally, debt and deficits are a clear and present danger to America. It’s easy to overlook this fact, with the media focusing on Europe. US debt is exploding, up over 50% just since President Obama took office. The deficit is running well over $1.3 trillion. Interest payments get continuously added to this enormous debt, which is already un-payable.
- The immediate risk is renewed deflationary depression in Europe, and in turn, in America. The end result will likely be money printing. The very risk of such a deflationary event should provoke central banks to provide enormous liquidly to the banking system, as a pre-emptive strike, and that could send the dollar sharply lower.
- On the recent run to 79.70, note the failure of numerous technical oscillators and indicators, confirming the failure of the dollar to exceed the high of 79.84. Shouldn’t the dollar have soared much higher, when the European crisis reached the crescendo that it did? The price advance by the dollar is anemic, and the rally is now failing in a classic double top situation.
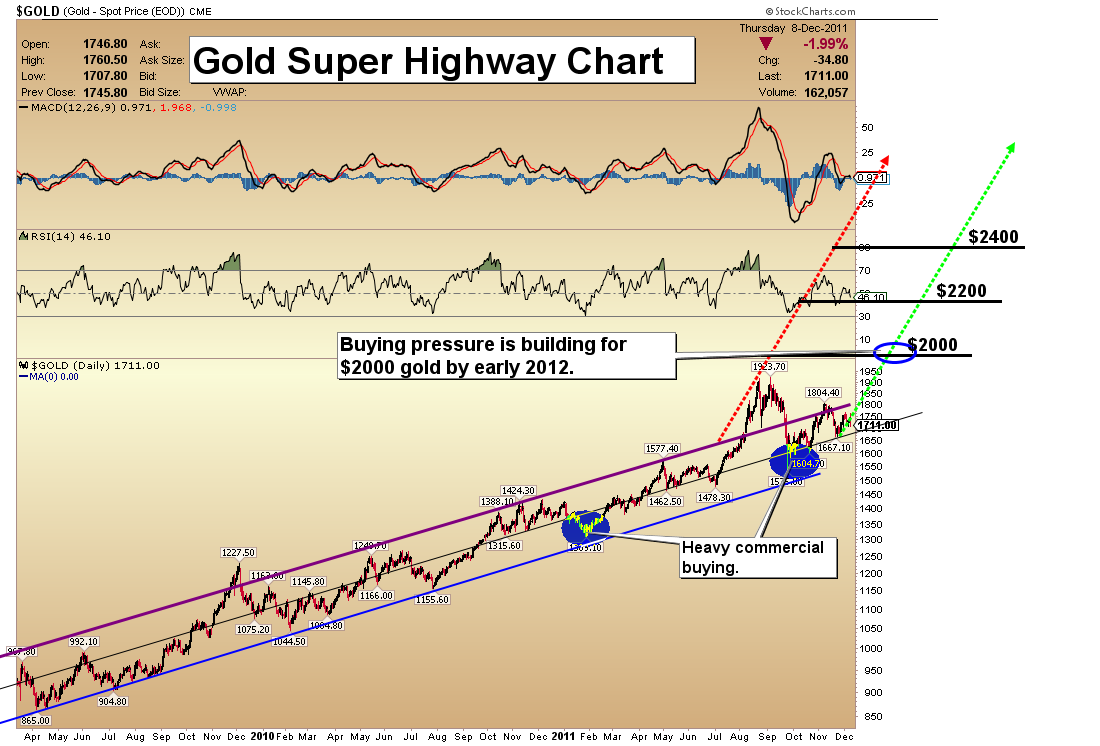
Gold Super Highway Chart
Analysis
- Gold is likely nearing the end of a quiet period of trading, and progress continues to be made. I am looking for gold to trade at $2000 by January 2012. There is strong evidence that this price target could be acquired on schedule. If my analysis of the dollar’s double top condition is accurate, gold could be set to burst higher very quickly.
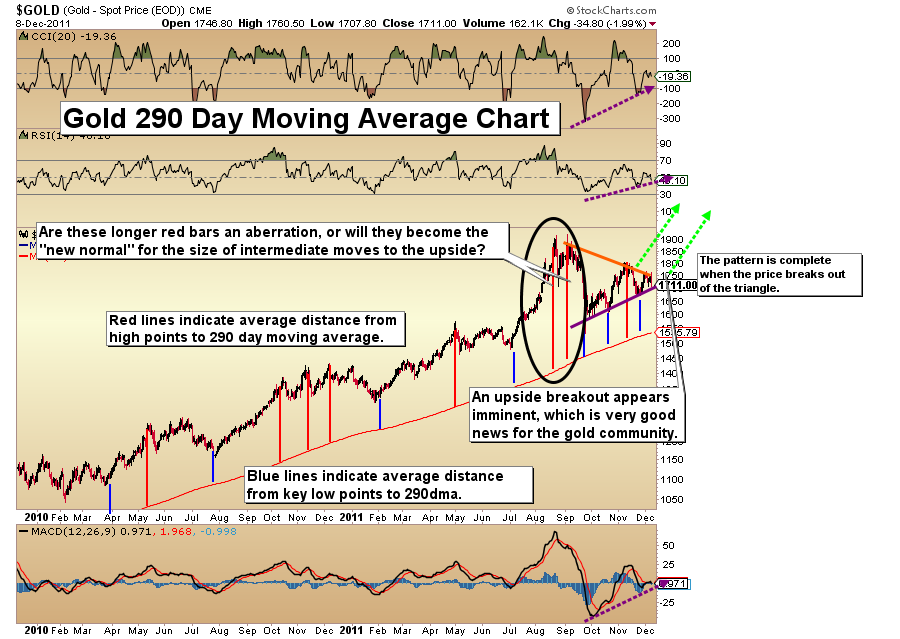
Gold 290 Day Moving Average Chart
- The 290dma chart is a key tool in my technical analysis toolbox. I rely heavily on standard deviation moves from the 290 day moving average to make market calls on gold. Note the dependability of the blue deviation buy markers, as well as the red deviation sell signals. A big aberration occurred as gold was rocketing higher in August/September, and my sell deviation markers missed the top.
- That was the deviation I have been looking for, as an indication that a Superhighway trajectory for gold could be in the making. I am reasonably confident that my “aberration” is going to become the new normal for the size of intermediate gold advances in the gold price against the dollar.
- The other key technical highlight on this chart is the symmetrical triangle. Odds favour a breakout to the upside. All indicators look good for a move to new highs. Physical gold should be your largest asset.
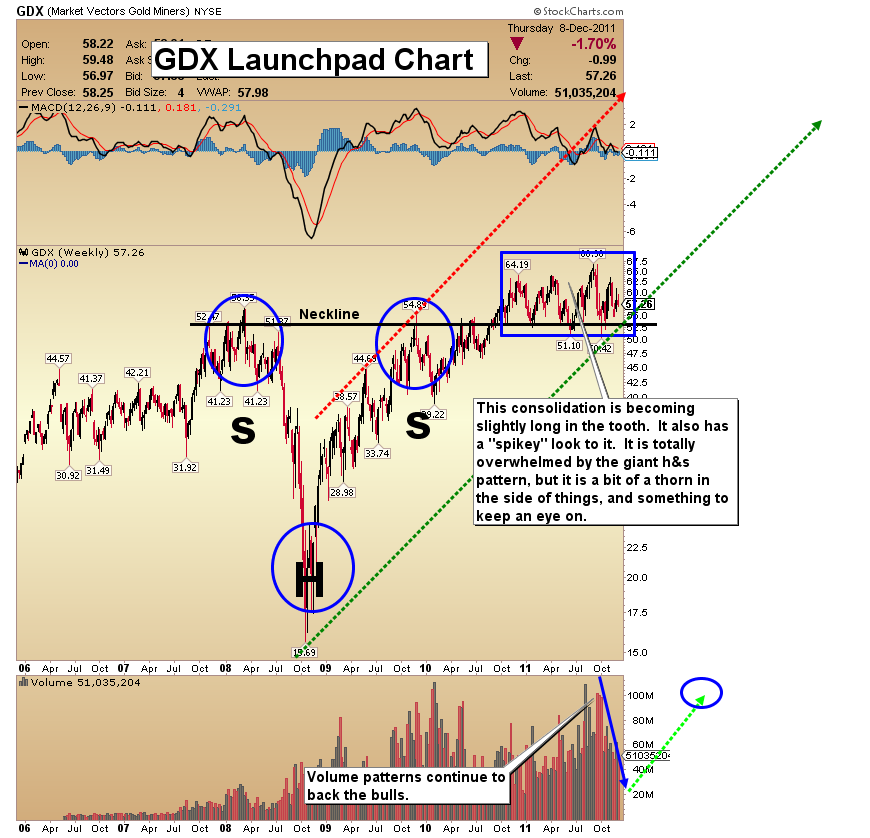
GDX Breakout Chart
- Gold senior stocks are my third largest holding, after physical gold and physical silver. The powerful head and shoulder formation is projecting $95 for GDX. Beyond that, my longer term analysis projects a share price of over $130, within 18-24 months.
- I am only slightly concerned about the length and technical nature of the consolidation that has occurred on the “launch pad”, which is the neckline of the head and shoulders pattern. The current sideways chop in GDX has gone on for longer than anyone in the gold community projected, including myself.
- Charts don’t make fundamental events happen. It is fundamental events that make charts. The crisis in Europe is likely responsible for a lot of this sideways and erratic trading in GDX shares. If you think about the size of the Euro crisis, the current technical action fits well with that fundamental event.
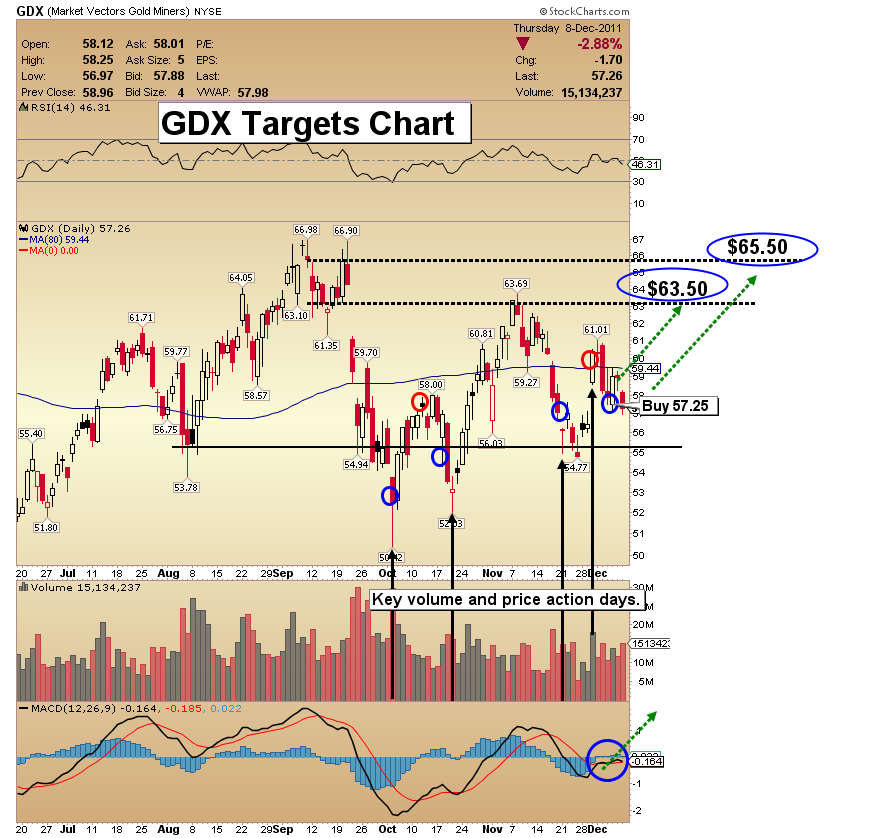
GDX Targets Chart
- Volatility has ravaged in the gold stocks sector for months now, and that has been a challenge for traders. In the shorter term, I issued a sell for GDX last week at $59.75, and on Tuesday I issued a new buy signal in the $57.25 price area. In this crisis, it’s critical to take some small profits frequently while holding a big core position.
GDXJ Double Bottom Chart
- An interesting potential double bottom pattern is forming in the gold juniors sector. Volume is approximately 50% less than occurred on the first leg down. Note the volume boxes on the chart.
- The falling volume indicates traders are worn out on the trade, which goes hand in hand with what I have written about for weeks concerning sentiment indicators. The morale of gold stock owners is very low, and that is a buy signal.
- A double bottoming process in gold juniors is occurring while a double top formation is occurring in the dollar, which is good news for the gold community.
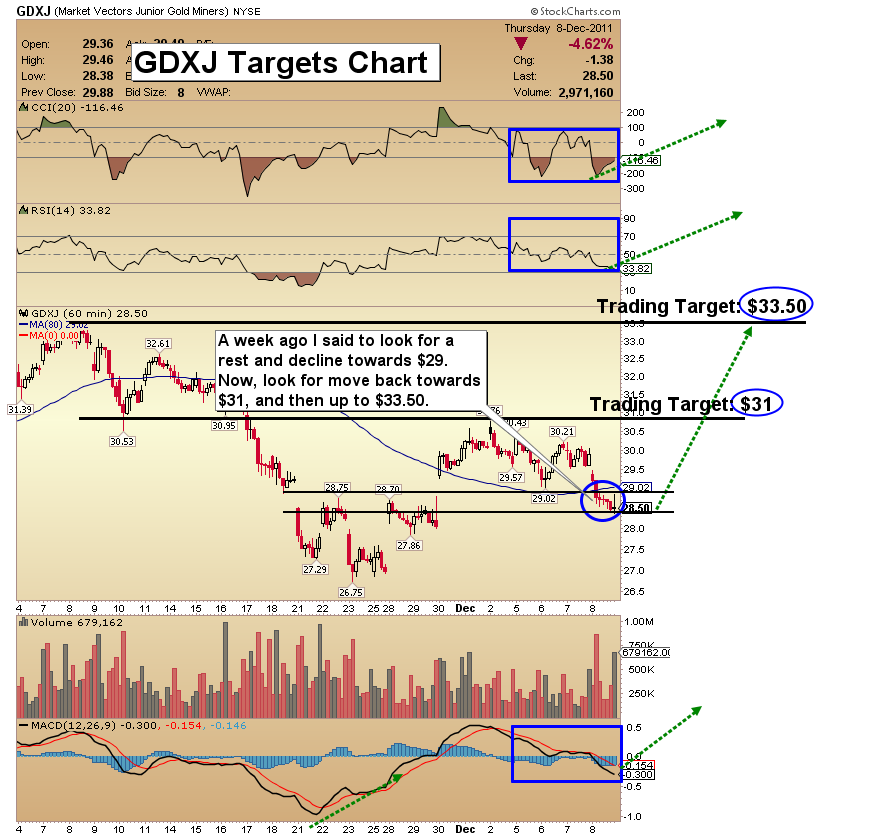
GDXJ Targets Chart
- A week ago I said to look for a pullback to $29.00. That target was acquired yesterday. What I see now is a move up through the $31 area, to a price just short of the $33.50 target, within a timeframe of about 5 trading days.
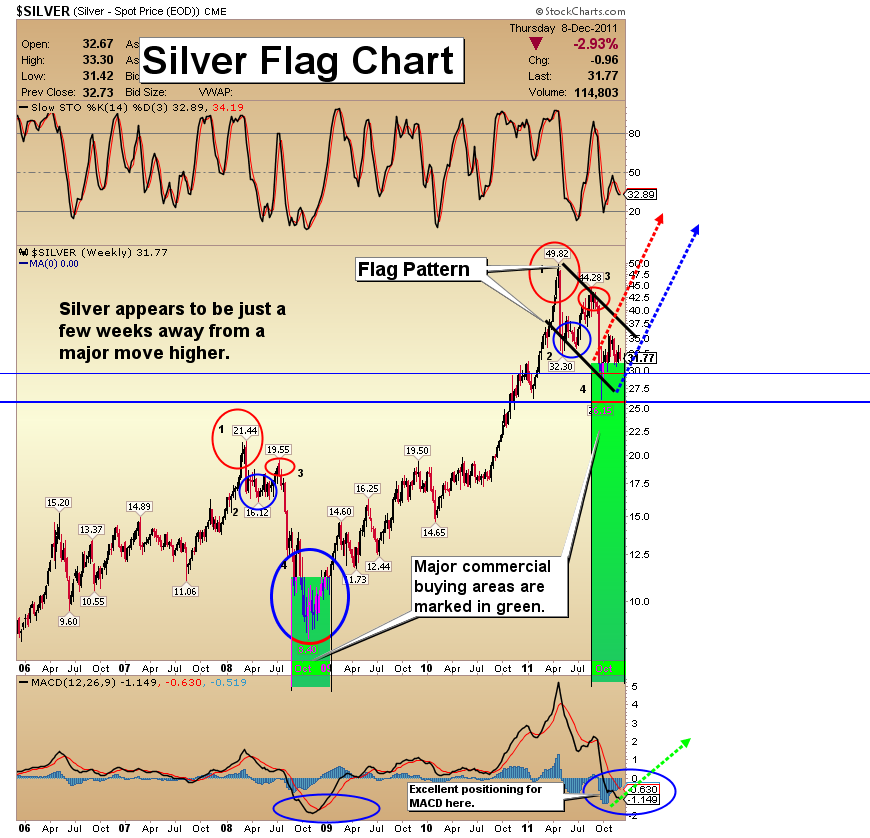
Silver Flag Chart
- Silver offers solid value. I see silver becoming a stand-out asset over the next two years. You can own it in physical form. It is a great asset to buy and simply wait for a higher price. If you store it yourself you avoid fees. One way to measure silver’s value is the gold/silver ratio; it currently takes about 53 ounces of silver to buy 1 ounce of gold. The ratio could get worse for silver enthusiasts, but the current ratio is at a level where silver represents very good long term value.
- Technically, silver looks to be trading in the later stages of an enormous flag pattern. The COT report numbers are very bullish, but silver investors are frustrated with waiting for “the big move”. MACD looks extremely good, with the histogram bars rising nicely. 2012 looks to be “your year”, if you are invested in silver!
Friday, Jul 3, 2026 Super Force Signals Unique Introduction For 321Gold Readers:
Send me an email to admin@supergoldsignals.com and I’ll send you my free “Inflation Thunder Now!” gold and silver stocks video report. I’ll also include 3 of my next Super Force Surge Signals free of charge, as I send them to paid subscribers. Thank you!
|
Stay alert for our Super Gold alerts, sent by email to subscribers,
for both the daily charts on Super Force Signals at www.supergoldsignals.com and for the 60 minute
charts at www.supergoldsignals.com
About Super
Gold Signals:
Our Surge Gold Signals are created thru our proprietary blend
of the highest quality technical analysis and many years of successful
business building. We are two business owners with excellent synergy.
We understand risk and reward. Our subscribers are generally successfully
business owners, people like yourself with speculative funds,
looking for serious management of your risk and reward in the
market.
Frank Johnson:
Executive Editor, Macro Risk Manager.
Morris Hubbartt: Chief Market Analyst, Trading Risk Specialist.
website: www.supergoldsignals.com
email:
admin@supergoldsignals.com
email: admin@supergold60.com
Mail:
1276 Lakeview Drive
Oakville, Ontario, L6H 2M8
Canada
###
Dec 9, 2011
Morris Hubbartt
321gold
Ltd

|
