Super Force Signals - A Leading Market Timing Service
We Take Every Trade Ourselves
Gold Stocks Have An Aroon Harpoon Morris Hubbartt
Weekly Market Update Excerpt
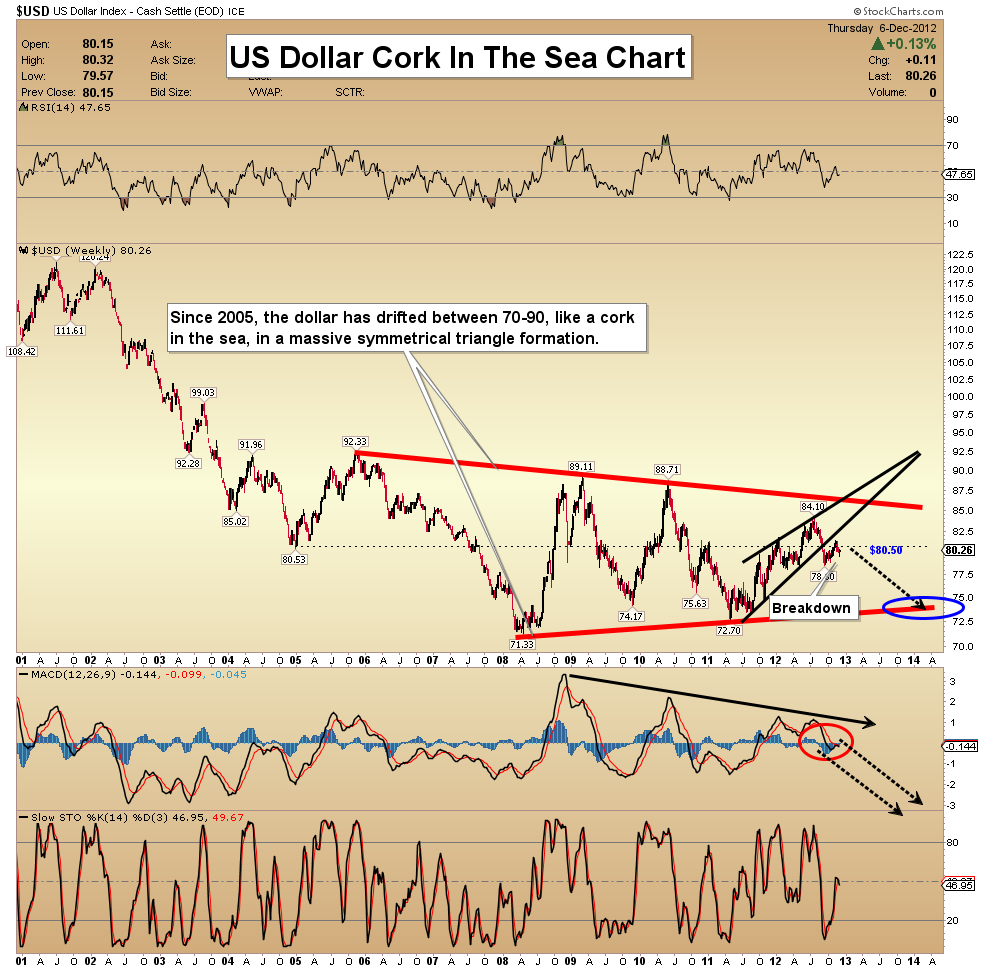
posted Dec 7, 2012 US Dollar Cork In The Sea Chart - The dollar's failure is probably being masked by a gold market that feels a bit like it is “under attack”. The line in the sand that I have set for the dollar is 80.50. It has closed under that key price numerous times, which indicates technical deterioration.
- This “Cork In The Sea” weekly chart highlights a massive symmetrical triangle formation, with a horrific final price objective of about 50.
- Where would gold trade if the dollar were to suffer such a catastrophic decline? I believe it would trade above $4000 an ounce.
- In the shorter term, a head & shoulders short term top within the black bearish wedge has appeared, rather ominously. It projects a decline in the dollar to the 73 area.
- A decline to that level would test the lower red support line of the giant symmetrical triangle, and would probably coincide to a breakout above $2000 in the gold market.
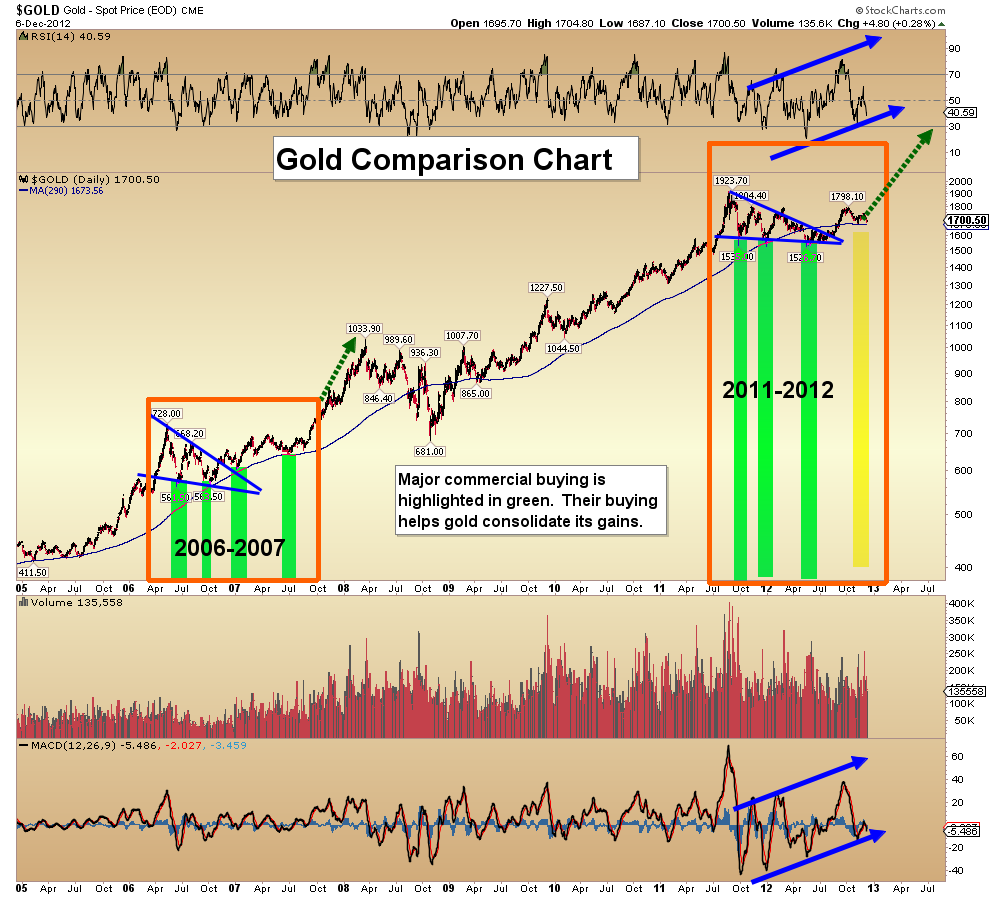
Gold Comparison Chart - When the dollar is weak against other fiat currencies, gold usually does well, but recent fiscal cliff discussions have put a bit of pressure on it.
- Technically, gold is on very solid footing. Key indicators on this chart are projecting higher prices. RSI is confirming price action, and has lots of room to move higher. MACD is channelling higher, and shows strong underlying momentum. My targets are $1850 and $2015. I expect both to be acquired in January of 2013.
- The price patterns and commercial trader support for gold are similar to 2006-2007, when price underwent a consolidation, after a big move higher. Also, quantitative easing didn’t exist then. QE3 is a recent event, and its biggest effects on the gold price are probably coming in 2013.
- In 2006-2007, there were 3 consecutive rounds of aggressive commercial trader buying, followed by a 4th round a bit later. Note the yellow bar that I’ve highlighted during the current time frame. I believe the coming COT report will show aggressive buying again, and change that bar from yellow to green!
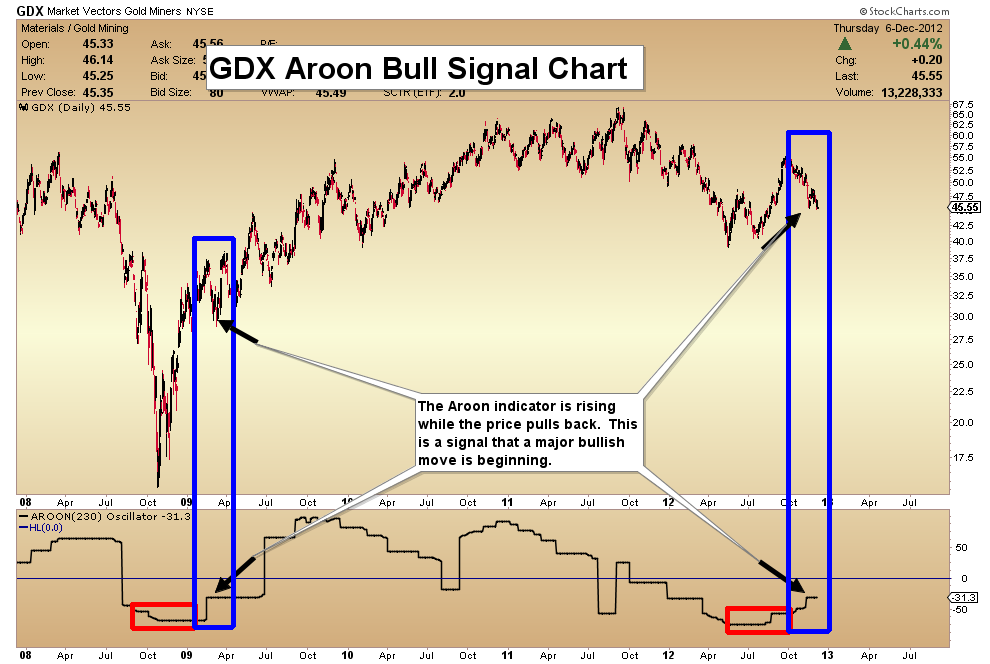
GDX Aroon Bull Signal Chart - I use the Aroon as a confirming tool, and as an early indicator of market direction change. As in 2009, the market just pulled back, after surging up from a major bottom. The Aroon indicator is marching higher during this pullback, which is very positive.
- The next key bullish event by the Aroon oscillator would be a jump above the zero line. That should ignite the “barnburner” rally that you’ve all been waiting for.
- Quite frankly, the US dollar is acting like a bloated whale, and the “Aroon Harpoon” is being launched from a GDX whaling ship. I hope you are all onboard!
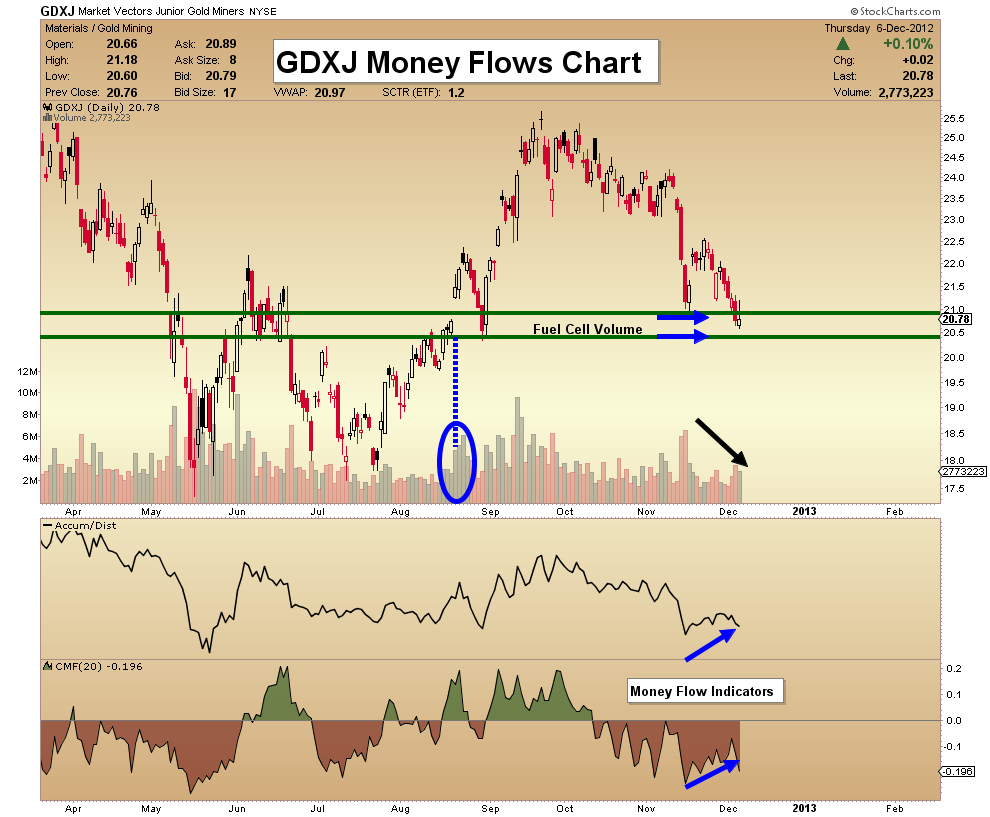
GDXJ Money Flows Chart - The history of GDXJ does not include 2008-2009, so no direct comparison can be made with that time period. That said, there is strong technical evidence that the lows are in for GDXJ, and the next major move will be to the upside.
- Specifically, last July, as the market was making a textbook double bottom chart formation, one of the tools that I used to predict the rally, was a series of key money flow indicators.
- On the bounce from the 2nd low of that double bottom pattern, money flows into the sector turned strongly bullish. The result of such powerful money flows was a gain of 45% for GDXJ.
- My money flow indicators are turning bullish again. This is happening as GDXJ arrives at powerful volume-based support. Note the strong bullish divergence between my money flow indicators and the price of GDXJ. I expect the situation to be resolved with a powerful rally.
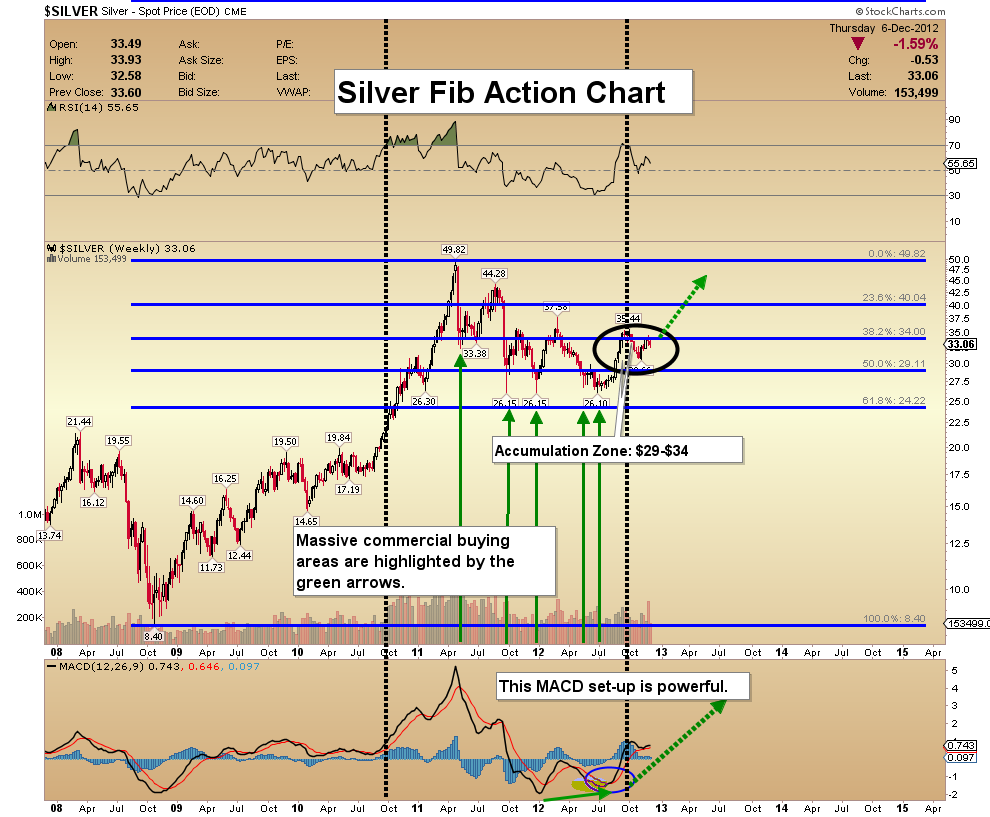
Silver Fib Action Chart - Silver is the most resilient sector of the precious metals complex. When silver moves, gold and gold stocks also tend to perform well.
- The outcome of fiscal cliff talk is likely more money printing, because politicians are not willing to talk about real solutions, and that is good news for silver.
- The action of the MACD indicator is extremely bullish.
- The $34 area is an important 38% Fibonacci retracement level. A breakout above that price should quickly send silver to $44.
Friday, Jul 3, 2026 Super Force Signals Unique Introduction For 321Gold Readers:
Send me an email to admin@supergoldsignals.com and I’ll send you my free “Inflation Thunder Now!” gold and silver stocks video report. I’ll also include 3 of my next Super Force Surge Signals free of charge, as I send them to paid subscribers. Thank you!
|
Stay alert for our Super Gold alerts, sent by email to subscribers,
for both the daily charts on Super Force Signals at www.supergoldsignals.com and for the 60 minute
charts at www.supergoldsignals.com
About Super
Gold Signals:
Our Surge Gold Signals are created thru our proprietary blend
of the highest quality technical analysis and many years of successful
business building. We are two business owners with excellent synergy.
We understand risk and reward. Our subscribers are generally successfully
business owners, people like yourself with speculative funds,
looking for serious management of your risk and reward in the
market.
Frank Johnson:
Executive Editor, Macro Risk Manager.
Morris Hubbartt: Chief Market Analyst, Trading Risk Specialist.
website: www.supergoldsignals.com
email:
admin@supergoldsignals.com
email: admin@supergold60.com
Mail:
1276 Lakeview Drive
Oakville, Ontario, L6H 2M8
Canada
### Dec 7, 2012
Morris Hubbartt
321gold Ltd
 |
