Super Force Signals - A Leading
Market Timing Service
We Take Every Trade Ourselves
Gold rally will last into January
Morris Hubbartt
Weekly Market Update Excerpt
posted Dec 2, 2011
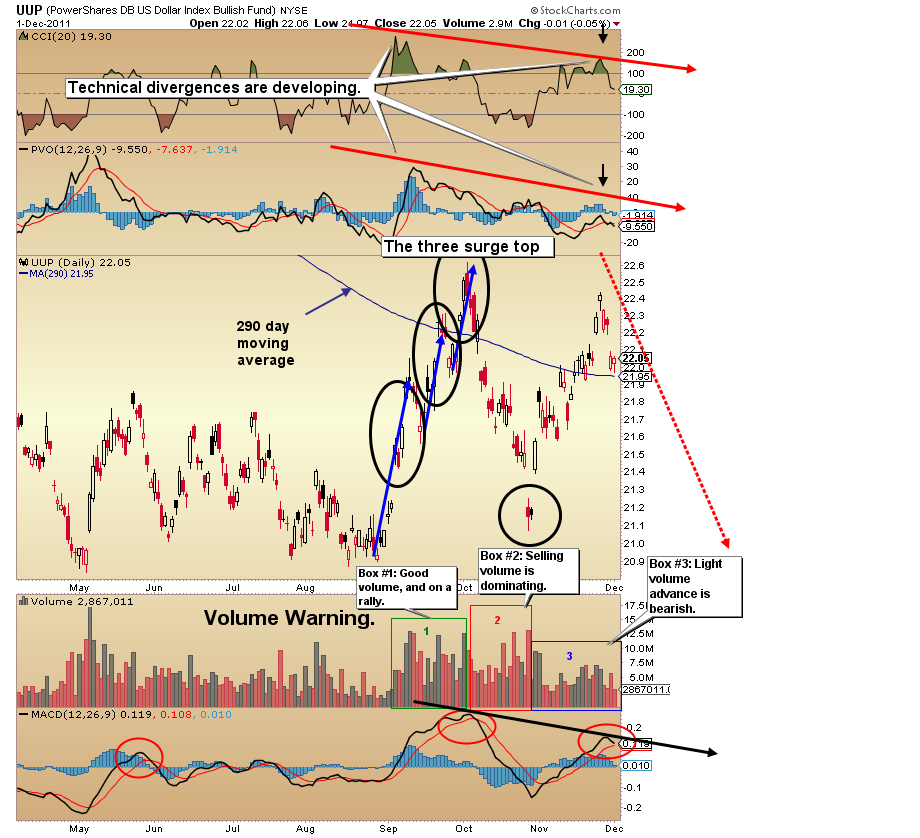
UUP (US Dollar Proxy) Chart
How safe is the Dollar?
- The love affair with the safe haven status of the dollar continues, and in the short term that benefits the dollar. In the longer term, this “safe haven” theory will fail. The dollar should be a short term trading tool for investors, but avoided as a store of wealth.
- The dollar proxy chart I’m using this week is UUP-NYSE, an ETF that gives insight to the volume trading patterns on the dollar. Technical indicator divergences are apparent, and volume is weak. In the short term, anything can happen. In the longer term, these divergences are trend changers.
- One key piece of data I use to illustrate the major trend of a market is the 29O day moving average (290dma). I like to use this longer term average rather than the popular 200dma. What my current analysis tells me is that the dollar is up, but the 290dma trend is decidedly to the downside.
- I do see the possibility of the double top I’ve referenced over the past few months, or even a slight new high coming in the dollar. Focus your market purchases not towards the dollar going up, but towards buying hard assets that could still be negatively affected by a stronger dollar, in the short term.
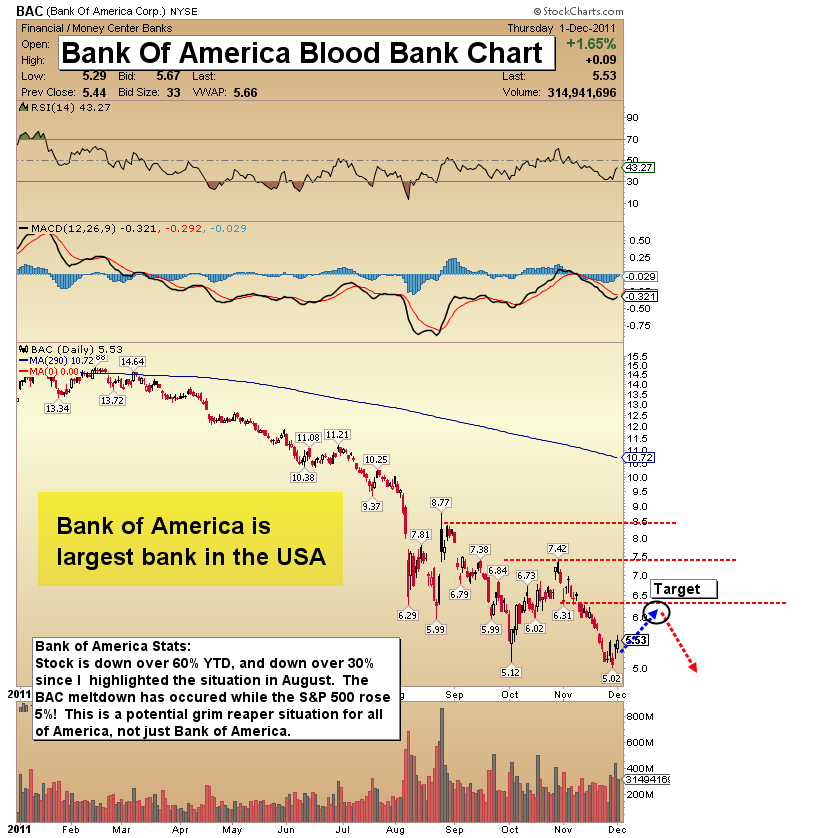
Bank Of America Blood Bank Chart
- My longer term technical work continues to point to lower prices for bank stocks and the dollar. The MACD indicator is hinting at a rally for now. From my warning on Aug 29, this stock has lost nearly one third of its value. That occurred while the S&P rose more than 5%! More losses look to be coming to the bank stocks in the next several months. It’s very difficult for the dollar to mount a sustained trend to the upside, while the banks are in great trouble.
- I do see a decent stock market rally continuing into 2012, so the bank stocks decline might pause for a few weeks. Bank of America’s price is far stretched from the 290MA and due for a bounce. My suggestion is to use any bank stocks bounce to exit from the dollar, and enter into more ownership of gold and gold stocks.
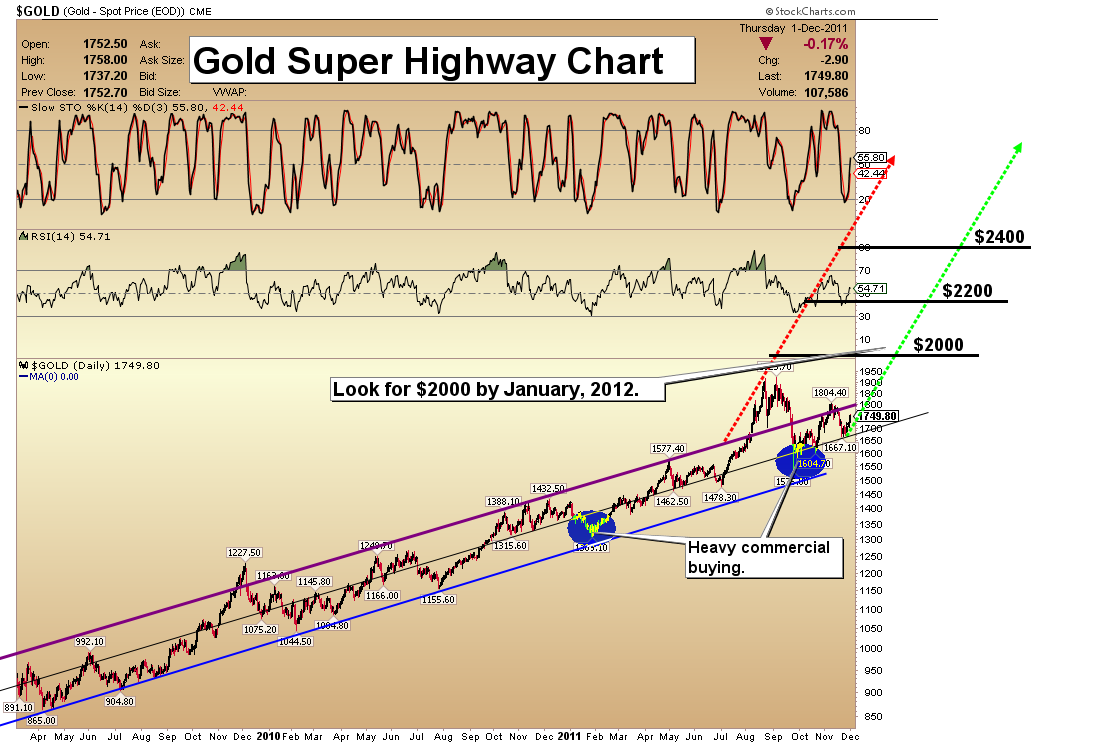
Gold Super Highway Chart
Analysis
- The best investments in the future are not likely to be government paper. Around the world, government debt is out of control, and that means stocks and commodities are the better long term play. Gold should be at the top of your list of investments to own.
- Various indicators I track point towards significant pessimism on gold, although the action by central bankers on Wednesday has provided some relief. The fear for the majority of investors is based in the growing volatility in most markets. I see tremendous risk in government investment products into the future. Personally, I am moving some assets out of government retirement funds, eating the tax, and increasing my physical bullion positions.
- Note the clear movement of the gold price into my super highway channel now. The demand and supply trend lines are becoming better defined.
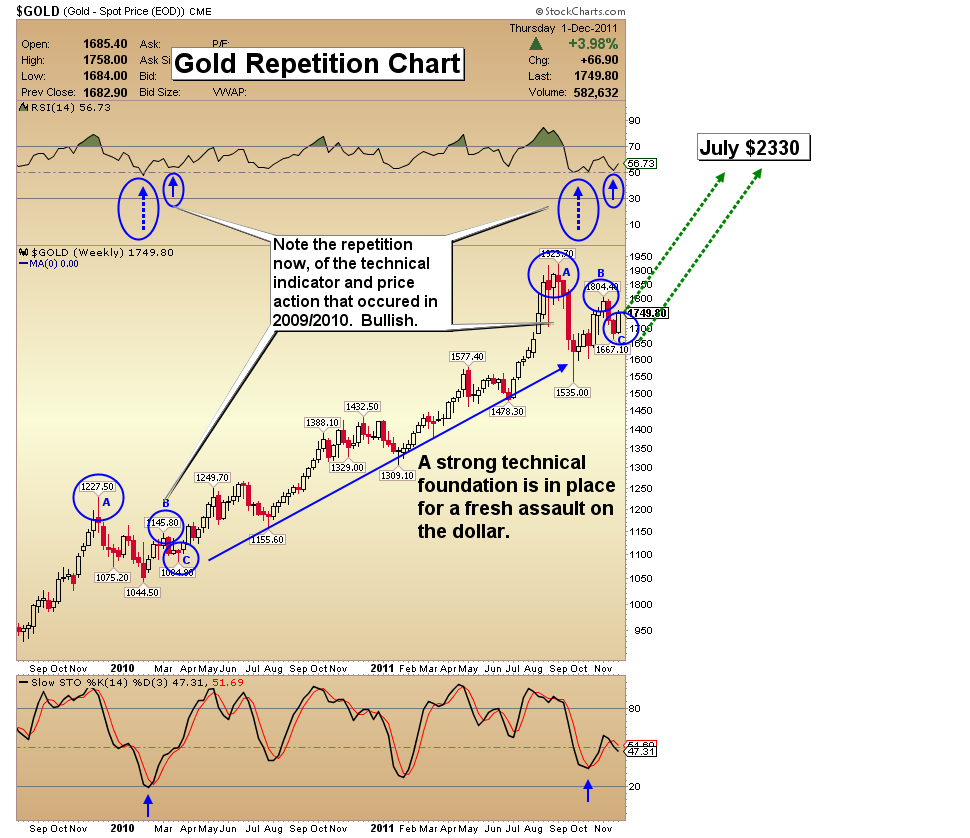
Gold Repetition Chart
- My sentiment indicators haven’t been this favourable for gold since it was trading at $1000 per ounce. As gold is off less than 10% from its all-time highs, this is extremely bullish. Cynicism reins in the gold market, and that is good news, because sentiment analysis works best when market participants are disillusioned. This is the situation now for gold.
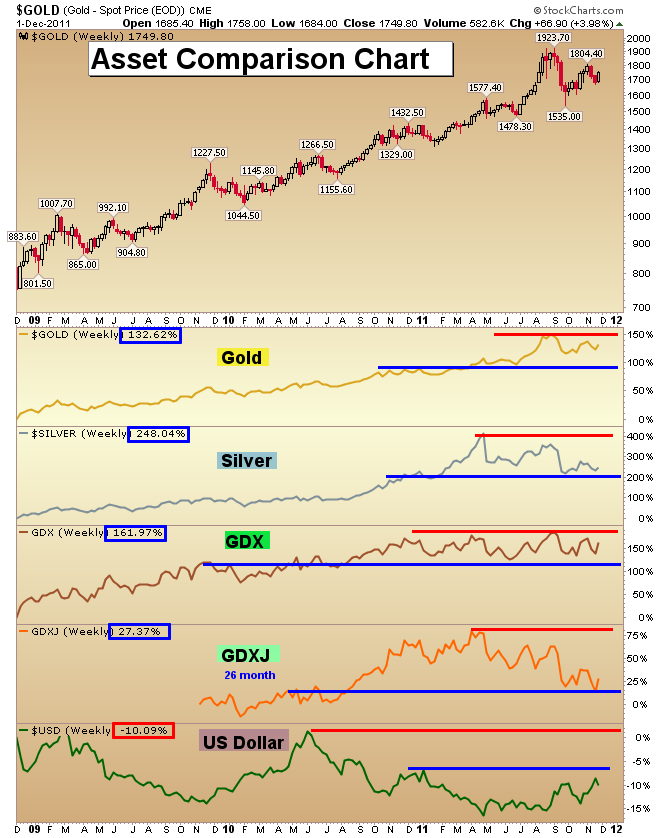
Asset Comparison Chart
- The above chart shows the superior long term performance of the precious metals sector compared to the dollar. Note the bottom window that shows the terrible performance of the US dollar over a 3 year period of time, versus the solid performance of the metals market assets over the same timeframe.
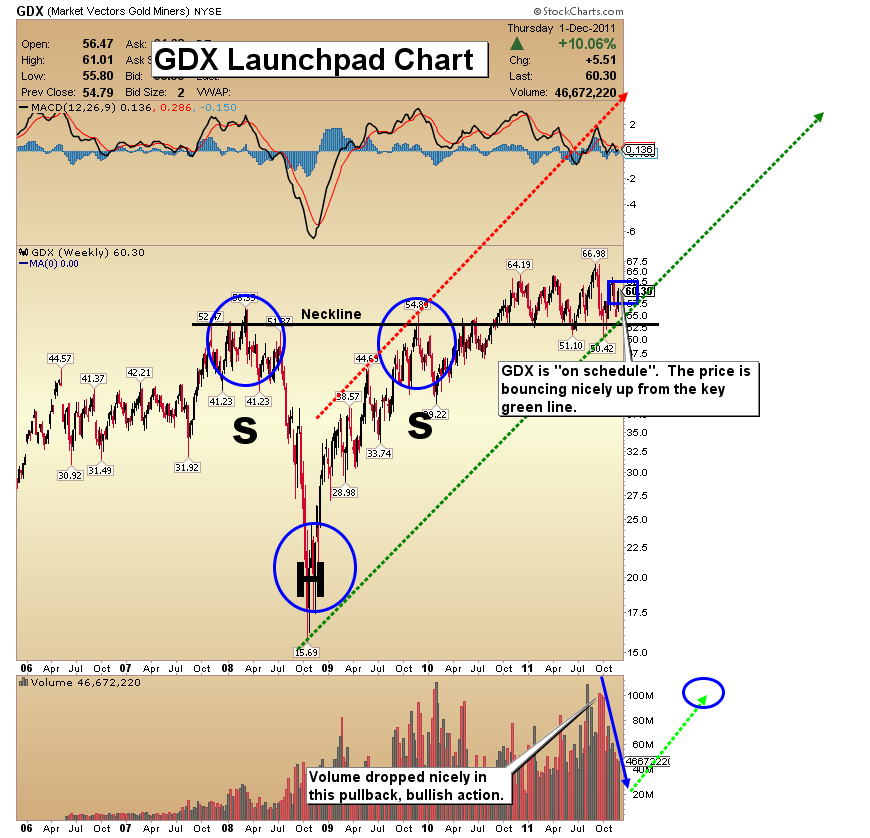
GDX Launchpad Chart
- My analysis continues to conclude that the “fear factor” is enormous in gold stocks. I use a number of tools to determine bull/bear sentiment. These readings indicate there is currently a lot of money on the sidelines, waiting to enter the market.
- One thing that I see helping gold stocks make a strong rally from now into late January is general stock market strength.
- I have been forecasting Gold $2000 by year end/early January, 2012. The exact time is less important than understanding that a huge rally in gold bullion seems at hand now. Couple that probability with a rally in the S&P500 over the next 45-60 days, and you get the possibility of what is best termed a gold stocks rock and roll concert.
- The target of the head and shoulders pattern is close to $100 for GDX.
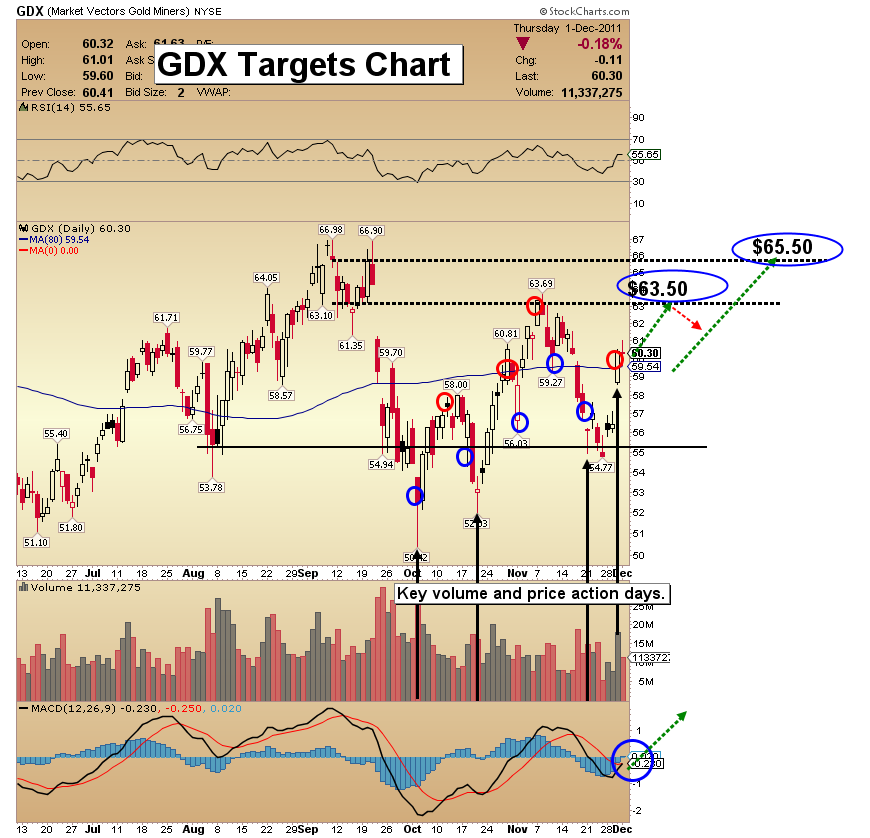
GDX Targets Chart
- In the shorter term, I see $63.50 retaken. That move should be followed by a move up to the $65.50 area. Gold seniors offered a nice volume move on Wednesday, as price exploded to the upside. I took some trading profits off the table yesterday, which is my strategy for capital preservation. Selling a bit doesn’t mean I think gold stocks are headed lower. Some profits just have to be booked as the price goes higher. My volume analysis on the above chart is predicting higher prices.
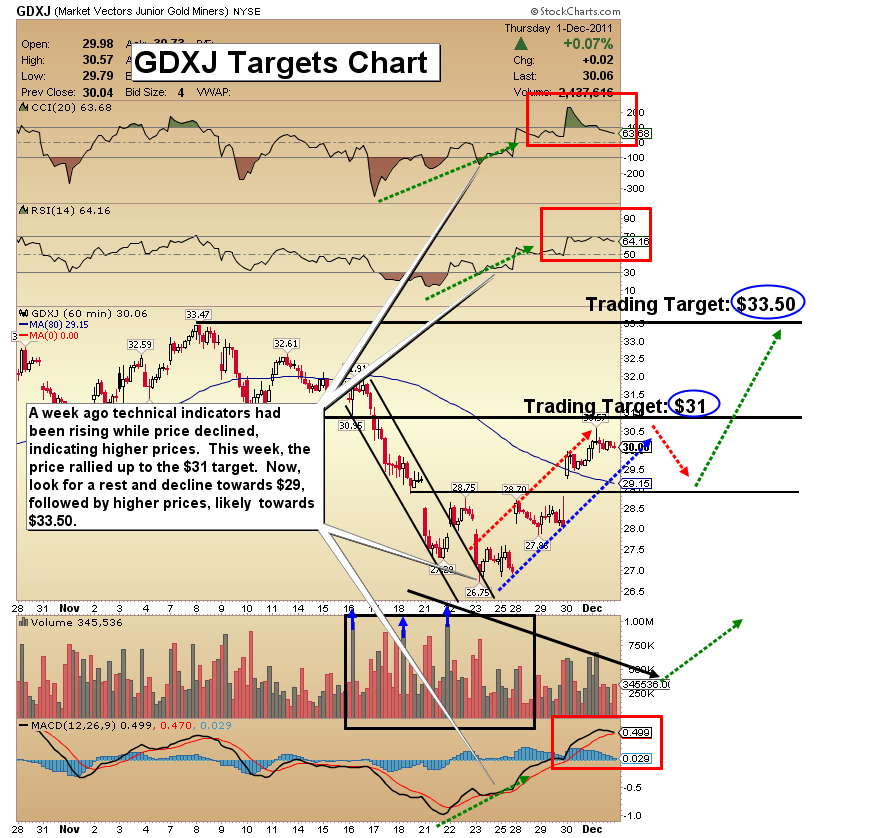
GDXJ Targets Chart
- My trading targets from last week on the above GDXJ SF60 trading charts are close to acquired. From here I look for a pause, followed by a run to the important $33.50 price target.
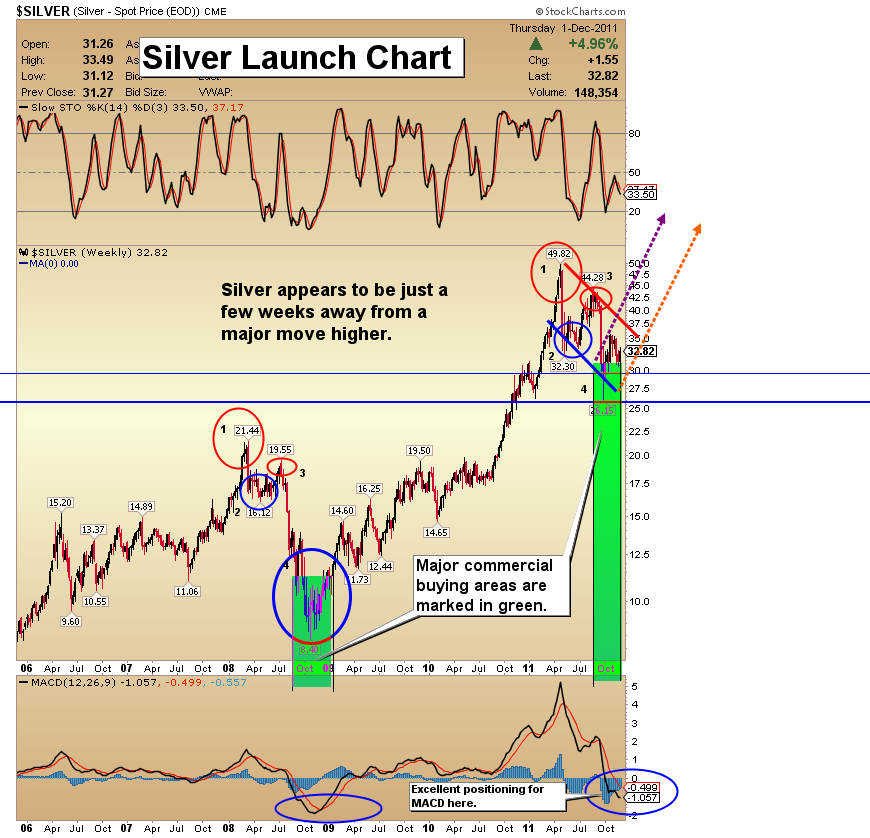
Silver Chart
- Silver looks very close to resuming its outperformance of all precious metals sectors. Note the bullish flag pattern that is now taking place on the chart. Silver, like stocks, commodities, and gold equities, is very close to having a very large MACD buy signal flash on the weekly chart. Note the rising histograms. Bullish!
Friday, Jul 3, 2026 Super Force Signals Unique Introduction For 321Gold Readers:
Send me an email to admin@supergoldsignals.com and I’ll send you my free “Inflation Thunder Now!” gold and silver stocks video report. I’ll also include 3 of my next Super Force Surge Signals free of charge, as I send them to paid subscribers. Thank you!
|
Stay alert for our Super Gold alerts, sent by email to subscribers,
for both the daily charts on Super Force Signals at www.supergoldsignals.com and for the 60 minute
charts at www.supergoldsignals.com
About Super
Gold Signals:
Our Surge Gold Signals are created thru our proprietary blend
of the highest quality technical analysis and many years of successful
business building. We are two business owners with excellent synergy.
We understand risk and reward. Our subscribers are generally successfully
business owners, people like yourself with speculative funds,
looking for serious management of your risk and reward in the
market.
Frank Johnson:
Executive Editor, Macro Risk Manager.
Morris Hubbartt: Chief Market Analyst, Trading Risk Specialist.
website: www.supergoldsignals.com
email:
admin@supergoldsignals.com
email: admin@supergold60.com
Mail:
1276 Lakeview Drive
Oakville, Ontario, L6H 2M8
Canada
###
Dec 2, 2011
Morris Hubbartt
321gold
Ltd

|
