Super Force Signals - A Leading
Market Timing Service
We Take Every Trade Ourselves
Oil Hands Bull Baton To Gold
Morris Hubbartt
Weekly Market Update Excerpt
posted Nov 18, 2011
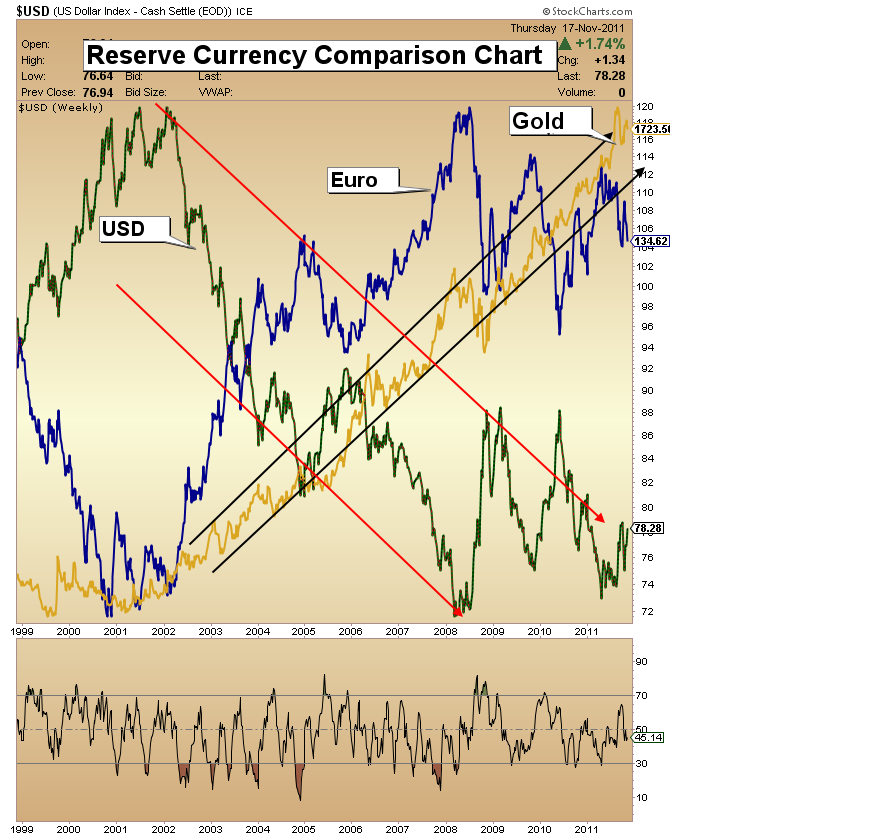
Reserve Currency Comparison Chart
US Dollar Analysis
- When comparing fiat currencies, you probably hear a lot about the dollar being the “best of a bad lot”, but the dollar is more likely in the early stages of losing its coveted world reserve currency status.
- To be a successful investor, you do need high levels of cash to operate, but that doesn’t change the fact that the dollar is in serious fundamental trouble. Gold should be your personal reserve currency. Take note of the price action on the above chart. Compared to gold and the euro, the dollar is the worst performer.
- The decline in the dollar over the last few years is creating economic challenges for the citizens of America. The “misery index” is on the rise. This index is the unemployment rate added to the inflation rate. The growing misery is caused by rising debt and currency devaluation. Go to www.miseryindex.us to view monthly statistics that extend back to 1948.
- Note the recent commentary from one of the world’s leading investors, Jim Rogers, “We have shortages of everything from oil to food and on top of that we have governments printing more money. Put the two together and you have some serious inflation coming down the road.” Jim Rogers, circa 2006-2011.
- While pinpointing an exact date for a lot of the quotations from Jim Rogers is difficult, I would like to point out that the bulk of the most recent misery index number is based on the official unemployment number. Should inflation start to rise, the misery index could easily rise above the highs hit in the 1970s.
- An unsuspecting public is getting clobbered with both inflation and deflation. Homes are devaluing while fuel and retail food prices are rising, which means rising misery levels.
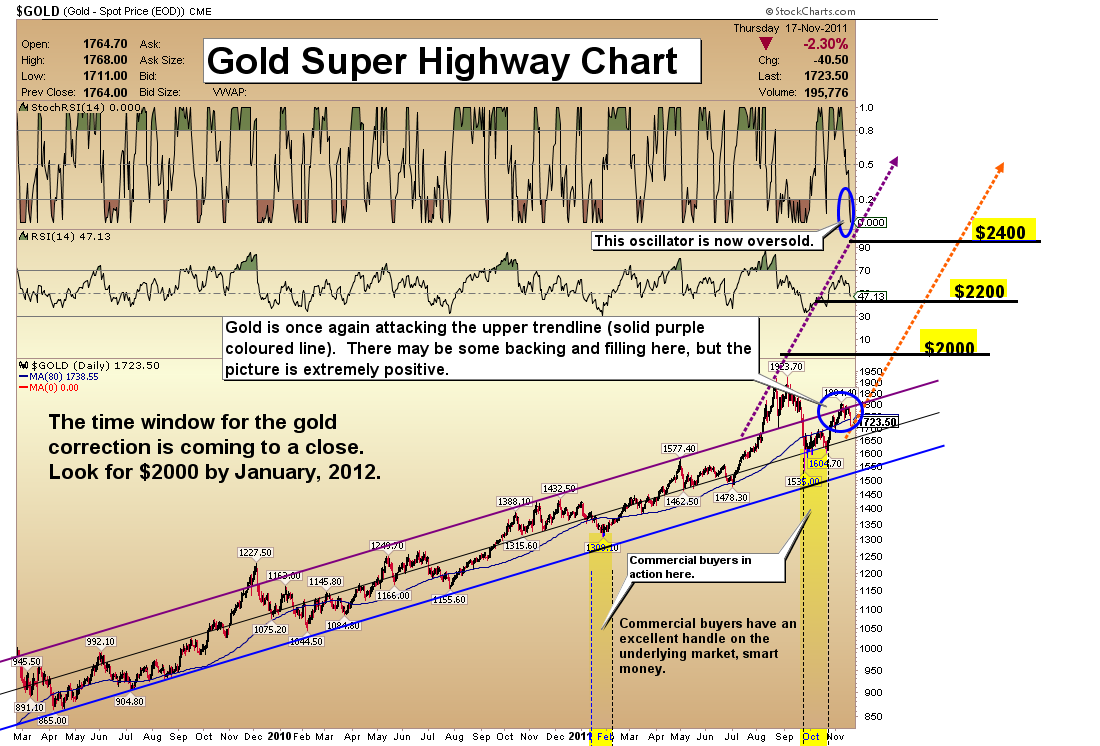
Gold Super Highway Chart
Analysis
- I first posted the gold superhighway chart in late July, when gold was trading near $1578. Shortly thereafter, gold blasted its way into my projected trend channel, hitting a high of about $1923, before correcting in what was really a miniature crash.
- That’s where we’ve been. The important question is, where do we go from here? Note the oversold position of the Stochastics RSI indicator at the top of the chart. This pullback to the $1700-1720 area is likely the last one before gold blasts much higher.
- Volatility will continue to grow, and that is something you can use to your advantage, by buying violent corrections in the gold price. Take some profit as bedrock fundamentals push gold to new highs.
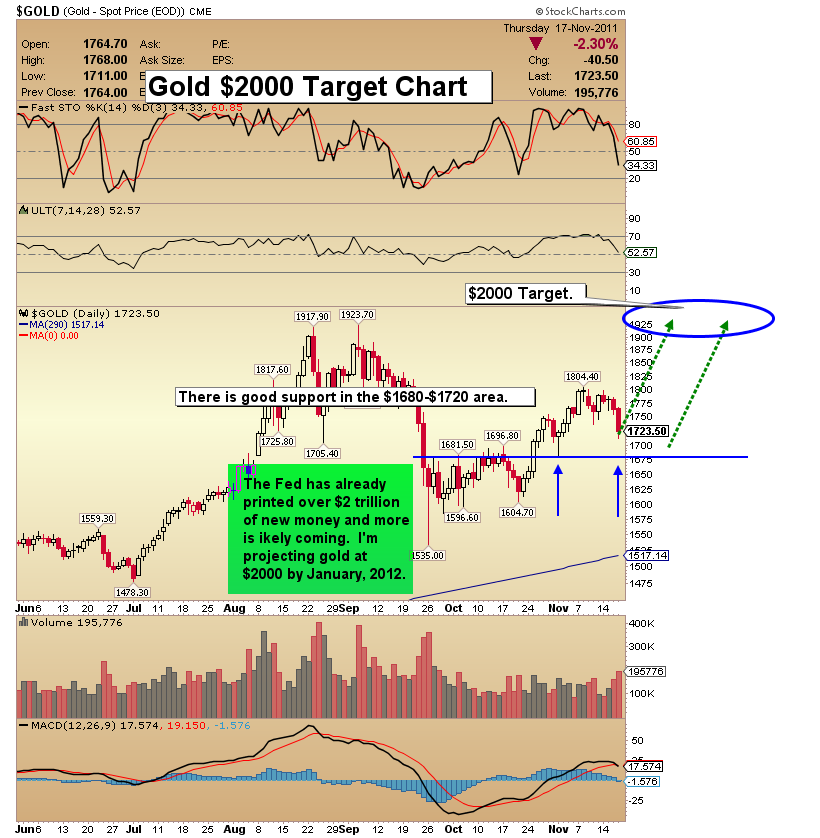
Gold $2000 Target Chart
- One of the keys to understanding this market is sentiment. The indicators I track point to significant pessimism on gold, even as the technical backdrop improves. Gold hasn’t made a new high, but we’re establishing a base for a run into the “super highway” channel. When gold goes up into the channel that will likely be the beginning of a period of shocking price appreciation.
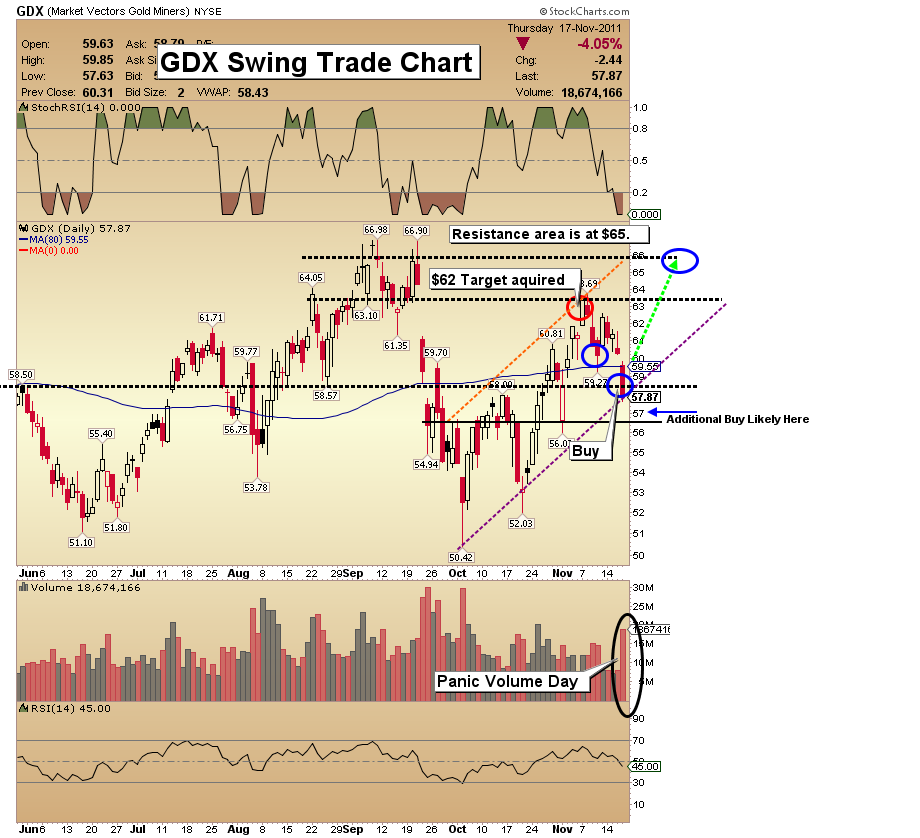
GDX Swing Trade Chart
- One important indicator of coming higher prices for any stock is company earnings. Key gold and silver mining companies have reported very strong earnings and have started increasing their dividends. This development is necessary for the gold equities index to see new highs, which I am calling for by year-end.
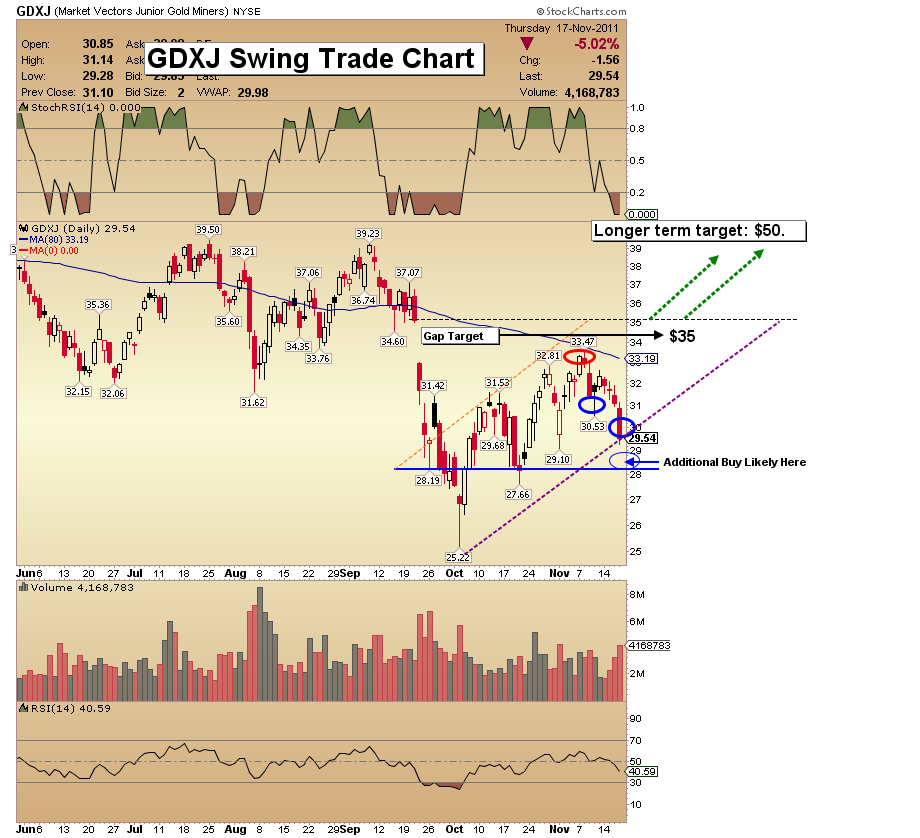
GDXJ Swing Trade Chart
- Note the trading channels I have outlined for both GDX and GDXJ, from the early October lows. GDX has rallied about 26% off its recent low, and GDXJ has rallied about 32%.
- Keep brokerage transaction costs low when engaging in swing trading. A 10% gain in a few trading days might seem great, but if your commissions are too high, your profits can be all in the hands of your broker!
- Note the big panic volume bar on Thursday. I issued a fresh buy signal for GDXJ traders. It’s not easy to buy during a panic, but the percentage gains if price reverses can come very quickly.
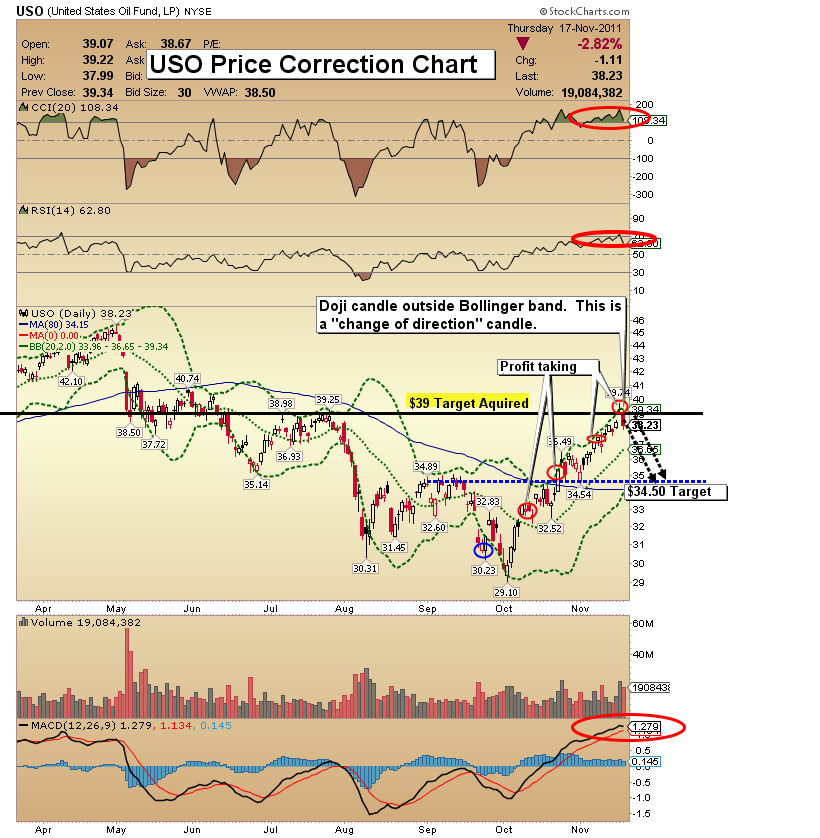
USO (Crude Oil Proxy) Chart
- I am using three charts to demonstrate what I see in the coming weeks in the oil markets. Crude oil is a great long term investment. Since the lows hit near the start of October, the price has rallied over 35%. I suggest swing traders take profits now.
- Wednesday looks to have been a key day, with a doji candle formation through the top of the Bollinger band, indicating the end of the move and a direction change. Other technical indicators on the chart are overbought. I’m targeting 34.50 on USO as a very good price to re-enter the oil market.
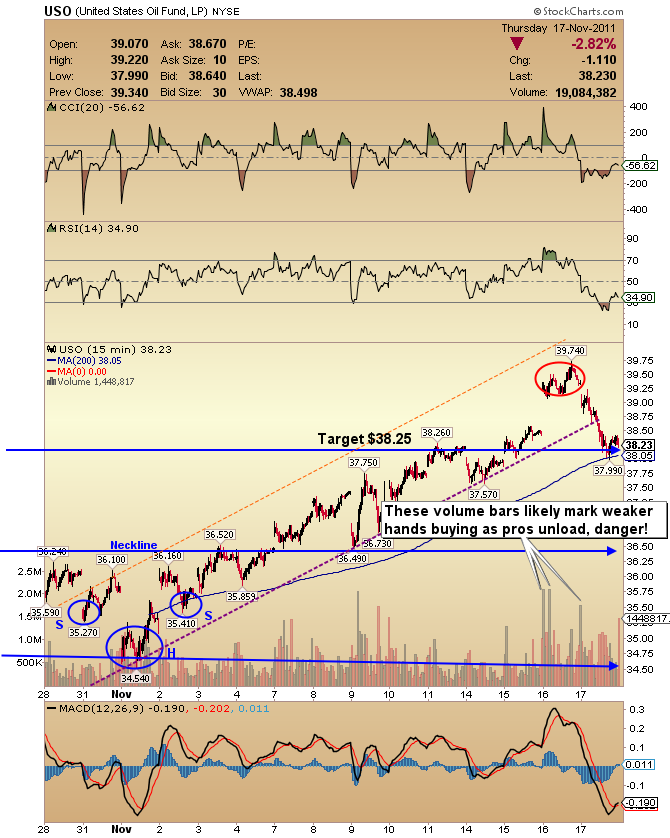
USO 15 Minute Chart
- Another key short term trading chart I use to target the start and end of crude oil moves is the 15 minute chart. An inverse head and shoulders targeted $38.25, and that target has been acquired. It is common for a price run from a head and shoulders formation to overrun the mathematical target, and that has occurred here.
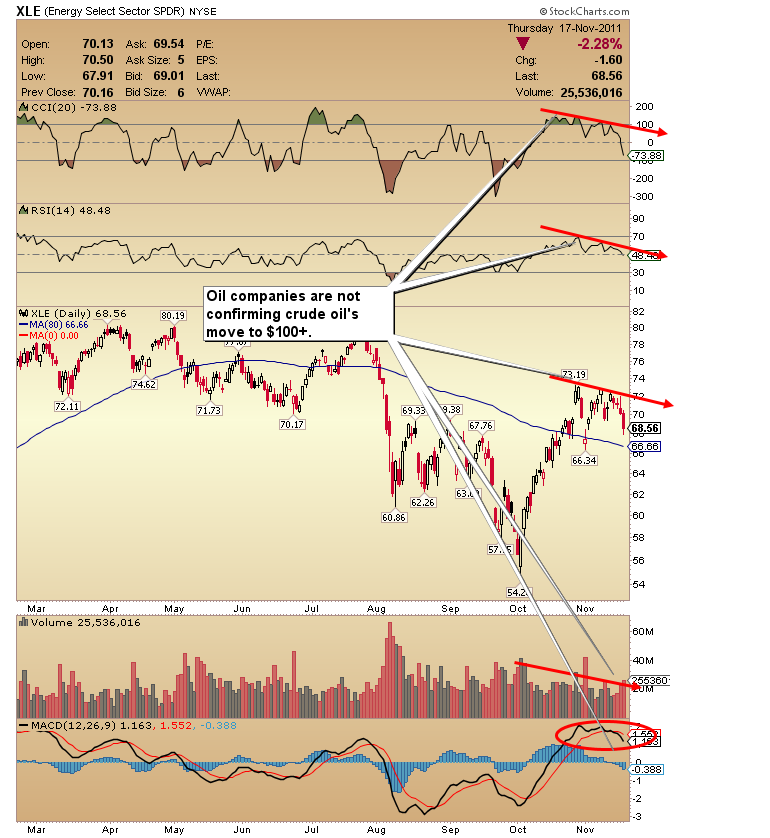
XLE (Energy Stocks ETF) Chart
- Crude oil roared to over $100, but the lack of confirmation by the energy stocks sector indicates that the short term move is likely ending. As crude was making new highs on Wednesday, note how XLE was rolling over. The XLE chart began giving warnings several days ago. The energy sector now looks set for a strong pullback.
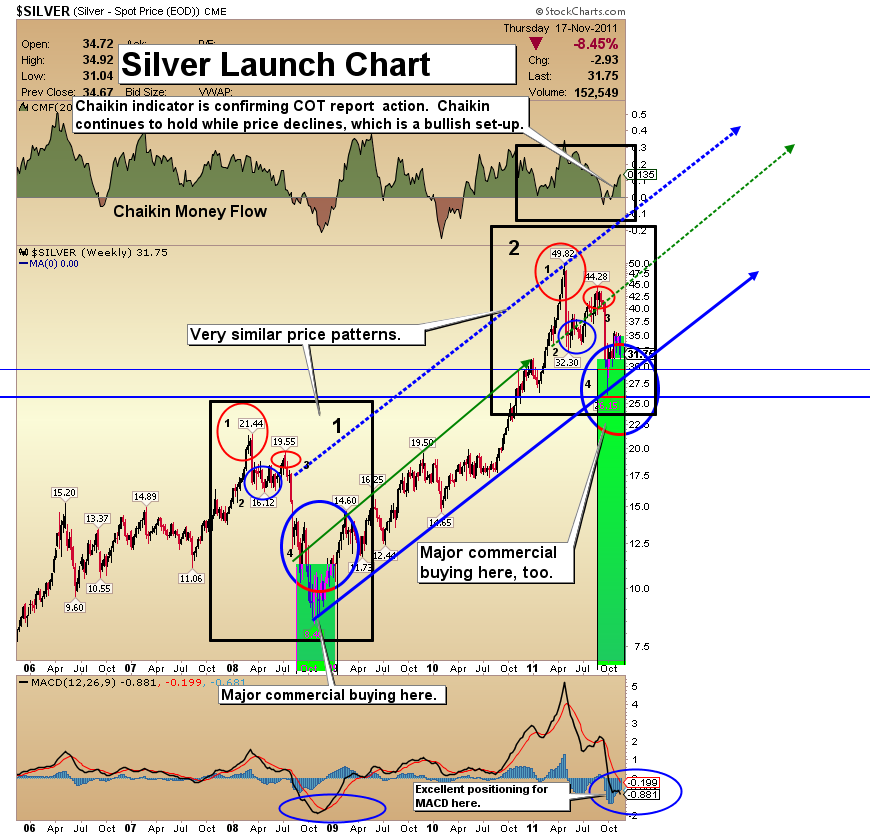
Silver Chart
- The commercial traders’ support for silver is truly amazing. Gold has continued to see some commercial position adjustment (selling) after the recent price advancement. Commercial silver traders are holding nearly as large a long position as they were several weeks ago, when silver was trading at its recent low!
- Keep some physical silver outside the banking system. I continue to see silver as one of the best investments to own for price appreciation!
Friday, Jul 3, 2026 Super Force Signals Unique Introduction For 321Gold Readers:
Send me an email to admin@supergoldsignals.com and I’ll send you my free “Inflation Thunder Now!” gold and silver stocks video report. I’ll also include 3 of my next Super Force Surge Signals free of charge, as I send them to paid subscribers. Thank you!
|
Stay alert for our Super Gold alerts, sent by email to subscribers,
for both the daily charts on Super Force Signals at www.supergoldsignals.com and for the 60 minute
charts at www.supergoldsignals.com
About Super
Gold Signals:
Our Surge Gold Signals are created thru our proprietary blend
of the highest quality technical analysis and many years of successful
business building. We are two business owners with excellent synergy.
We understand risk and reward. Our subscribers are generally successfully
business owners, people like yourself with speculative funds,
looking for serious management of your risk and reward in the
market.
Frank Johnson:
Executive Editor, Macro Risk Manager.
Morris Hubbartt: Chief Market Analyst, Trading Risk Specialist.
website: www.supergoldsignals.com
email:
admin@supergoldsignals.com
email: admin@supergold60.com
Mail:
1276 Lakeview Drive
Oakville, Ontario, L6H 2M8
Canada
###
Nov 18, 2011
Morris Hubbartt
321gold
Ltd

|
