Super Force Signals - A Leading
Market Timing Service
We Take Every Trade Ourselves
A Little Gold Fright Is Alright
Morris Hubbartt
Weekly Market Update Excerpt
posted Nov 16, 2012
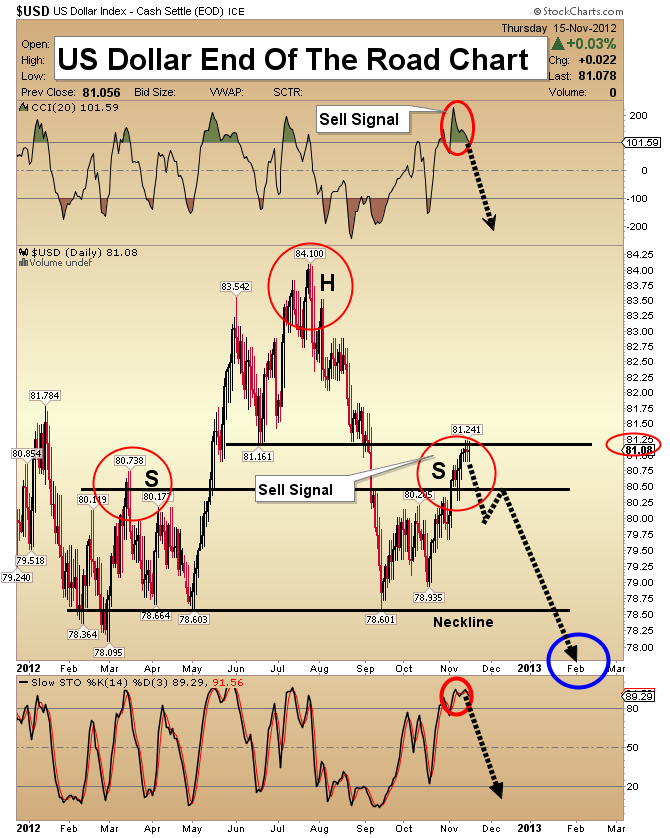
US Dollar End Of The Road Chart
- The US dollar counter-trend move to the upside is probably nearing the end of the road. Firm resistance resides at the 81.25 area, and all of my indicators point to lower prices.
- Once the countertrend move higher is complete, the large head and shoulders top pattern should take center stage. A decline below 80.50 could trigger a mini-crash.
- I am forecasting lower general equity prices in the near term. That could offer some support to the dollar, but it will probably be negligible.
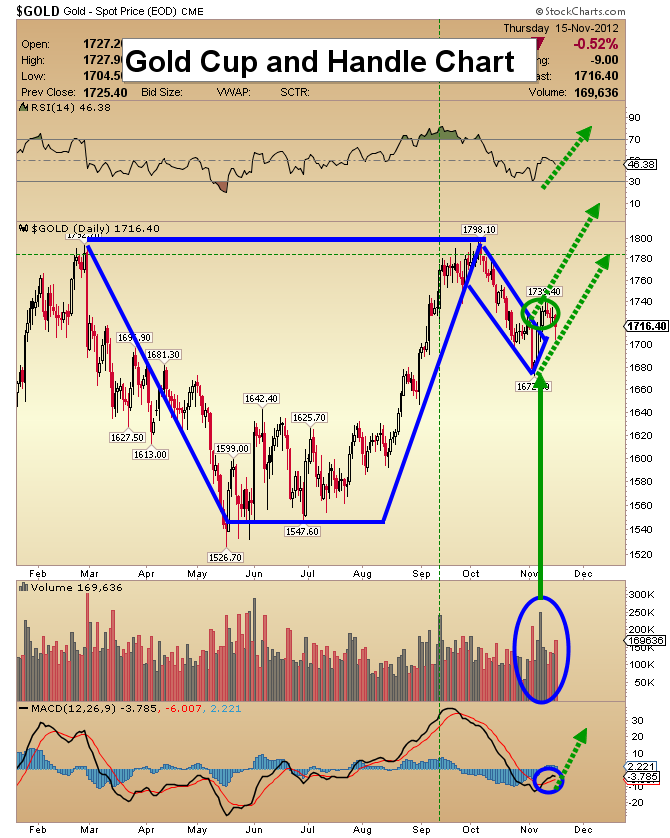
Gold Cup and Handle Chart
- The fiscal cliff has increased volatility in most markets. Gold is bucking that trend. An enormous cup & handle formation continues to unfold, in textbook form.
- Note the volume pattern that occurred around the time of the US election. This appears to be “weak hands” getting flushed out, and smart money covering short positions.
- Technically, the market is poised to move higher. The oscillators are in an ideal spot, and volume analysis suggests the bulls are clearly in control.
- My $1850 target should be acquired by late 2012. Early in 2013, gold should rise further, to $2015.
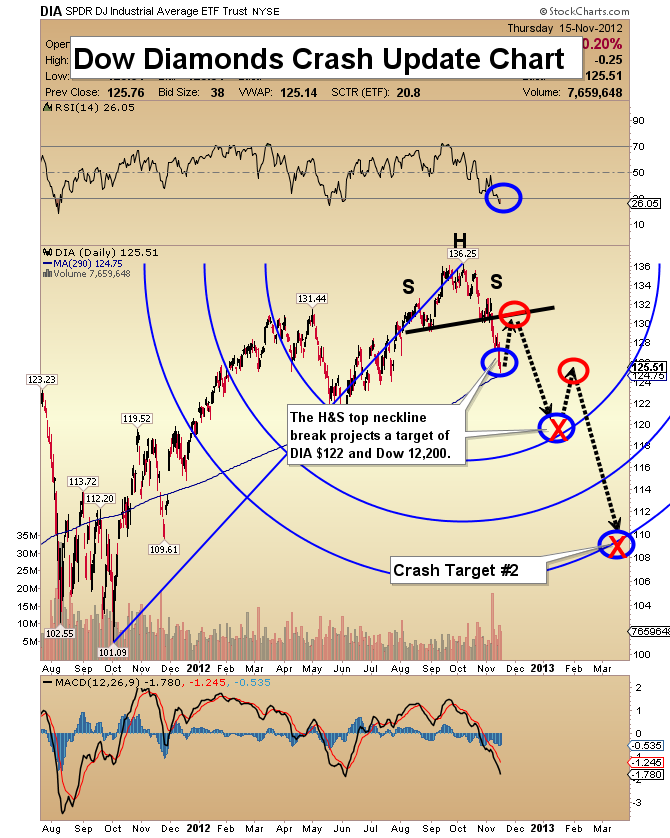
Dow Diamonds (Dow ETF Proxy) Crash Update Chart
- The broader market continues to struggle. A notable characteristic of the current market is major distribution on down days, and weak volume on up days.
- My technical works suggests there will be a decline to $122 for the “diamonds”, and to 12,200 for the Dow.
- In the short term, I’m looking for a rally to test the neckline of the small head & shoulders top pattern. From there, a panic sell-off could begin.
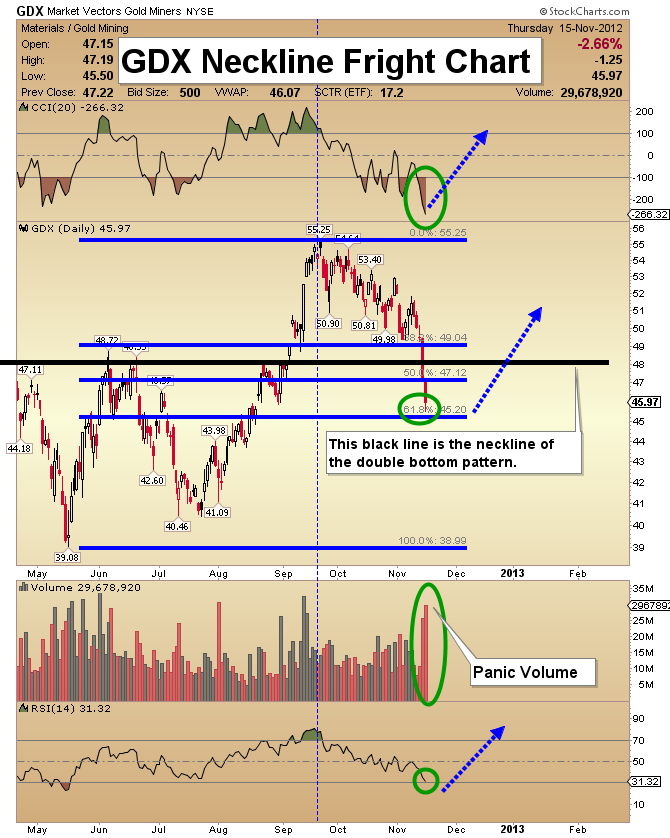
GDX Neckline Fright Chart
- Gold equity investors are generally weary. Some are afraid. Before you give up on gold stocks, I’d like to point out some key facts.
- First, the decline this week brought GDX to the key Fibonacci 61.8% retracement level. About a week ago, silver turned higher from the “Fib 50” line, and it’s held a good portion of that gain. I think that bodes well for GDX. It’s normal for gold stocks to exhibit much greater volatility than gold does during market panics.
- GDX and your favorite gold stocks could stage a surprising bounce from the Fib 61.8% line.
- The textbook double bottom pattern formed by gold stocks last summer now has a textbook pullback to the neckline area of that pattern. I would have preferred the decline to have halted near the “Fib 50” line, but this chart pattern is still very bullish.
- The power breakout volume area was also tested this week, making me confident that GDX will turn higher, and acquire my $66 target.
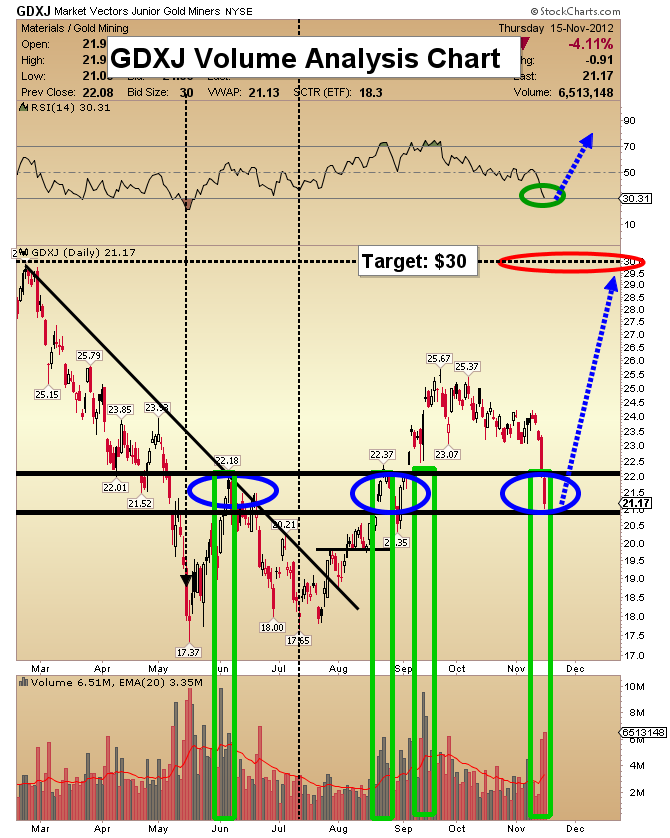
GDXJ Volume Analysis Chart
- The junior gold stocks have declined into important volume-based support areas (VBS). At this point in time, they look much stronger than the senior stocks.
- A pullback into the neckline area of a classic double bottom pattern is setting up GDXJ for a trending move to the upside.
- The RSI indicator is now near the 30 area, which is very bullish.
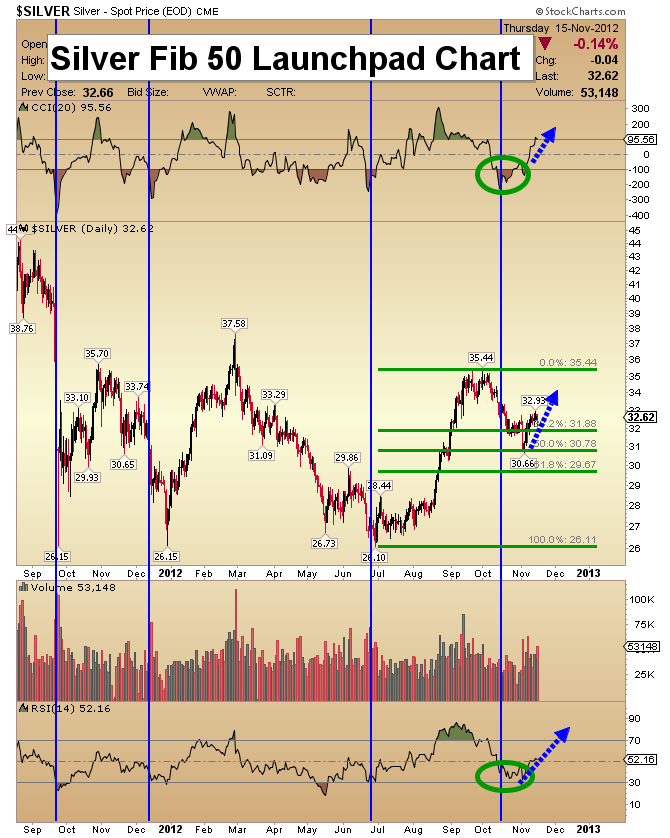
Silver Fib 50 Launchpad Chart
- Silver touched its 50% Fibonacci retracement level last week, and rallied strongly from there.
- We may be entering the eye of the debt storm, so I prefer to buy physical metal, and hold it for long term capital gains.
- The immediate target is $35.44, and once that is acquired I am projecting that a stronger move will carry this mighty metal to the $44 area!
Friday, Jul 3, 2026 Super Force Signals Unique Introduction For 321Gold Readers:
Send me an email to admin@supergoldsignals.com and I’ll send you my free “Inflation Thunder Now!” gold and silver stocks video report. I’ll also include 3 of my next Super Force Surge Signals free of charge, as I send them to paid subscribers. Thank you!
|
Stay alert for our Super Gold alerts, sent by email to subscribers,
for both the daily charts on Super Force Signals at www.supergoldsignals.com and for the 60 minute
charts at www.supergoldsignals.com
About Super
Gold Signals:
Our Surge Gold Signals are created thru our proprietary blend
of the highest quality technical analysis and many years of successful
business building. We are two business owners with excellent synergy.
We understand risk and reward. Our subscribers are generally successfully
business owners, people like yourself with speculative funds,
looking for serious management of your risk and reward in the
market.
Frank Johnson:
Executive Editor, Macro Risk Manager.
Morris Hubbartt: Chief Market Analyst, Trading Risk Specialist.
website: www.supergoldsignals.com
email:
admin@supergoldsignals.com
email: admin@supergold60.com
Mail:
1276 Lakeview Drive
Oakville, Ontario, L6H 2M8
Canada
###
Nov 16, 2012
Morris Hubbartt
321gold
Ltd
 |
