Super Force Signals - A Leading
Market Timing Service
We Take Every Trade Ourselves
New Gold Target: $2330
Morris Hubbartt
Weekly Market Update Excerpt
posted Nov 11, 2011
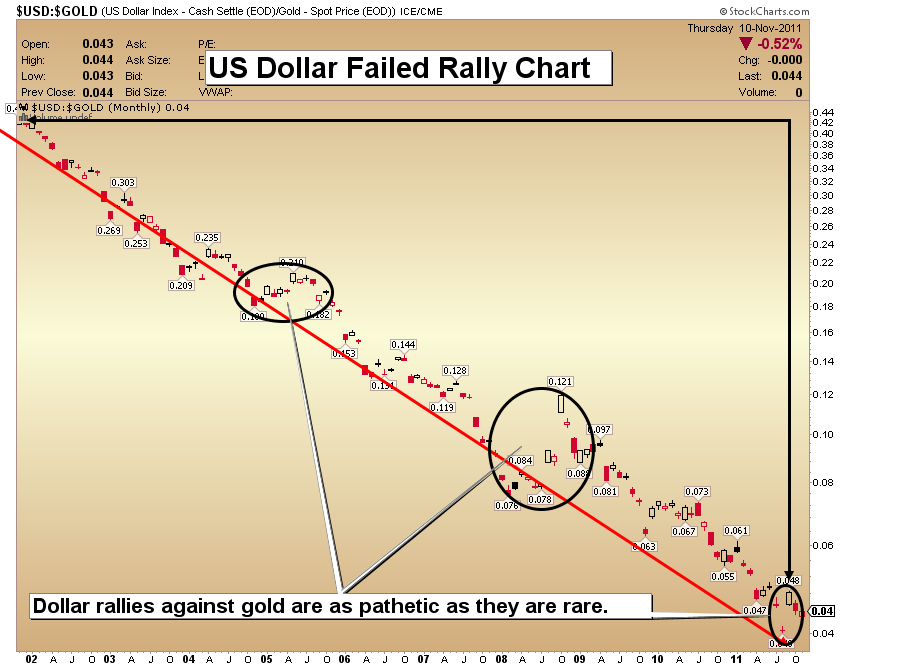
US Dollar Against Gold Chart
Analysis
- How safe is the dollar, really? Each social safety net program began the size of a mouse and grew over time, into what is now an elephant on growth hormones. Few of these programs have ever been phased out, so we rely on the printing press more and more, to keep the spending going.
- There’s not enough tax revenue collected to pay all these bills. The budget deficit for 2011 already is $1.3 trillion. More big government “solutions” have been passed in the last couple of years, including nationalized health care. Rather than going away, these deficits may be just starting to greatly accelerate.
- Four years ago, the deficit was less than $250 billion. Now it is $1.3 trillion, a fourfold rise. What will it be four years from now?
- When considering gold to protect yourself from this madness, ask yourself what paper currencies laced with debt are really going to be worth in the next couple of years. When you do an honest accounting of debt in the western world, the debt is beyond the point of no return. Money printing seems be the new “American Way”.
- The above chart shows how steadily the dollar is falling against gold, and suggests the move has a long way to go. The rallies in the dollar are almost invisible. Gold, purchased on price weakness, remains the only sensible solution for investors.
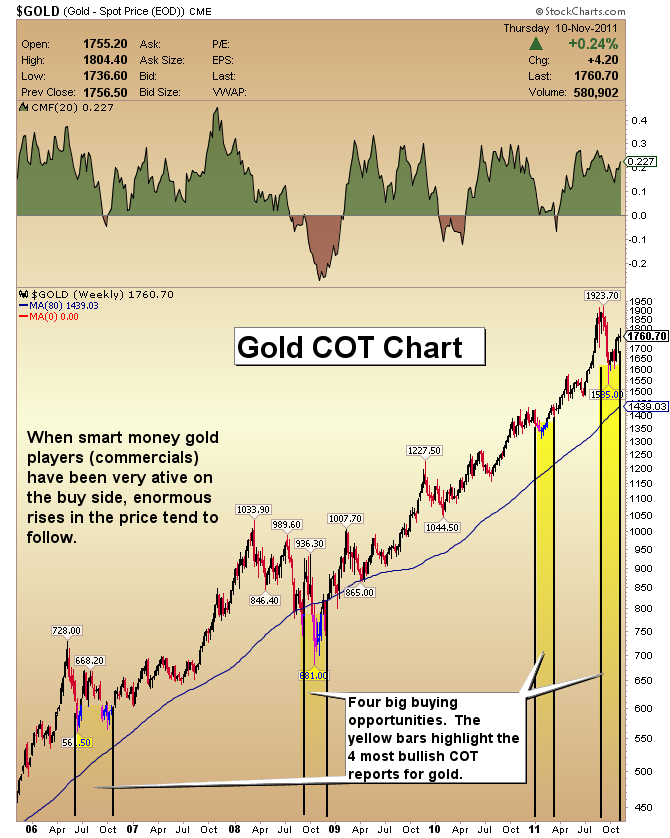
Gold COT Chart
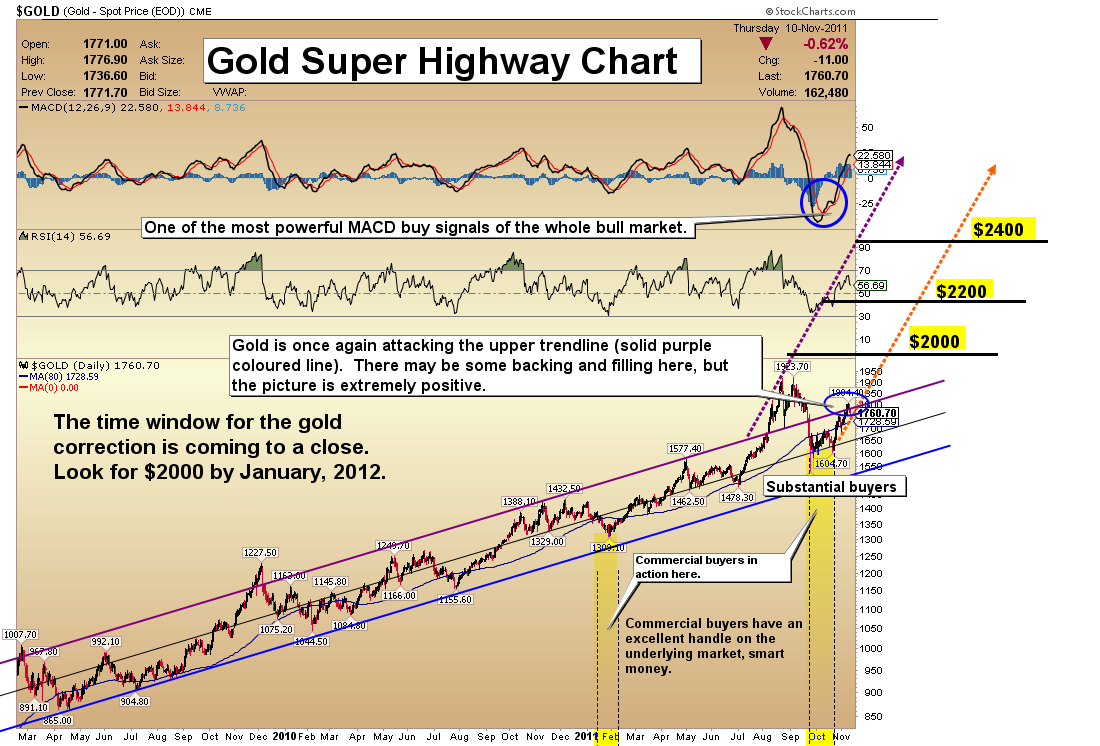
Gold Super Highway Chart
Analysis
- I have highlighted commercial traders, and the historical significance of their strong buy action. Such action is quite rare, and may carry important implications for the upside of the gold price. I’m looking for a slight pull back here, and then it should be off to the races into the large up channel, with an intermediate term target in the $2330 area.
Once these commercial buyers step in, the force of the move to the upside tends to be very powerful. Within a couple of years, the gold price can move well over 100% to the upside.
I am projecting gold at $2000 by the end of 2011 or early January, 2012. Please make a note of my gold COT chart analysis price target, which is $2330 as of July, 2012.
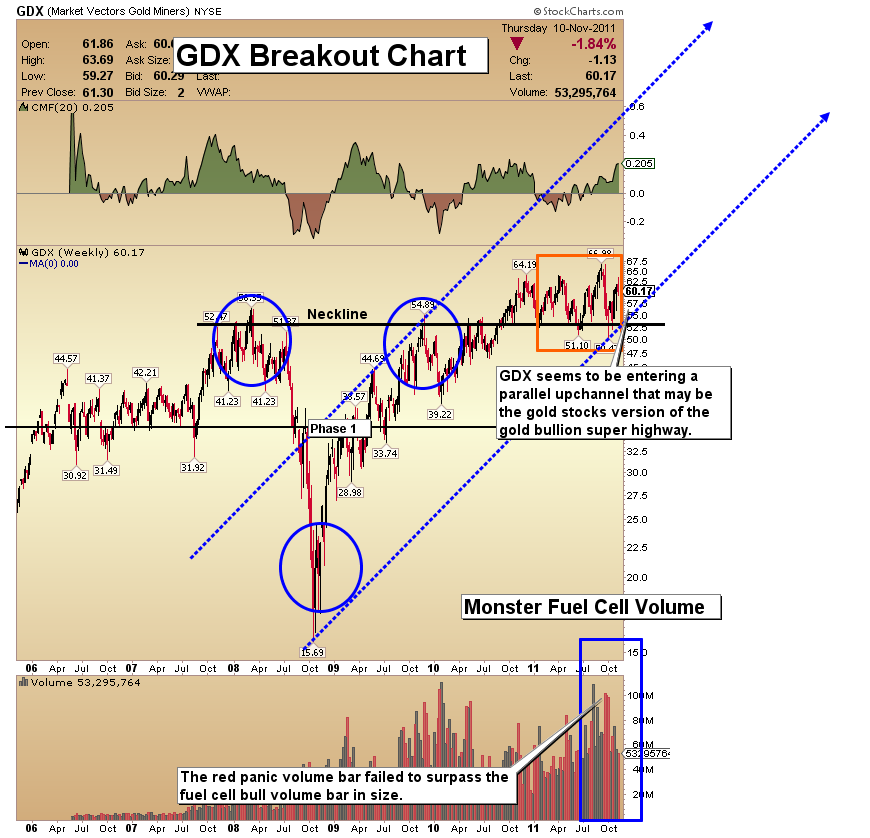
GDX Breakout Chart
- I am overweight GDX in my portfolios. The COT report action in the gold market suggests a new phase for gold stocks is also coming soon. The head and shoulders formation on GDX is the big picture. It suggests gold stocks are dramatically undervalued. The head and shoulders formation target is $95!
- I work mainly with 15 and 60 minute charts during the trading day. The 15 minute chart analysis is generally most effective when volume is on the light side. Early in the week as volume tapered off, and the price continued higher, profit taking was the mandatory “order of the day”. I have increased my core position from 65% to about 70%, leaving 30% to trade.
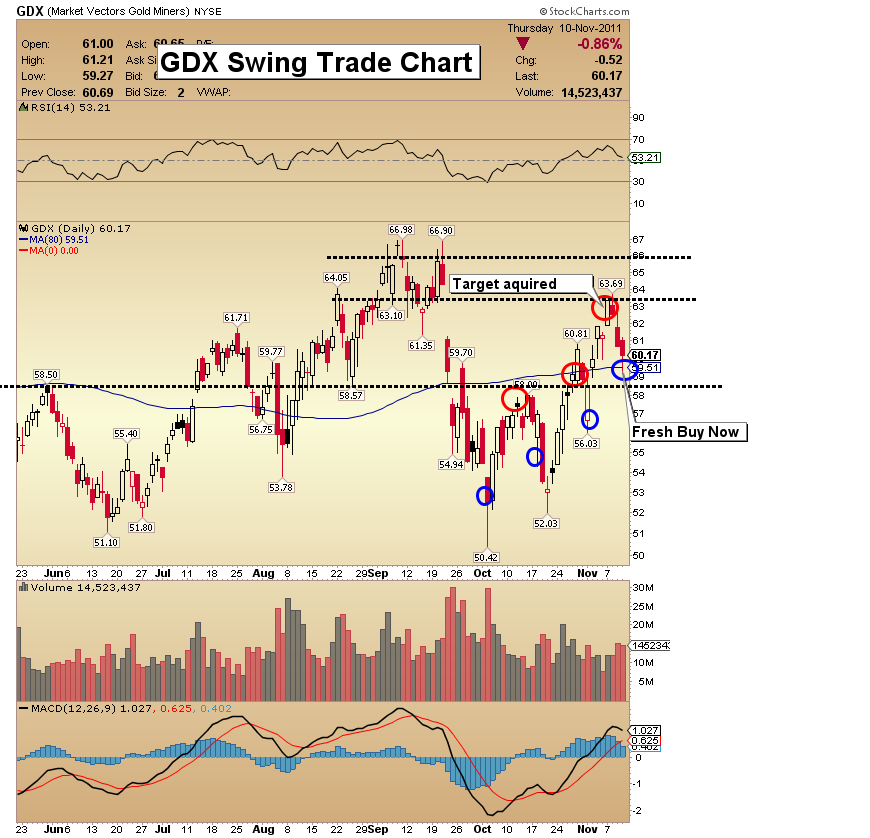
GDX Swing Trade Chart
- I issued a fresh GDX buy signal at $59.45 on Thursday. One or two day long tail corrections on candlestick charts are usually very bullish.
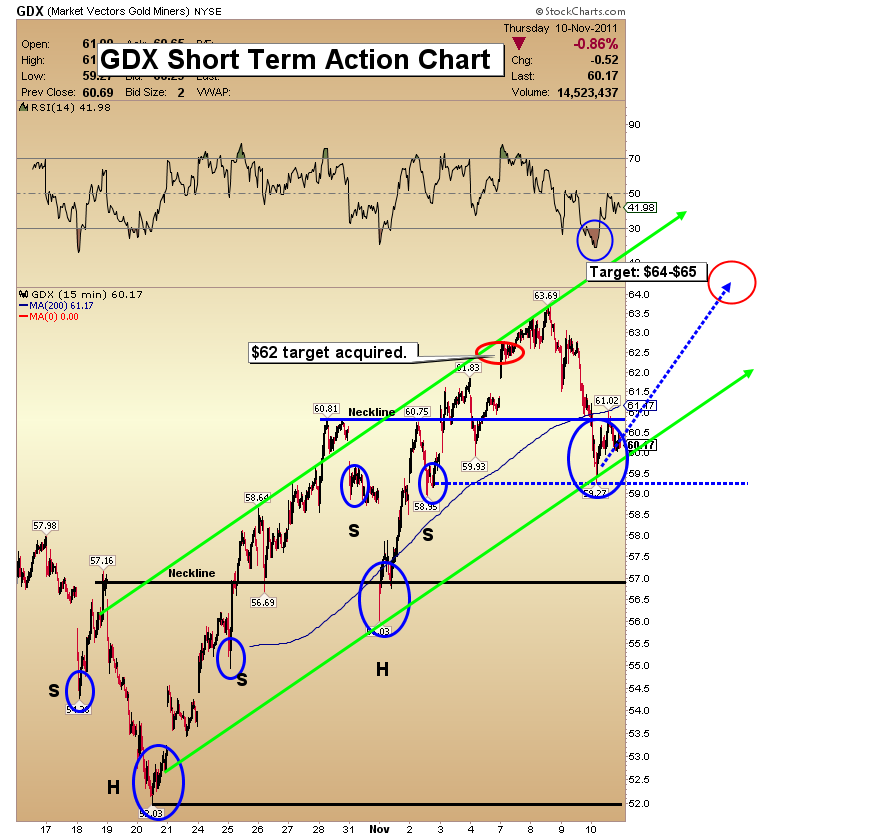
GDX 15 Minute Chart
- The initial head and shoulders target on the 15 minute chart of about $62 was acquired Monday. Now an additional head and shoulders price pattern has developed, targeting $64-$65, which is where I’d like you to take trading profits.
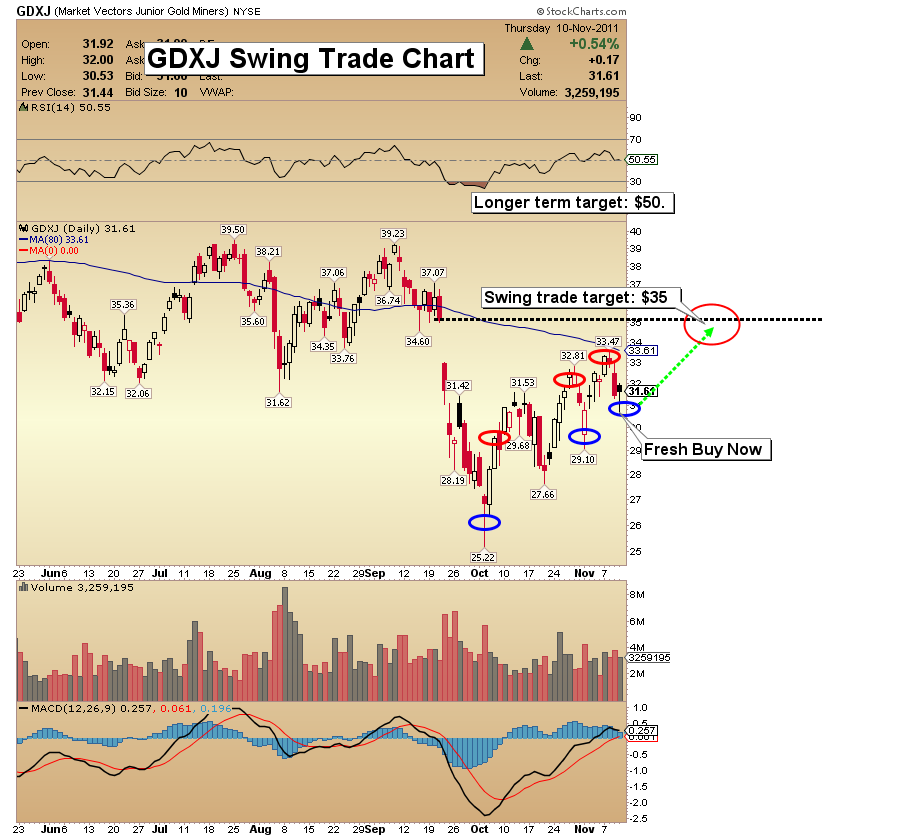
GDXJ Swing Trade Chart
- As with GDX, Thursday offered up more volatility for GDXJ, and I issued a new buy signal at $30.75. A powerful move in GDXJ to the upside is well underway. There could be one more pullback, but that may be finished as of yesterday. Over the next 12 months, I see GDXJ doubling, to approximately $50.
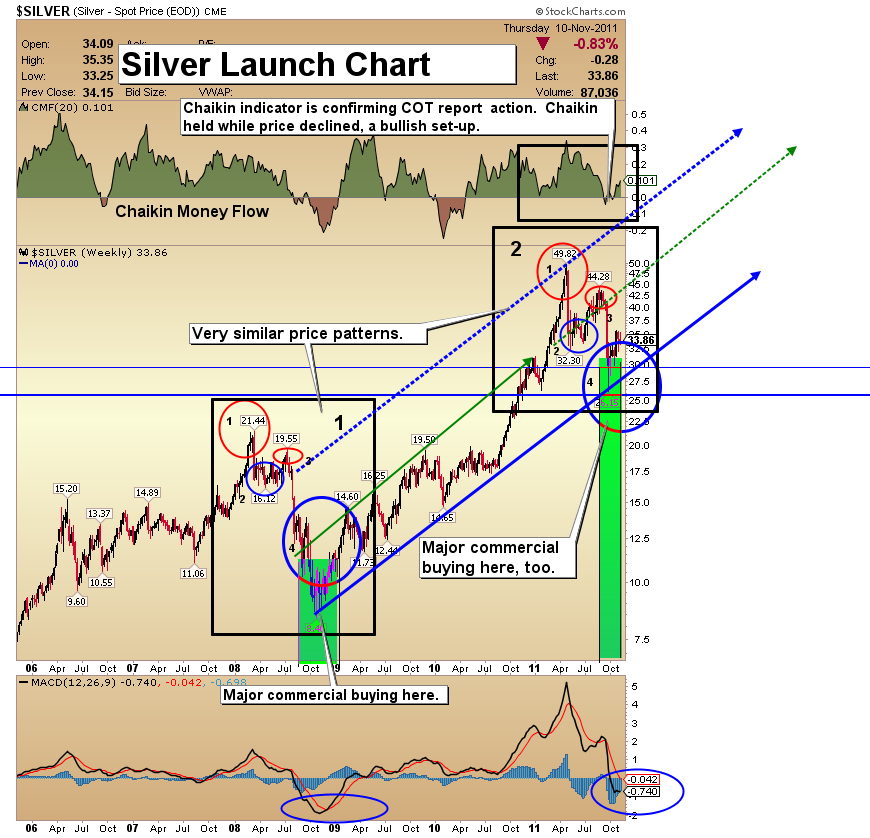
Silver COT Report Chart
- Over the past week, the commercials claimed some profits on gold. That hasn’t been the case with silver, suggesting the commercials are expecting a very big move higher in the silver price.
- The commercial traders are now about as net long silver as they were in 2008, when silver was trading at about $8.50. Their stance suggests the possible upside pricing for silver is far above current levels.
- I have included the Chaikin money flow indicator at the top of the silver chart. It confirms the absolutely amazing bullishness action of the commercial traders. I believe the technical set up exists to see silver rise towards $100 in the next 18 months!
Friday, Jul 3, 2026 Super Force Signals Unique Introduction For 321Gold Readers:
Send me an email to admin@supergoldsignals.com and I’ll send you my free “Inflation Thunder Now!” gold and silver stocks video report. I’ll also include 3 of my next Super Force Surge Signals free of charge, as I send them to paid subscribers. Thank you!
|
Stay alert for our Super Gold alerts, sent by email to subscribers,
for both the daily charts on Super Force Signals at www.supergoldsignals.com and for the 60 minute
charts at www.supergoldsignals.com
About Super
Gold Signals:
Our Surge Gold Signals are created thru our proprietary blend
of the highest quality technical analysis and many years of successful
business building. We are two business owners with excellent synergy.
We understand risk and reward. Our subscribers are generally successfully
business owners, people like yourself with speculative funds,
looking for serious management of your risk and reward in the
market.
Frank Johnson:
Executive Editor, Macro Risk Manager.
Morris Hubbartt: Chief Market Analyst, Trading Risk Specialist.
website: www.supergoldsignals.com
email:
admin@supergoldsignals.com
email: admin@supergold60.com
Mail:
1276 Lakeview Drive
Oakville, Ontario, L6H 2M8
Canada
###
Nov 11, 2011
Morris Hubbartt
321gold
Ltd

|
