Super Force Signals - A Leading
Market Timing Service
We Take Every Trade Ourselves
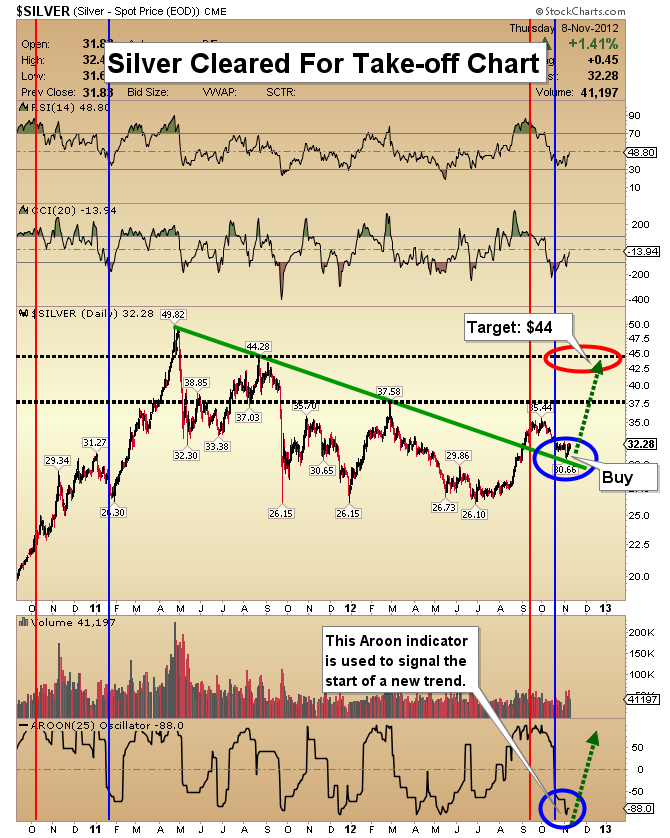
Silver Cleared For Take-Off
Morris Hubbartt
Weekly Market Update Excerpt
posted Nov 9, 2012
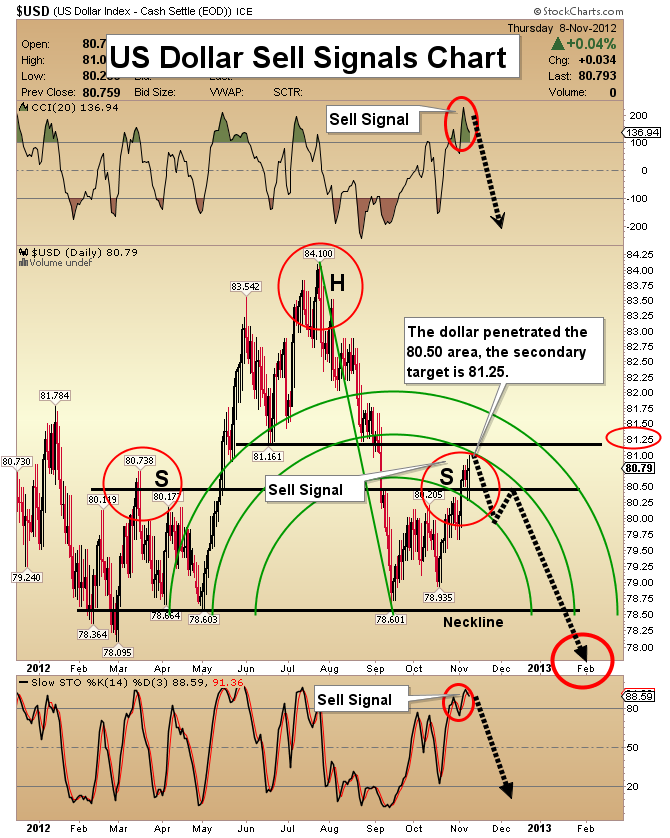
US Dollar Sell Signals Chart
- The CCI indicator put in a spike high on Monday, and that suggests the dollar is making a top. A spiking CCI is most dependable when it is accompanied by soft volume, as it was on Monday.
- The head & shoulder top formation that I’ve highlighted on this chart is very well shaped.
- For this pattern to be “activated”, the dollar should trade below the neckline for at least two consecutive days. Once that happens, a target price of 72 will be in play.
- My “slow Stokes” (Stochastics) indicator is also flashing a strong sell signal. My recommendation is to avoid the dollar. Focus on gold.
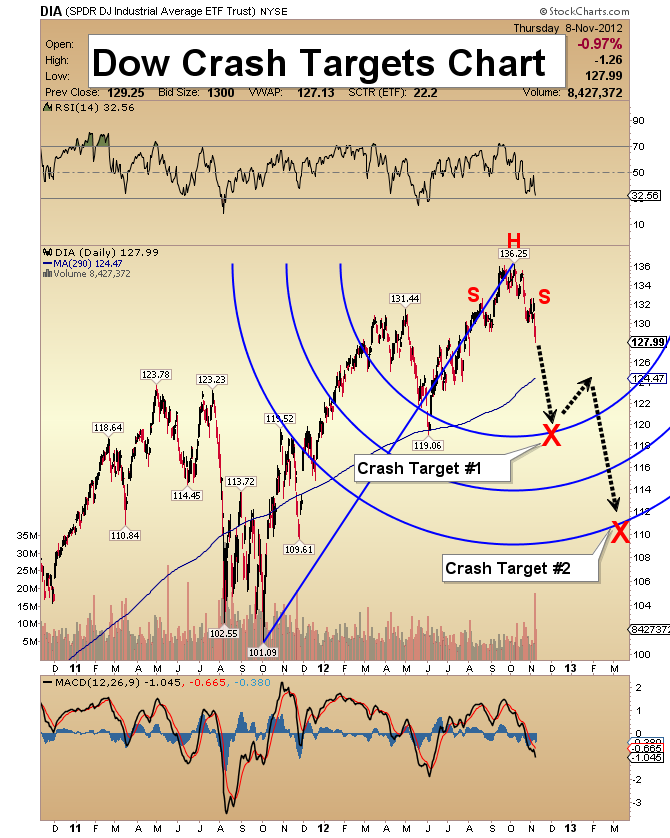
Dow Diamonds (Dow Proxy ETF) Crash Targets Chart
- The general equity market has completed a small head & shoulders top pattern. Note the massive increase in sell-side volume over the past 2 days. Crashes can follow this type of volume & price pattern.
- If the Dow crashes, I expect gold stocks to soar.
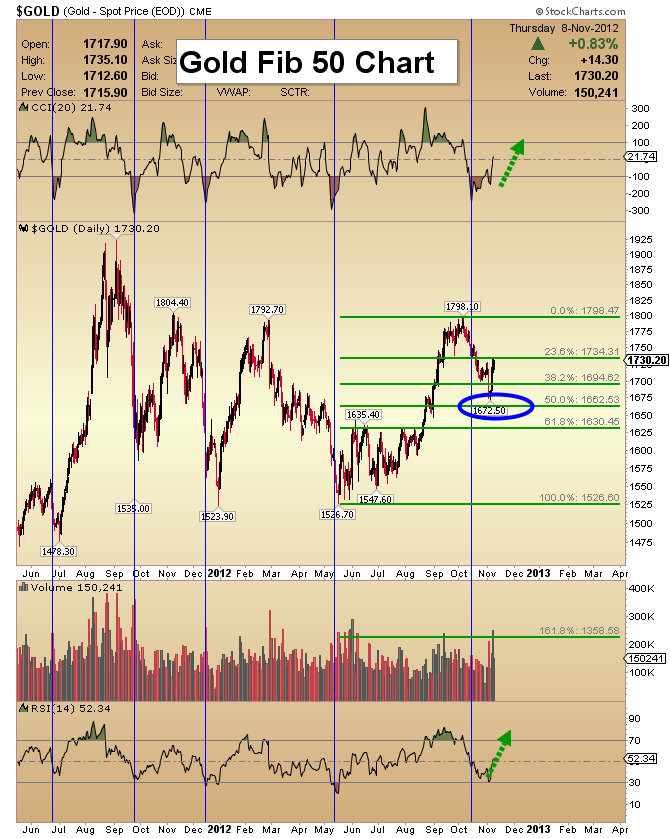
Gold Fib 50 Chart
- Last Friday, gold moved towards the 50% Fibonacci retracement line at $1662, and now a “buy volume” spike is in play.
- The next COT report is an important one, and I expect it to show that commercial traders covered a lot of short positions. Long term core positions should be built in times of market turbulence. I advocate holding some physical metal outside of the banking system.
- My next significant targets for gold are $1850 and $2015. From about $2015, I expect a consolidation, and then even higher prices.
- A key technical event in the gold market is the recent spike by the CCI indicator. On this chart, I’ve highlighted 5 similar CCI spikes down. You can see that the gold price tends to rise significantly after these spikes.
- A CCI spike doesn't mean the decline in gold will end immediately, but it does mean a turn is near. Following the most recent CCI spike, gold bottomed on Tuesday, Nov 6th. I think a major move higher is underway now.
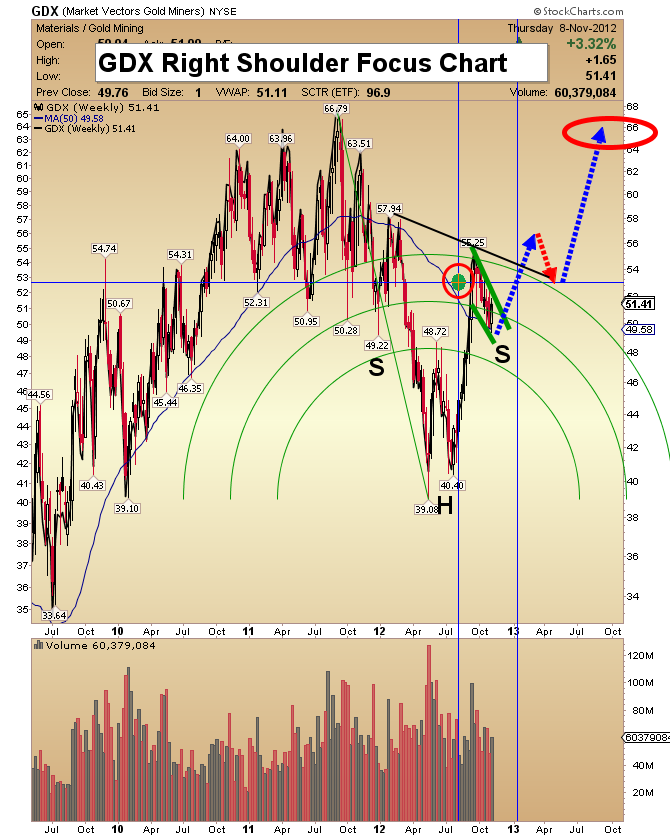
GDX Right Shoulder Focus Chart
- The above chart clearly displays a bull pennant formation. The pennant is highlighted with two green trend lines. It forms the right shoulder of an enormous head & shoulders bottom.
- The target of this head & shoulders pattern is $66. I think GDX could overshoot that price, and touch $72 by January, 2013.
- For years, the gold community has been hoping to see the gold stocks outperform bullion. It’s starting to happen, so please be very stingy with your sell orders!
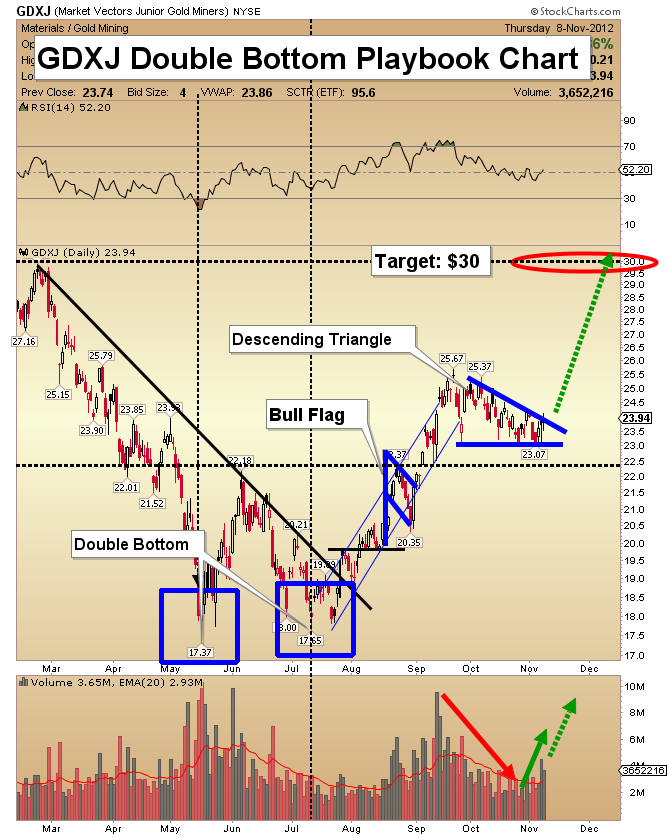
GDXJ Double Bottom Playbook Chart
- From the lows of this summer, junior gold stocks have outperformed all other sectors of the precious metals market.
- The current consolidation follows a whopping 45% gain. As the bull trend resumes, outperformance again seems likely. Volume is picking up nicely, as GDXJ attempts to rise out of a descending triangle pattern.
- My price target for this move is $30. If the Dow crashes, it could be acquired very quickly. The US central bank would likely announce emergency money printing measures to stop a meltdown of the banking system. That would benefit gold and related markets like the junior mining companies.
- The fiscal cliff is a serious situation, and the only “solution” seems to be more money printing. While the Dow gets pummeled, the junior gold stocks are displaying tremendous relative strength!
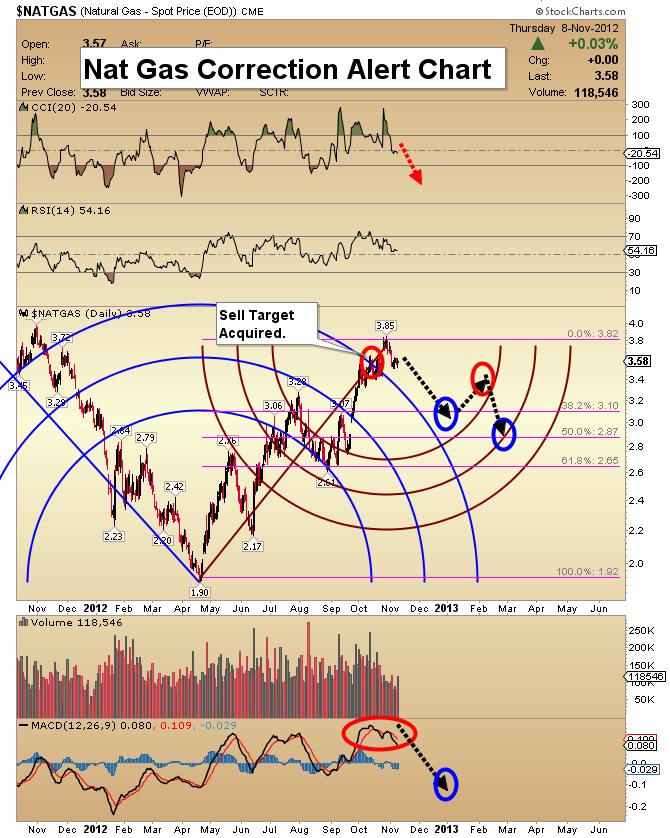
Natural Gas Correction Alert Chart
- Natural gas is a long term winner, but my technical work is now projecting that downside targets of $3.10 and $2.85 are likely to be acquired by March 31, 2013.
Silver Cleared for Take-Off Chart
- Silver is an ideal metal to accumulate on price weakness. The market is currently oversold. Please note how perfectly the price has pulled back to the green downtrend line, after staging a magnificent breakout!
- The Aroon indicator is very effective at identifying the start of a new trend. Note the superb location of this indicator now.
- The RSI and CCI indicators are also flashing strong buy signals. I expect the $44 price target will be acquired by January, 2013. The “silver plane” appears to be cleared for take-off. I hope you are on board!
Friday, Jul 3, 2026 Super Force Signals Unique Introduction For 321Gold Readers:
Send me an email to admin@supergoldsignals.com and I’ll send you my free “Inflation Thunder Now!” gold and silver stocks video report. I’ll also include 3 of my next Super Force Surge Signals free of charge, as I send them to paid subscribers. Thank you!
|
Stay alert for our Super Gold alerts, sent by email to subscribers,
for both the daily charts on Super Force Signals at www.supergoldsignals.com and for the 60 minute
charts at www.supergoldsignals.com
About Super
Gold Signals:
Our Surge Gold Signals are created thru our proprietary blend
of the highest quality technical analysis and many years of successful
business building. We are two business owners with excellent synergy.
We understand risk and reward. Our subscribers are generally successfully
business owners, people like yourself with speculative funds,
looking for serious management of your risk and reward in the
market.
Frank Johnson:
Executive Editor, Macro Risk Manager.
Morris Hubbartt: Chief Market Analyst, Trading Risk Specialist.
website: www.supergoldsignals.com
email:
admin@supergoldsignals.com
email: admin@supergold60.com
Mail:
1276 Lakeview Drive
Oakville, Ontario, L6H 2M8
Canada
###
Nov 9, 2012
Morris Hubbartt
321gold
Ltd

|
