Super Force Signals - A Leading
Market Timing Service
We Take Every Trade Ourselves
Gold Stock Technicals Are Ultra Bullish
Morris Hubbartt
Weekly Market Update Excerpt
posted Oct 28, 2011
US Dollar Chart Sentiment
Analysis
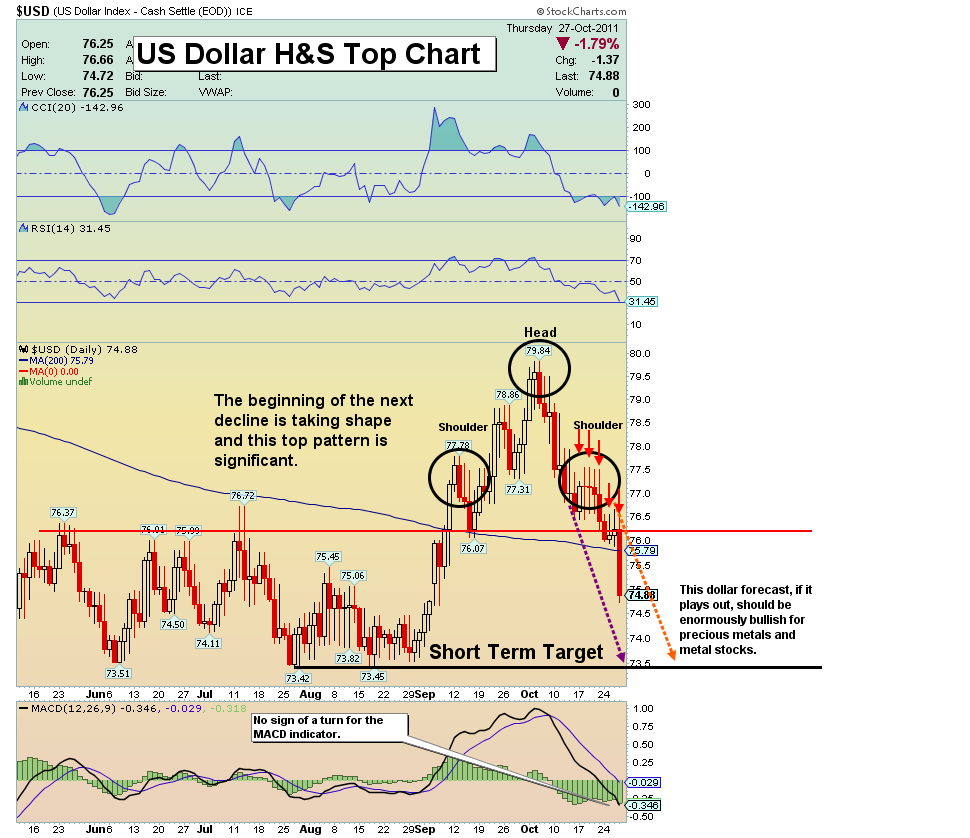
- The US dollar rally was predicted by many analysts to be “mighty”. I projected it to be short lived, and argued that it would become a meltdown situation. Technically, a head and shoulders formation is now clearly apparent, and the neckline has activated a move towards a target of 73.
- Sentiment indicators, as discussed last week, continue to show the dollar is poised for a serious decline. My technical work continues to project a 65-66 longer term target. This dollar forecast, if it even plays out partially, is enormously bullish for hard assets.
- Fundamentally, I’m no fan of the fiat currencies. In Europe there are attempts to implement austerity measures. Is it too little, too late? Time will tell, but historically real austerity often tends to come only after government currencies hyper-inflate their currencies.
- Is there a solution for America? The current administration’s showcase achievement seems to be nothing but a giant mushroom of debt. August numbers released by the Treasury Department show the national debt has increased $4 trillion on President Obama's watch, in just two and half years. We are supposed to believe that a “debt commission” will fix this problem. As an investor, the only rational course of action is to hold some physical gold & silver outside of the banking system.
Gold Super Highway Chart
Analysis
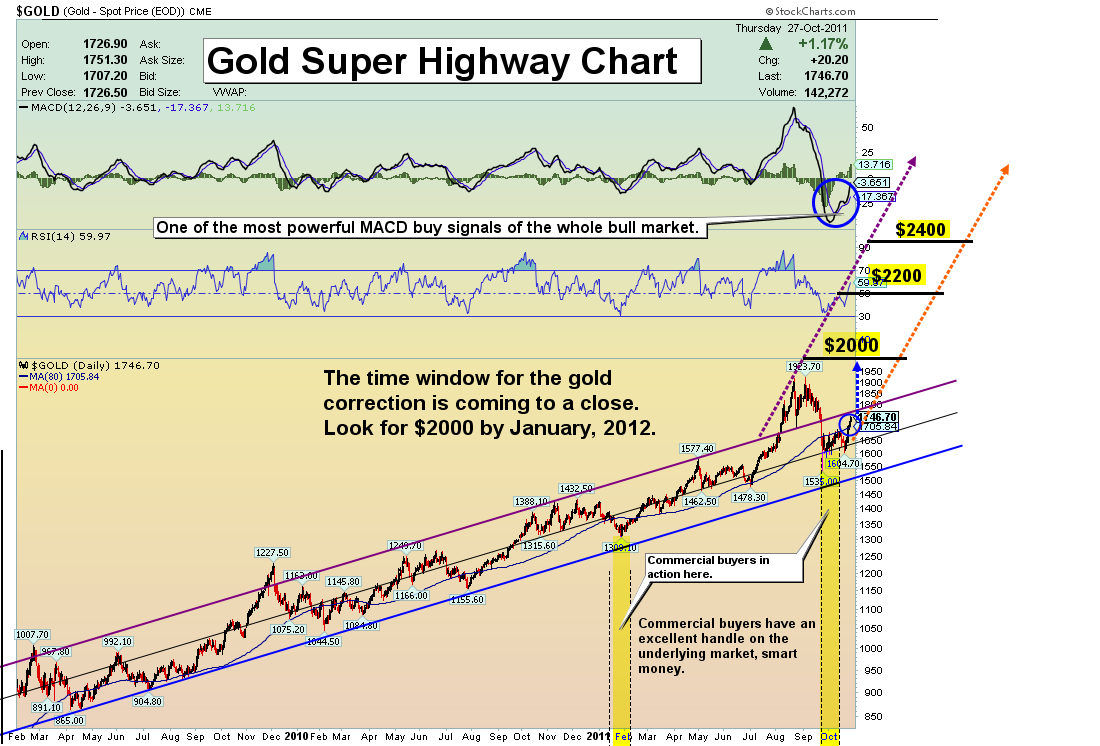
- The correction in gold has been healthy and necessary. A significant rebalancing market sentiment has occurred, putting the gold market in a powerful stance. The MACD on this chart is giving one of the most powerful buy signals in the history of the bull market.
- Leverage has been greatly reduced because the speculators have been “stop lossed” out of the market, in size. Gold held strongly without the support of these leveraged speculators, and this is the exact situation that sets the stage for a major advance.
- When the traders with the most money (the commercials) step up the size of their investments, that has historically been the time to employ capital, rather leverage your position for a quick trading gain. The gains that occur when the market is positioned as it is now can be absolutely enormous.
- This has been a time to increase your physical investment in gold outside the banking system, and a time to consider making gold your base currency. The decision boils down to a philosophy of speculative buying versus value buying.
- I said on October 14th in this space, “…New power uptrend projected to start on or near Oct 21st.” For the record, the gold market bottomed on Oct 20th.
$BPGDM Against Gold Chart
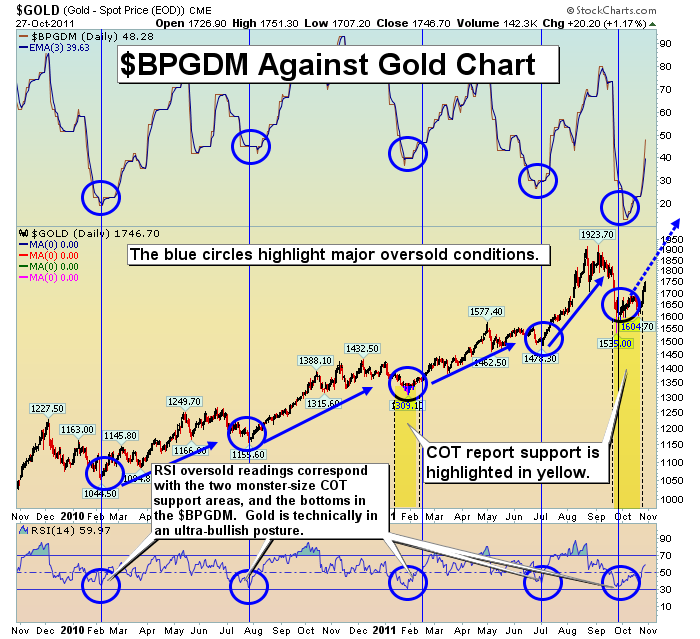
- I’m using a number of charts this week to demonstrate the oversold and undervalued nature of the entire precious metals sector. The $BPGDM is the “gold miners bullish percentage index”. It is an index designed to show the bullish or bearish posture of gold stocks.
- With this chart I’m using the RSI indicator to demonstrate a historical key bull market oversold reading coupled with an indicator, to show key turning points.
- Substantially oversold gold stocks are indicated in the top portion of the chart. In the middle of the chart is the gold price, and I’ve highlighted what has been impeccable timing of the commercial traders.
- The bottom line is that the technical situation is ultra-bullish for both gold and gold stocks.
GDX Breakout Chart
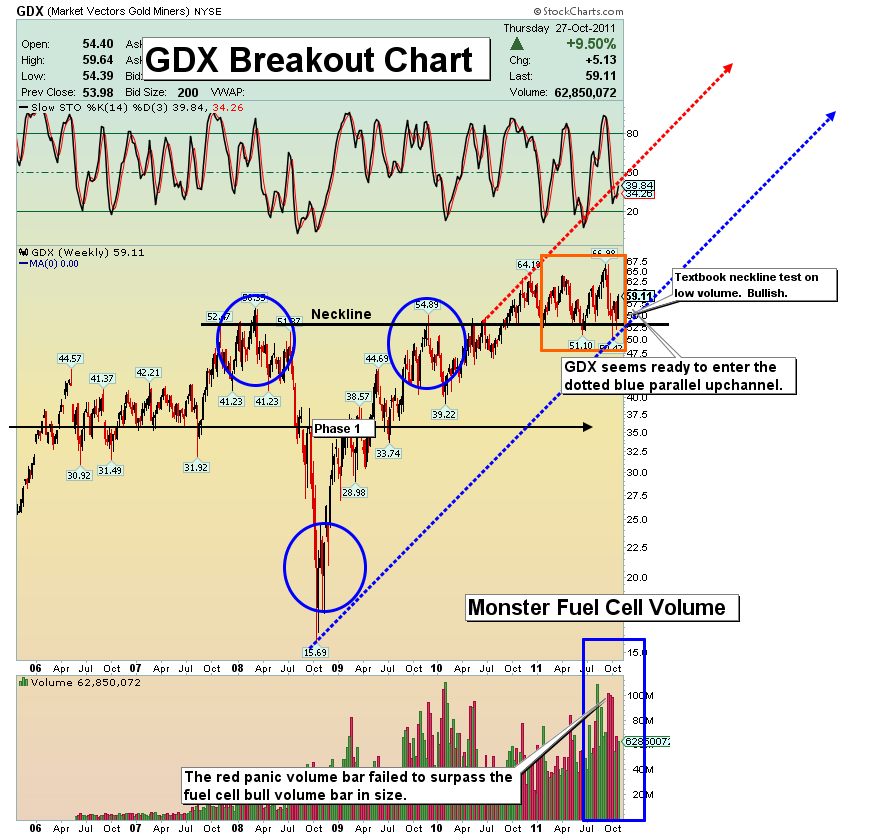
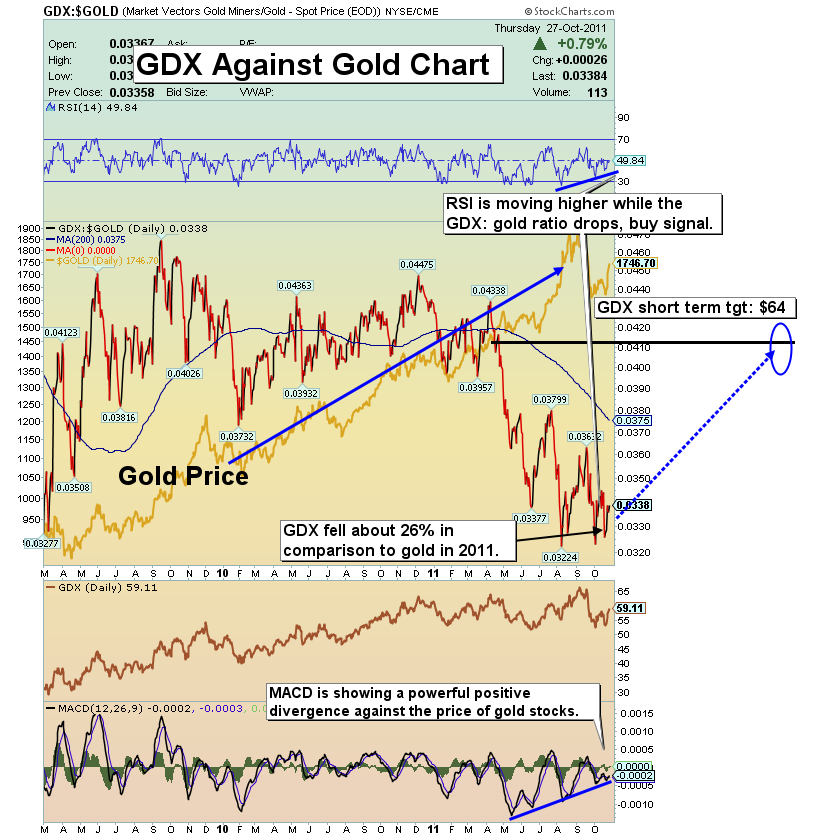
- Patience is required to win the prize in this volatile sector. The target for the above chart in short term is $64. I’m projecting $75 a share for GDX by year-end, and $95 based on the h&s pattern. My longer term target (about 18-24 months) is $133.
- This is the type of price rise that can put the gold community back in the financial driver’s seat! It’s been many years for a lot of you, many years of putting your faith in precious metals equities. If GDX rises to my projected targets, I think many stocks that have been underwater for years could blast into the financial sunlight!
GDX Against Gold Bullion Chart
- This chart is quite dramatic. It is visual picture showing how undervalued gold stocks are in comparison to gold. The first target for GDX is the $64 area. From there to get GDX to the targets mentioned above, it will require gold to push to new highs in the $2000 area, which I am projecting will occur by January of 2012.
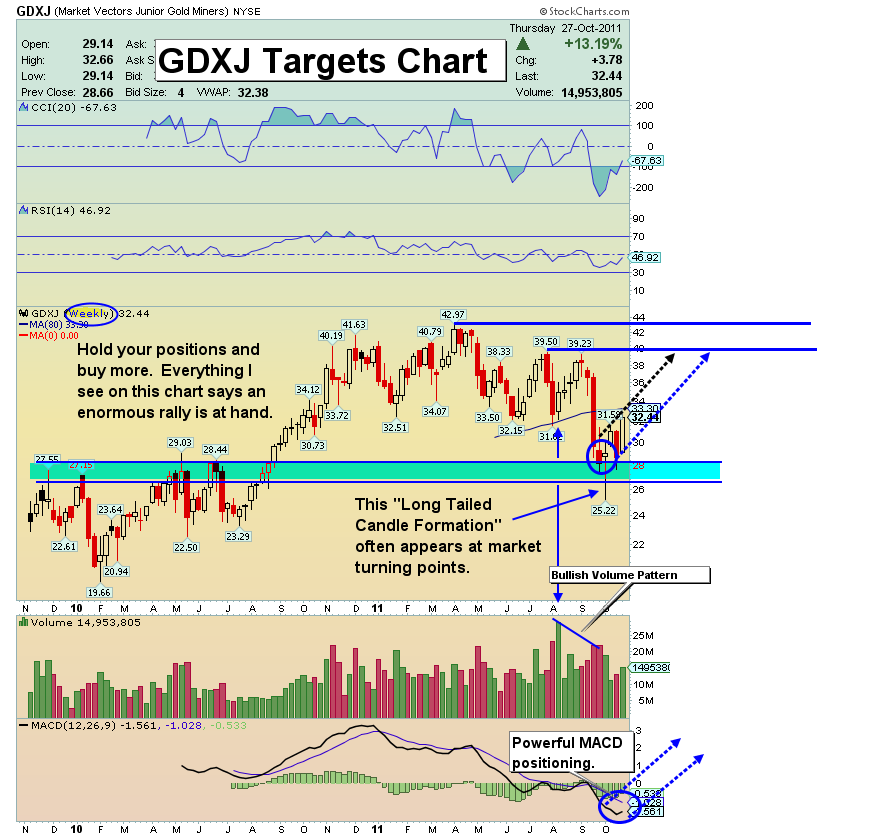
GDXJ Targets Chart
- What volatility takes away, a disciplined buy/sell program will assist in getting back for you. The gold junior stocks are a sector in which it really does pay to buy weakness and sell strength to survive the volatility. Note the blue horizontal target area lines on the chart. Achieving both of those should put some zip back into your portfolio, and I’m very sure it’s going to happen!
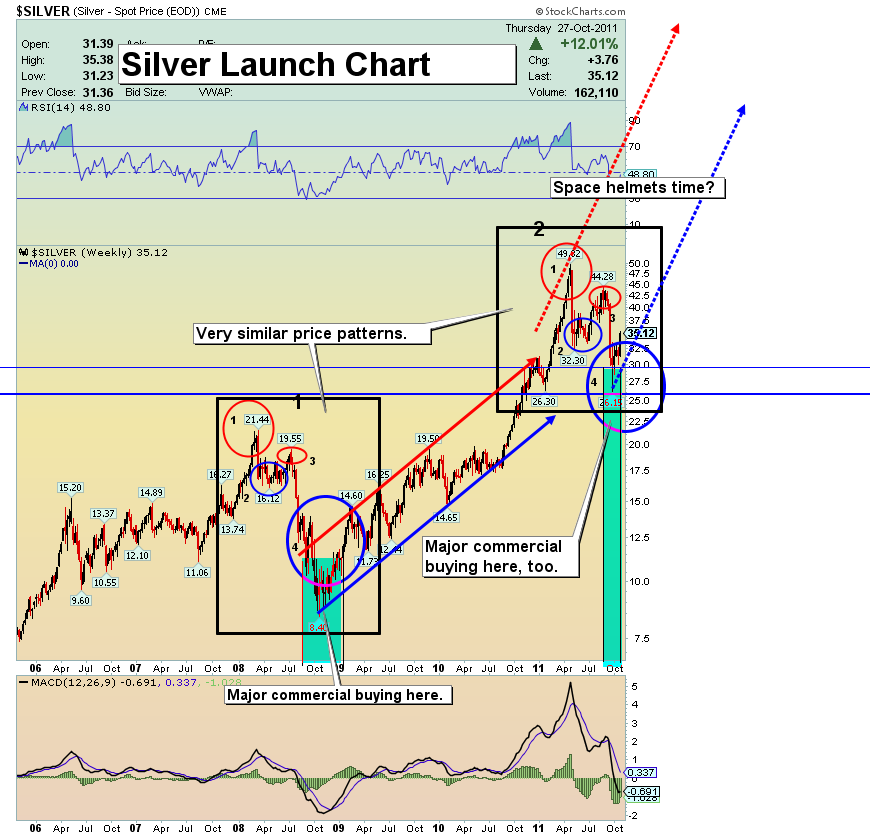
Silver COT Report Chart
- Silver remains one of my favorite assets. I expect silver to trade with gold in the shorter term, followed by a “command performance”, similar to what we saw in the spring of this year. Technical patterns, sentiment, and smart money buyers indicate that silver could possibly be the best investment opportunity available to investors for many years to come!
Friday, Jul 3, 2026 Super Force Signals Unique Introduction For 321Gold Readers:
Send me an email to admin@supergoldsignals.com and I’ll send you my free “Inflation Thunder Now!” gold and silver stocks video report. I’ll also include 3 of my next Super Force Surge Signals free of charge, as I send them to paid subscribers. Thank you!
|
Stay alert for our Super Gold alerts, sent by email to subscribers,
for both the daily charts on Super Force Signals at www.supergoldsignals.com and for the 60 minute
charts at www.supergoldsignals.com
About Super
Gold Signals:
Our Surge Gold Signals are created thru our proprietary blend
of the highest quality technical analysis and many years of successful
business building. We are two business owners with excellent synergy.
We understand risk and reward. Our subscribers are generally successfully
business owners, people like yourself with speculative funds,
looking for serious management of your risk and reward in the
market.
Frank Johnson:
Executive Editor, Macro Risk Manager.
Morris Hubbartt: Chief Market Analyst, Trading Risk Specialist.
website: www.supergoldsignals.com
email:
admin@supergoldsignals.com
email: admin@supergold60.com
Mail:
1276 Lakeview Drive
Oakville, Ontario, L6H 2M8
Canada
###
Oct 28, 2011
Morris Hubbartt
321gold
Ltd

|
