Super Force Signals - A Leading
Market Timing Service
We Take Every Trade Ourselves
$USD Lost At Sea
Morris Hubbartt
Weekly Market Update Excerpt
posted Oct 26, 2012
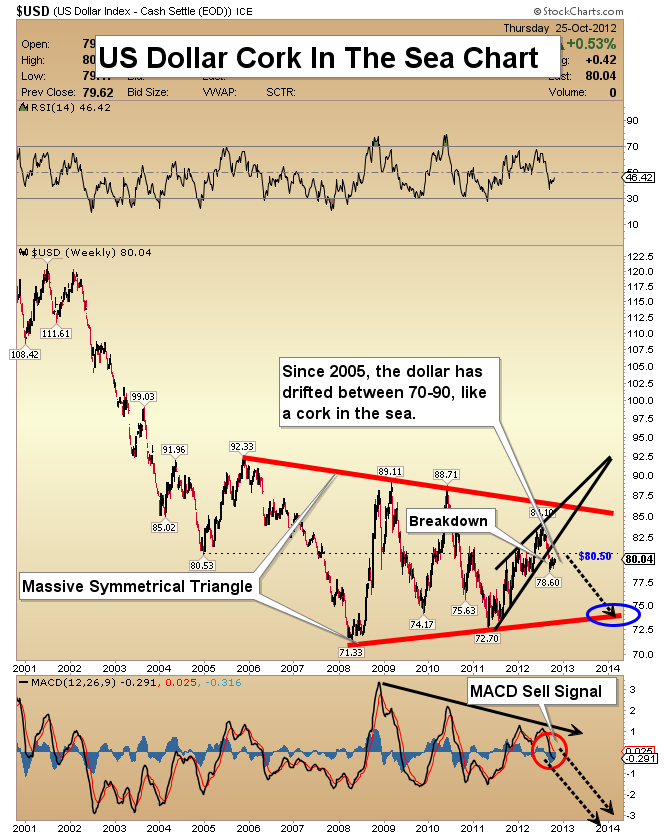
US Dollar Cork In The Sea Chart
- For several weeks, my US dollar analysis has been focused on daily charts. The dollar's current countertrend move has not taken the price above 80.50. I think the rally is ending here, and a new decline is about to begin.
- My focus today is on the larger picture portrayed on the weekly chart. Here, 80.50 is also a key level.
- Since 2005, the dollar has meandered aimlessly between about 70-90, creating the appearance of a cork lost at sea. Now, a substantial breakdown seems to be occurring.
- Oscillators are continuing to “head south”, intensifying the long-term downtrend in the world’s reserve currency.
- In particular, please note the action of MACD, which is producing a fresh sell signal. Each high point attained by MACD is lower than the previous one.
- The chart is covered with technical non-confirmations, suggesting the dollar may be ready to tumble.
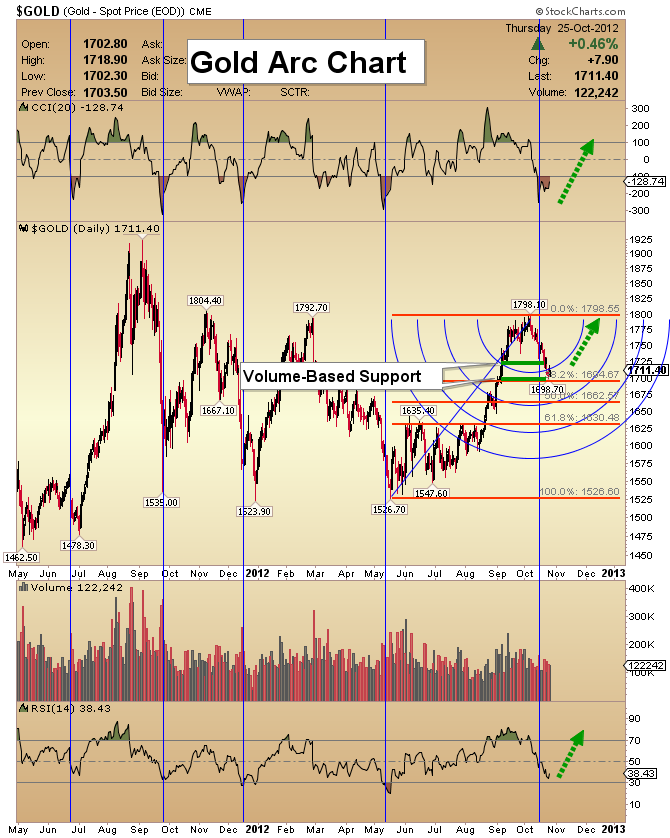
Gold Arc Chart
- My gold targets are $1850, and then $2015. Volume-based support sits near $1721 and $1703. I bought near both price points.
- There is more support around $1690. Note the Fibonacci 38.2% retracement line. It sits at about $1694 (the 2nd red line from the top). A decline to this important level could see strong buying of physical gold.
- The recent CCI spike down is indicative that sellers are exhausted. This key indicator is moving higher, while gold declines. It’s a classic non-confirmation, and good news for the bulls!
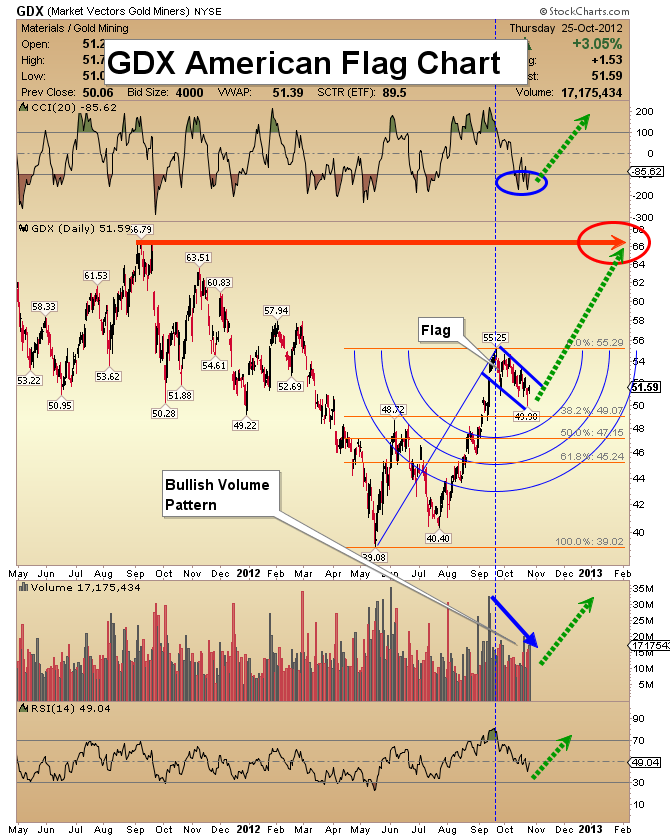
GDX American Flag Chart
- The corrective price action in GDX is moderate and constructive. As GDX peaked near $55, my initial projection was for a decline to the $47.50 area.
- More pullbacks occurred in the shares this week, yet GDX is not even close to my original downside target.
- This GDX chart paints a clear picture of resiliency. While gold bullion did decline to my inner Fibonacci arc target, GDX is still quite a distance away from its inner arc.
- Gold stocks are poised to dramatically outperform bullion.
- Another outstanding feature on the current GDX chart is the bull flag pattern. The flagpole was created by strong volume, which is very bullish.
- Volume has faded nicely within the flag itself, and a breakout appears to be imminent. My target is $66, where I suggest you book solid profits.
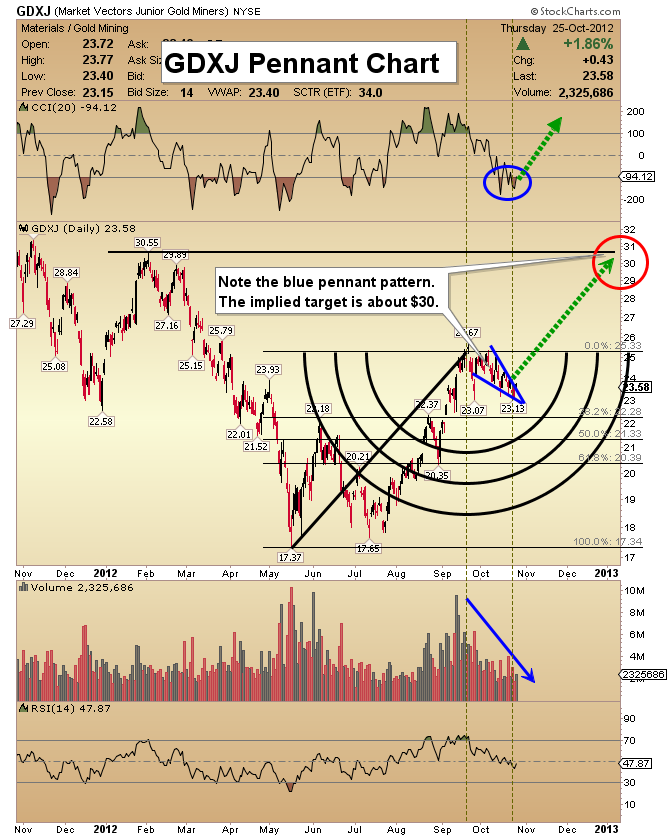
GDXJ Pennant Chart
- When compared to gold & silver, GDXJ is displaying strong performance. In previous years, the physical metals did better than the mining companies. This is a welcome change, and I think it’s one that is here to stay.
- Look at the Fibonacci arc on this GDXJ chart. Unlike gold and silver bullion, GDXJ is not even close to its inner arc. The strong performance of junior stocks in this corrective phase, is evidence that when the bull trend resumes, they will continue to lead.
- There is an important pennant formation on this GDXJ chart. This pattern indicates that the current period of consolidation could be followed by a very strong move to the upside.
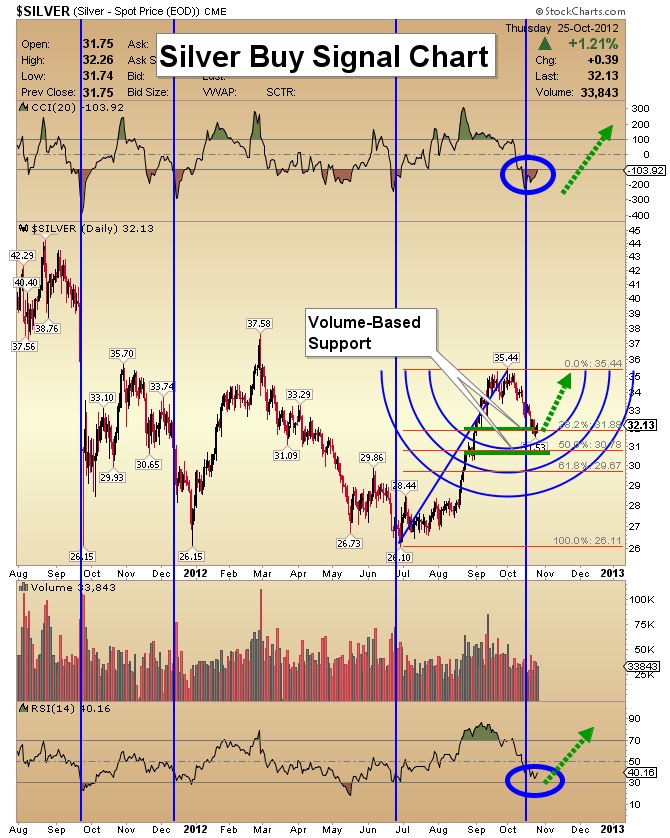
Silver Buy Signal Chart
- Nobody enjoys unexpected volatility in the price of their favorite asset, but a real opportunity now exists in silver.
- Based on my price and volume support studies, silver is approaching solid support in the $31 area.
- The RSI oscillator is also near a key turning point. I am projecting that it should reach its maximum oversold reading as silver touches $31.
- I will be buying physical silver near that $31 price. Silver fans should consider buying there, too!
Friday, Jul 3, 2026 Super Force Signals Unique Introduction For 321Gold Readers:
Send me an email to admin@supergoldsignals.com and I’ll send you my free “Inflation Thunder Now!” gold and silver stocks video report. I’ll also include 3 of my next Super Force Surge Signals free of charge, as I send them to paid subscribers. Thank you!
|
Stay alert for our Super Gold alerts, sent by email to subscribers,
for both the daily charts on Super Force Signals at www.supergoldsignals.com and for the 60 minute
charts at www.supergoldsignals.com
About Super
Gold Signals:
Our Surge Gold Signals are created thru our proprietary blend
of the highest quality technical analysis and many years of successful
business building. We are two business owners with excellent synergy.
We understand risk and reward. Our subscribers are generally successfully
business owners, people like yourself with speculative funds,
looking for serious management of your risk and reward in the
market.
Frank Johnson:
Executive Editor, Macro Risk Manager.
Morris Hubbartt: Chief Market Analyst, Trading Risk Specialist.
website: www.supergoldsignals.com
email:
admin@supergoldsignals.com
email: admin@supergold60.com
Mail:
1276 Lakeview Drive
Oakville, Ontario, L6H 2M8
Canada
###
Oct 26, 2012
Morris Hubbartt
321gold
Ltd

|
