Super Force Signals - A Leading
Market Timing Service
We Take Every Trade Ourselves
I Spy, With My Little Gold Eye: $2200-$2400
Morris Hubbartt
Weekly Market Update Excerpt
posted Oct 14, 2011
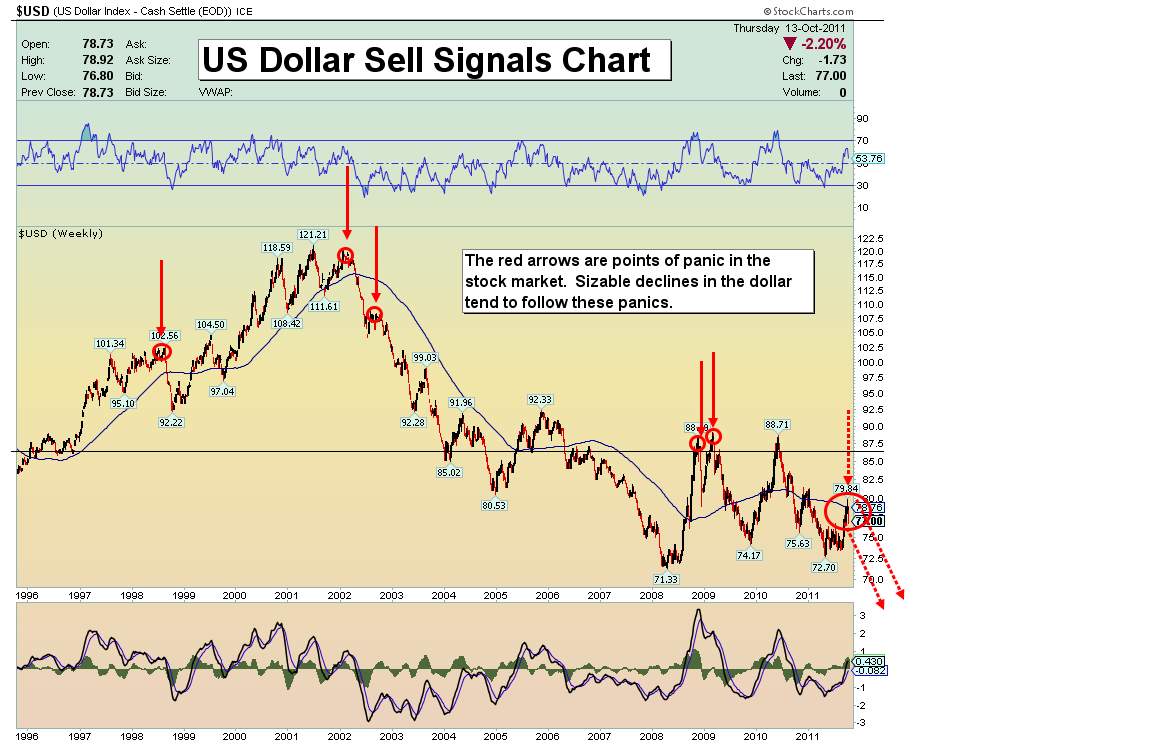
US Dollar Sell Signals Chart
Dollar Commentary
- The recent stock market panic is one of the most significant events in the last few months. Note the arrows on the above chart that highlight previous panics.
- When stock investors flee the stock market, they tend to run to dollar-based money funds. Historically, the dollar has tended to fall hard soon after these panics occur.
- Europe is beginning to print euros like the US prints the dollars. Global currency debasement is leading all roads to gold.
- Technically, the dollar is likely completing its topping process, while the gold market is concluding its corrective process. The dollar could chop in the current area for a bit longer, before beginning a significant new leg down.
- My technical work suggests the rally in the dollar and the correction in gold could both end within about ten days. From there, look for a major offensive gold move that should see the price reach $2200-2400.
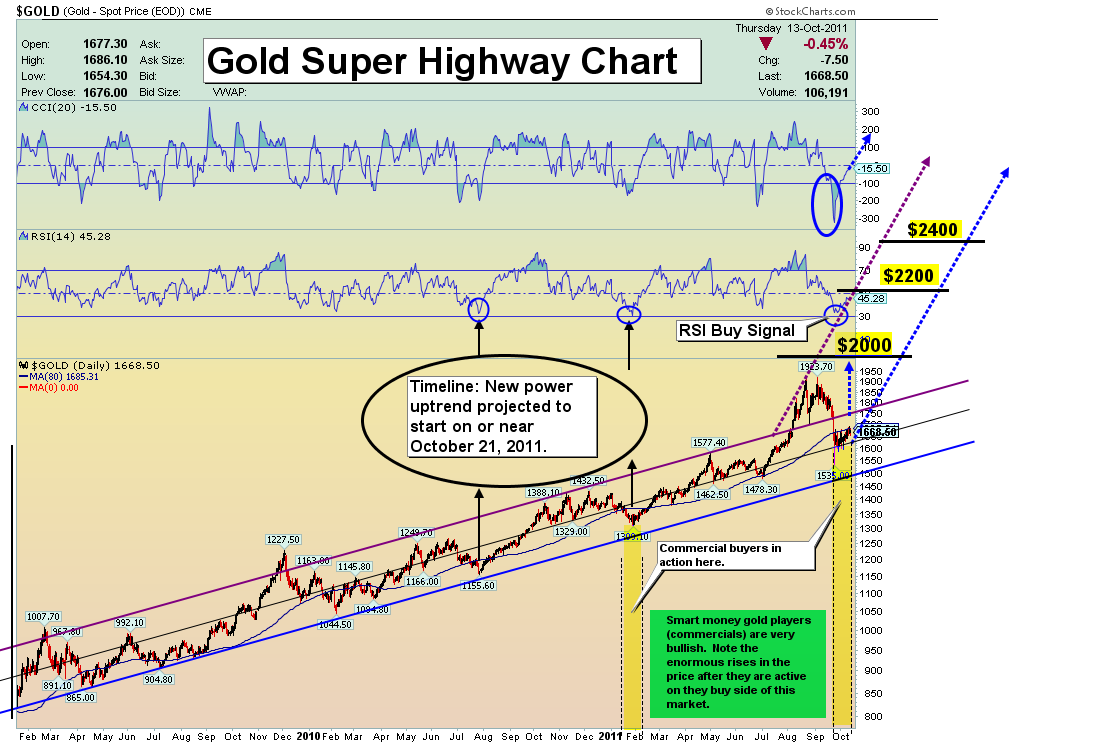
Gold Super Highway Chart
Gold Analysis
- Identifying the fundamentals in a market is what gives investors courage to own gold for the long term, and buy it at prices of excellent value. I have defined three pillars in the gold market that support price moving to the upside from here.
- Pillar 1. More worldwide physical buyers are coming to the market. I’ve talked about the great gold awakening; more and more evidence suggests it is happening. These are not just Asian buyers. Investors from Europe and America are taking action, because currency debasement feels like it is on steroids. Metals dealers, including mine, are reporting difficulty in meeting demand without delays, despite the big price correction.
- Pillar 2. Far East buyers are supportive. The Eastern nations have always viewed gold as currency. What is partially new about this group is the growing wealth inside the middle class. As they increase their wealth, they are increasing their metal holdings.
- Pillar 3. Print, Print, Print. Recent headlines concerning Greece suggest there are not enough spending cuts, and in the longer term Greece may be viewed as a proxy for most Western nations. Debts are beyond payment and governments cannot seem to stop spending wildly, now or in the future.
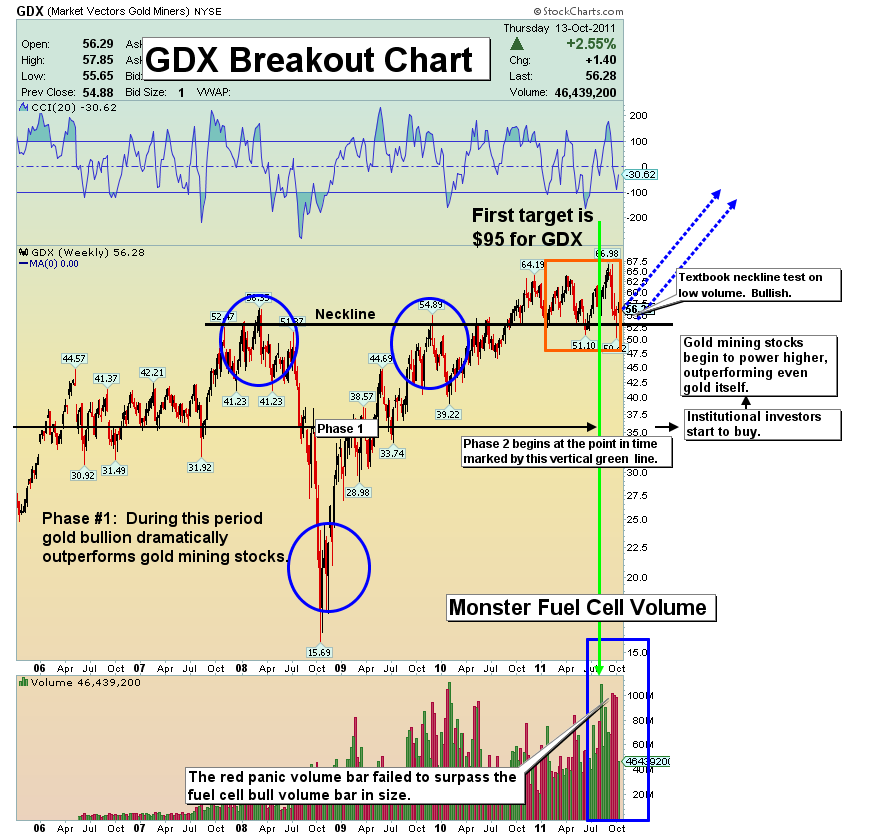
GDX Breakout Of the Decade Chart
- The superhighway gold chart highlights smart money (commercial traders) buying. This powerful buying should be the catalyst that will launch gold stocks higher. I believe that phase 2 of the bull market in gold has started. The blast to $1920, followed by the current vicious correction, is just the opening act of the show.
- The market psychology I’ve recently highlighted in the COT report has a huge impact on gold stocks as well. A key feature in play is the reduction of speculators in the gold market due to what I’ve called “the correction of terror” in gold and gold stocks.
- This is a kind of cleansing; speculators sell their positions and get out of the market. Then the market becomes quiet (note the current low volume rally) as the hot money players are burnt out, and smart investors take these discounted positions.
- I’ve suggested you should buy this GDX correction. My latest buy signal was issued at $52.90. On Wednesday, I issued a profit taking alert at $57.44, capturing an 8.56% gain on trading positions. In the very short term don’t be alarmed by a quick pullback to $55 or so.
- Speculators are generally quite afraid now. Once the market starts moving, they should re-emerge on the buy side. The time line for the end of the gold stocks correction should be within the next 10 days, in line with what I am projecting for bullion.
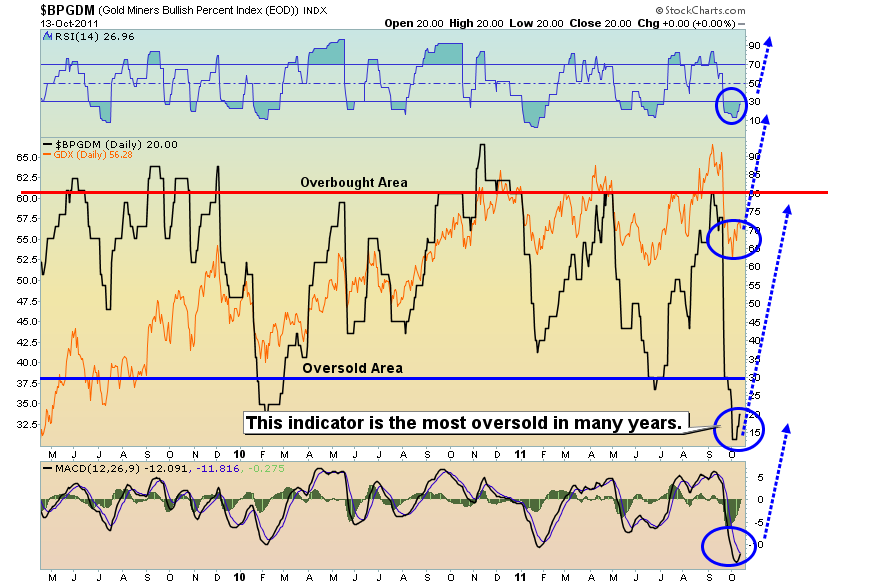
GDX Extremely Oversold Chart
- The above chart is an intermediate term measurement of overbought and oversold readings on gold senior stocks, via GDX. The oversold condition indicated was surpassed only during the lows of 2008.
- My 24 month target for GDX is $150.
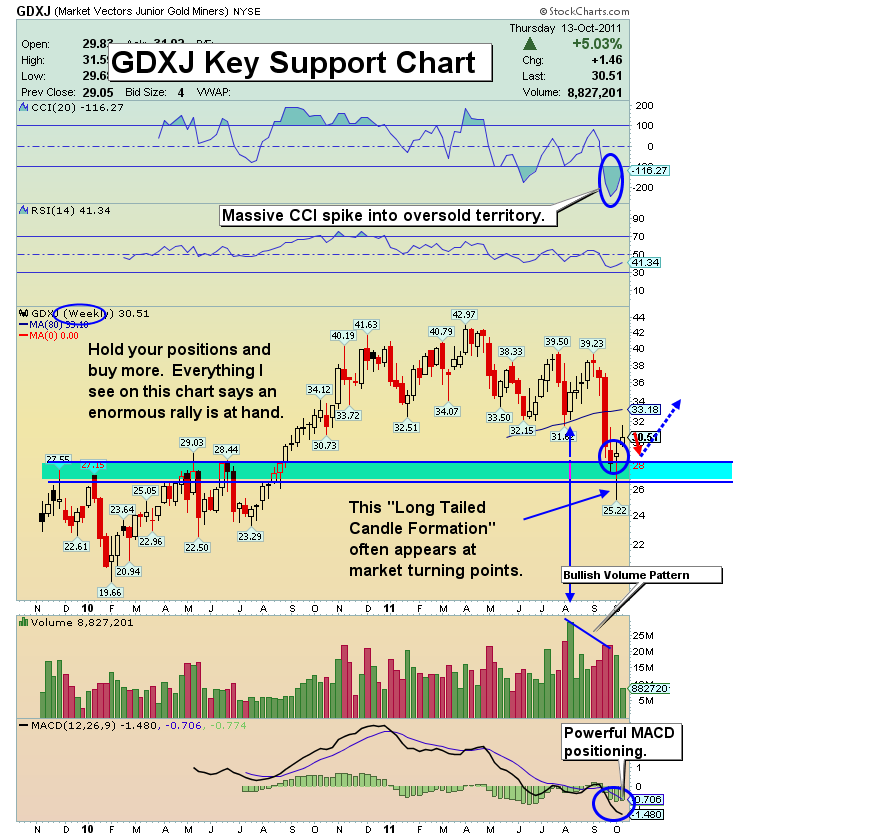
GDXJ (Gold Juniors Proxy) Support Chart
- Gold juniors bounced smartly off key weekly support recently. Note the volume on my weekly chart. The gains in juniors should be breath taking from this level, for many years to come.
- That’s the perspective to hold onto during a correction. Again, as I have mentioned throughout this report, we could see a quick pullback in the next few days, likely to the $28.25 area. Don’t let that pull you out of your positions.
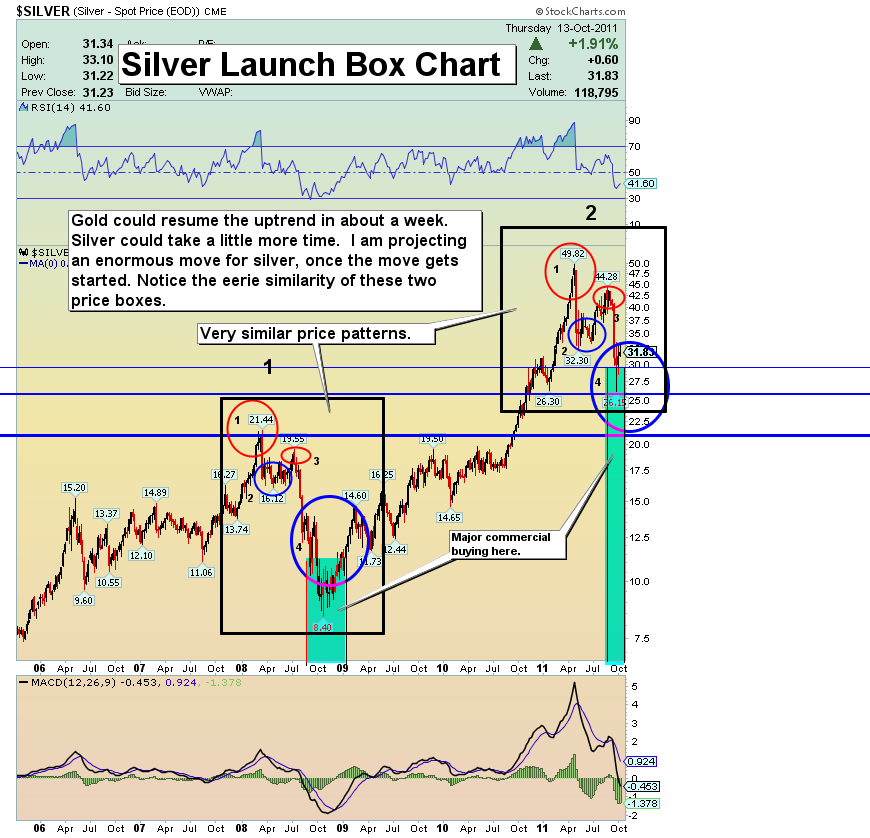
Silver Launch Box Chart
- Last week I dedicated part of the update to the COT reports. A week later this data remains in uncharted territory. The investors with weak hands have given up their positions, only to have them scooped up by the most value-oriented group of investors, the commercial traders.
- Note the eerily similar patterns highlighted on the above chart. I believe you are viewing a very similar bottoming process to that which occurred in 2008. Many are fearful of a price decline, but now is a time to be prepared to buy any additional weakness. Most importantly, be prepared to hold your core positions for a longer term move, one that could see silver go several hundred percent higher over the two to three years.
Friday, Jul 10, 2026 Super Force Signals Unique Introduction For 321Gold Readers:
Send me an email to admin@supergoldsignals.com and I’ll send you my free “Inflation Thunder Now!” gold and silver stocks video report. I’ll also include 3 of my next Super Force Surge Signals free of charge, as I send them to paid subscribers. Thank you!
|
Stay alert for our Super Gold alerts, sent by email to subscribers,
for both the daily charts on Super Force Signals at www.supergoldsignals.com and for the 60 minute
charts at www.supergoldsignals.com
About Super
Gold Signals:
Our Surge Gold Signals are created thru our proprietary blend
of the highest quality technical analysis and many years of successful
business building. We are two business owners with excellent synergy.
We understand risk and reward. Our subscribers are generally successfully
business owners, people like yourself with speculative funds,
looking for serious management of your risk and reward in the
market.
Frank Johnson:
Executive Editor, Macro Risk Manager.
Morris Hubbartt: Chief Market Analyst, Trading Risk Specialist.
website: www.supergoldsignals.com
email:
admin@supergoldsignals.com
email: admin@supergold60.com
Mail:
1276 Lakeview Drive
Oakville, Ontario, L6H 2M8
Canada
###
Oct 14, 2011
Morris Hubbartt
321gold
Ltd

|
