Super Force Signals - A Leading
Market Timing Service
We Take Every Trade Ourselves
The Smart Money Charts
Morris Hubbartt
Weekly Market Update Excerpt
posted Oct 7, 2011
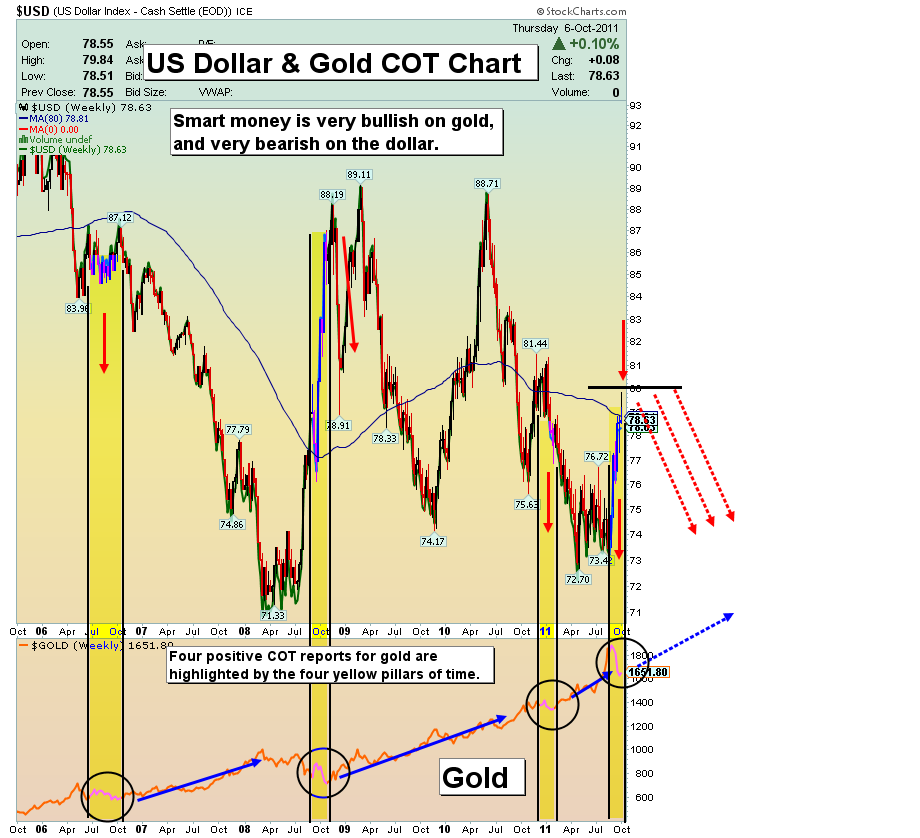
US Dollar Vs Gold COT Chart
Analysis
- Looking at the past three years of history, I believe the most recent COT reports were some of the most bullish issued for gold, and bearish for the dollar. Throughout this update I will focus on what this report likely means for gold over the next several months. We are in a correction, and phase two of this powerful bull market is underway.
- The economic slowdown predicted here by “Dr. Copper” two weeks ago is being felt around the world. Federal Reserve Chairman Ben Bernanke said Tuesday that the economic recovery is close to faltering, and prepared to take further steps to support it. These steps will probably end the dollar rally.
- This week’s key COT report data essentially predicts that a dollar decline will begin in the coming days or weeks. Smart commercial money short to long ratios are extremely bullish for gold, which is an action that historically pressures the dollar lower.
- The above dollar chart shows extremely favorable periods for gold that were predicted by COT report data, going back to 2006. My shorter timeline work continues to point to a peak in the dollar over the next several weeks, followed by a substantial decline, with 65 as the next big target on the $USD chart.
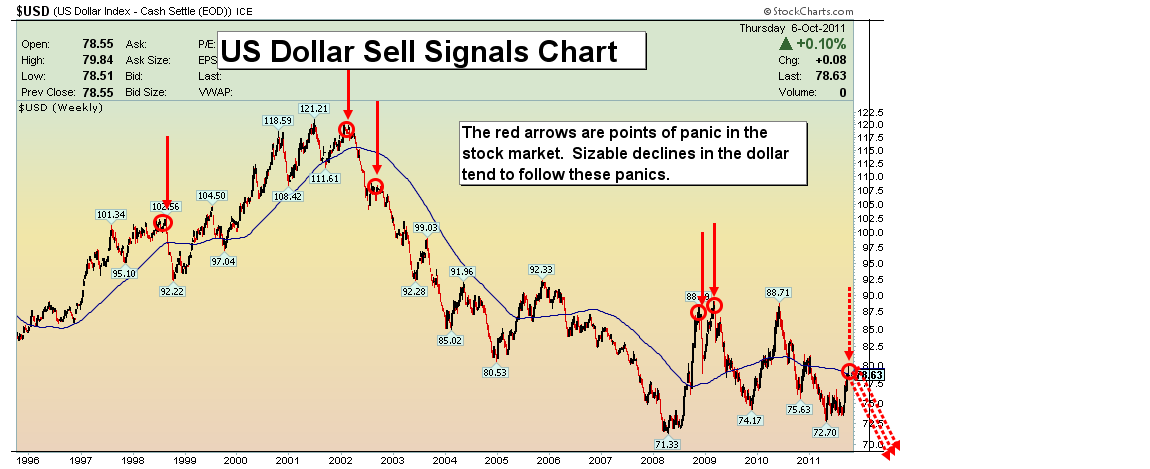
US Dollar Sell Signals Chart
- On the above chart the black arrows indicate stock market panic using data from Rydex fund flows. As money pours out of equities, it flows to the dollar. Historically this type of panic is a dollar sell signal.
- You’ve heard a lot about the big rally in the dollar. Look at this long term chart. This is the “big rally”? Compare the dollar chart to the gold chart. Gold is now in a modest correction, after a huge move higher. Bullish public opinion towards the US dollar almost hit a 3-year high as of Wednesday’s close. I believe that’s another major sell signal for the dollar.
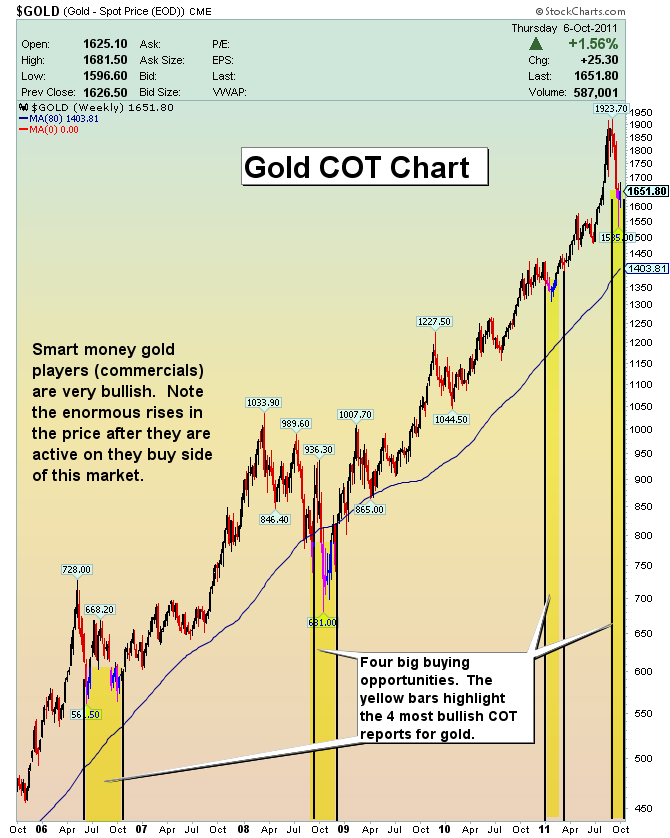
Gold COT Report Chart
Analysis
- Gold is the crown jewel of all assets. As we have entered a healthy corrective period in gold, this is the time to fully understand the fundamentals of what you own, and why you own it.
- When the commercial buyers come in, it’s not a pinpoint place to drop huge amounts of investment money, but instead offers an area to employ capital. The force of the move once these buyers step in tends to be very powerful. Following these reports, the gold price often moves well over 100% to the upside.
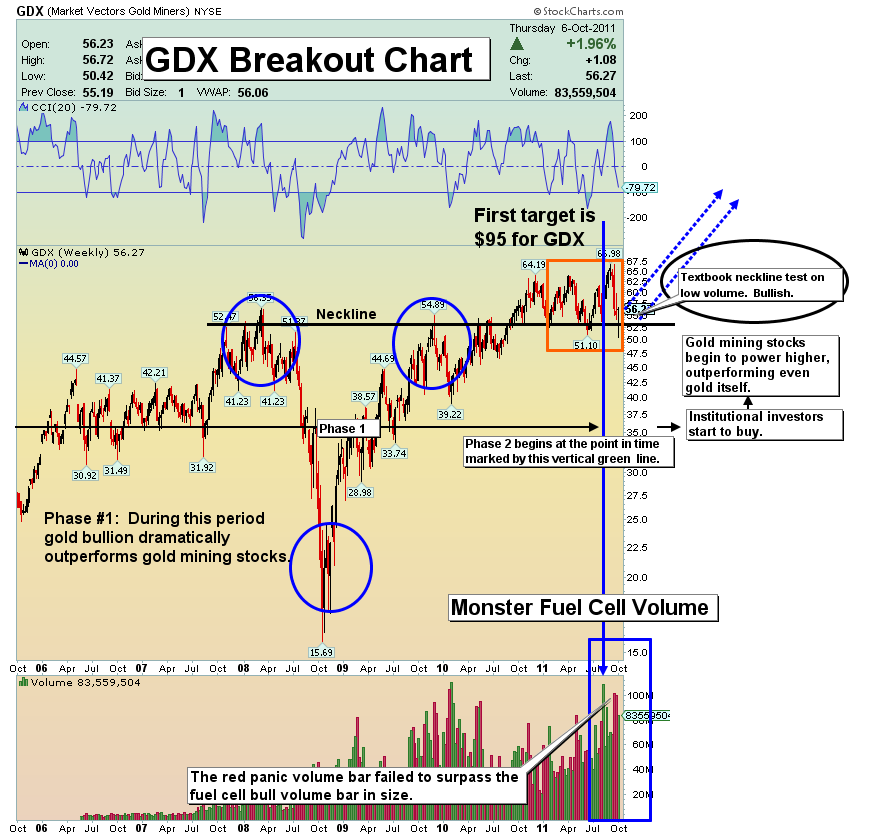
GDX Breakout Chart
- My technical indicators show we have likely entered phase two of the gold bull market. The end of the current correction could see new leadership in the next leg up. Gold stocks have been hammered, but even before the correction they were substantially undervalued. P/E ratios on some senior gold stocks have now dropped to well under 15, which is very solid value. As a group, gold stocks have already shown explosive upside action this week, far outperforming the price of bullion.
- The price of GDX came back to test the neckline of the weekly h&s pattern this week. This has been a scary correction, and while one small symmetrical triangle has failed, absolutely no damage has been done to the h&s pattern. Overall, GDX is demonstrating very healthy bull market action.
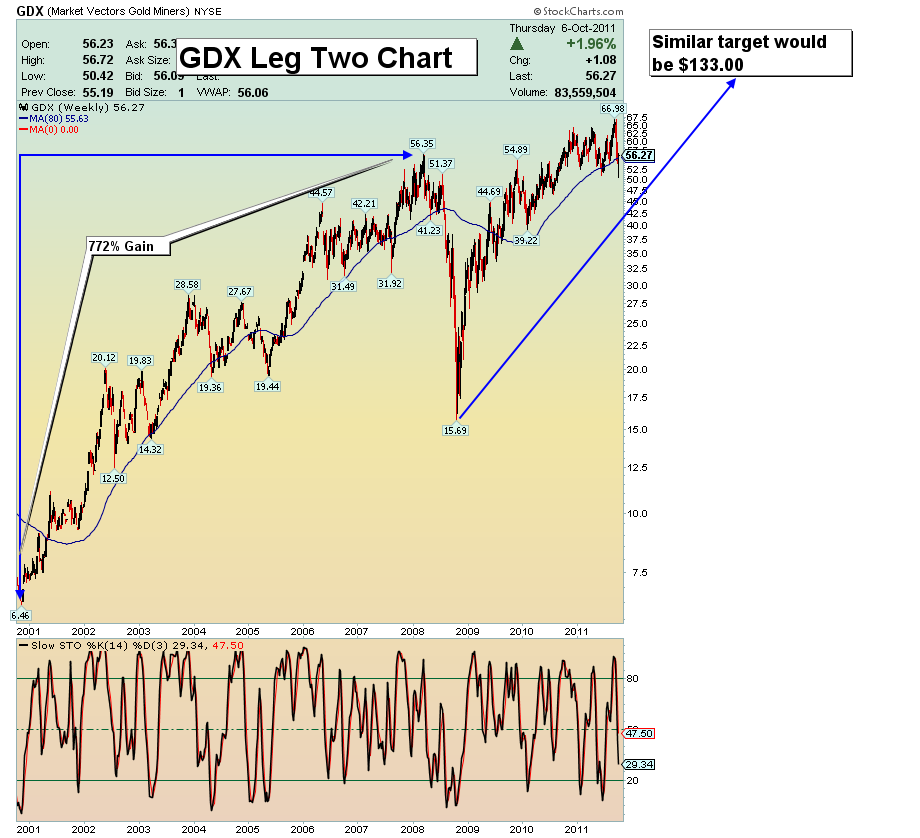
GDX Leg Two Chart
- Keep your long term expectations in perspective. The bull market from 2001 to 2008 had many corrections in excess of 35%, and all were followed by bigger moves to higher highs. Don’t jettison big chunks of your positions just because somebody says a correction is coming.
- Don’t lose focus on the long term picture that is projected by this enormous head and shoulders pattern, and by the COT reports. I expect a leadership role by the gold seniors into the next rally, and this rally is likely to be of record size.
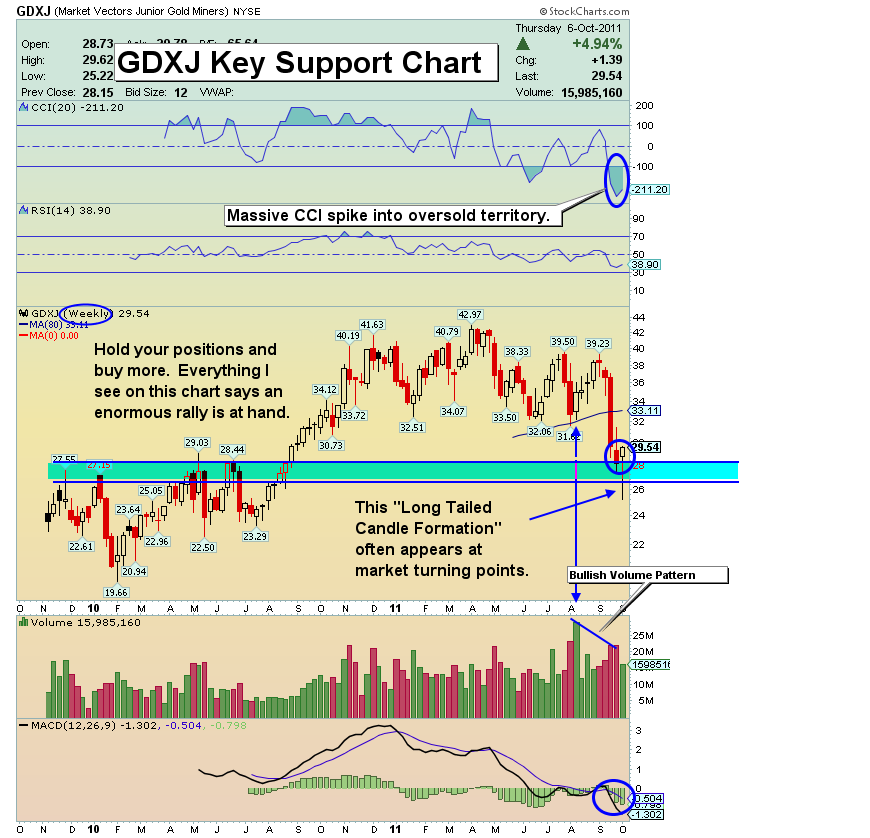
GDXJ Key Support Chart
- The juniors sector has been the hardest hit, and that has driven down account values very hard in the gold community, because most of you hold a lot of juniors stock. I issued my latest buy in the midst of the firestorm on Tuesday, at $26.04. GDXJ has impressive volume, and sits at major support on the weekly chart. Hang tough!
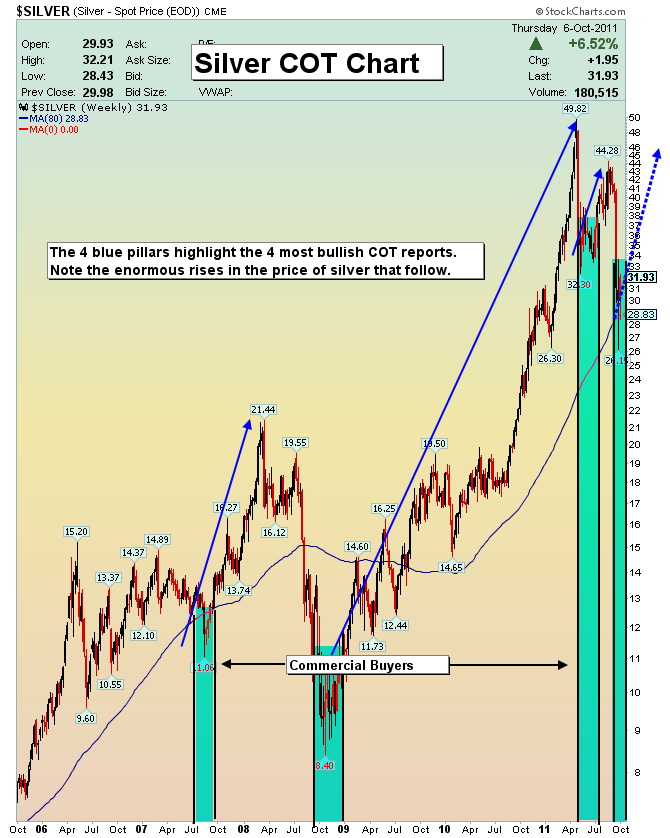
Silver COT Report Chart
- The smart money buyers tend to step up with buys and short covering of size in the silver market about once every eighteen months. This is one reason why I have purchased additional silver bullion over the past week. I would advise you to do the same. Many times the price then moves several hundred percent in a very short period of time. Hi ho, silver!
Friday, Jul 17, 2026 Super Force Signals Unique Introduction For 321Gold Readers:
Send me an email to admin@supergoldsignals.com and I’ll send you my free “Inflation Thunder Now!” gold and silver stocks video report. I’ll also include 3 of my next Super Force Surge Signals free of charge, as I send them to paid subscribers. Thank you!
|
Stay alert for our Super Gold alerts, sent by email to subscribers,
for both the daily charts on Super Force Signals at www.supergoldsignals.com and for the 60 minute
charts at www.supergoldsignals.com
About Super
Gold Signals:
Our Surge Gold Signals are created thru our proprietary blend
of the highest quality technical analysis and many years of successful
business building. We are two business owners with excellent synergy.
We understand risk and reward. Our subscribers are generally successfully
business owners, people like yourself with speculative funds,
looking for serious management of your risk and reward in the
market.
Frank Johnson:
Executive Editor, Macro Risk Manager.
Morris Hubbartt: Chief Market Analyst, Trading Risk Specialist.
website: www.supergoldsignals.com
email:
admin@supergoldsignals.com
email: admin@supergold60.com
Mail:
1276 Lakeview Drive
Oakville, Ontario, L6H 2M8
Canada
###
Oct 7, 2011
Morris Hubbartt
321gold
Ltd

|
