Super Force Signals - A Leading
Market Timing Service
We Take Every Trade Ourselves
Gold Time Box, Dollar Time Bomb
Morris Hubbartt
Weekly Market Update Excerpt
posted Oct 5, 2012
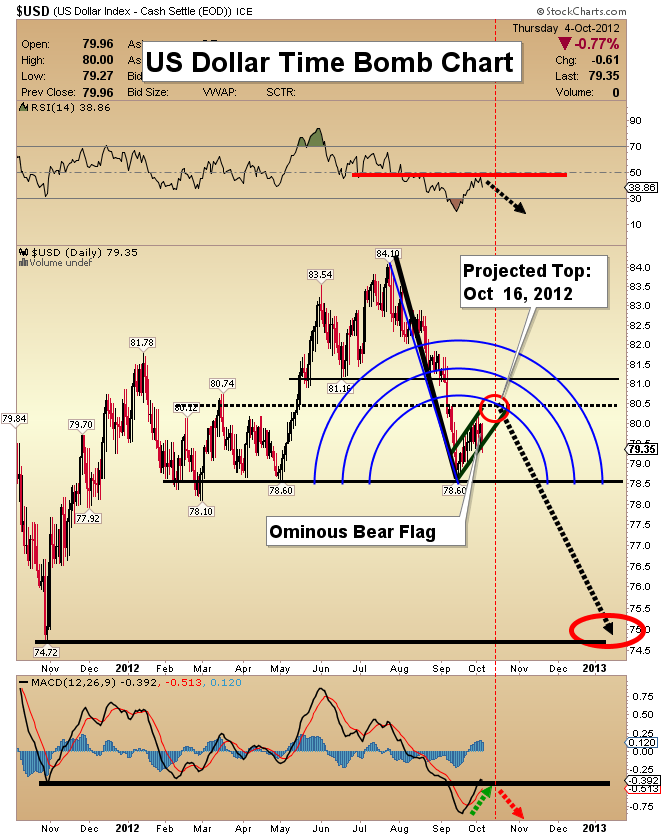
US Dollar Time Bomb Chart
- The dollar’s legs are being cut out from under it, by the Federal Reserve and the US government. QE, by design, is set to reduce the dollar’s value.
- Part one of the bear market rally in the USD is completed. I expect the dollar to have difficulty moving much higher than 80.50. Last Friday marked the end of the month, and the quarter, but the dollar could not close above this key price point.
- My timeframe (time bomb) analysis suggests that sometime around Oct 16th, you will see the highlighted bear flag top activate, and the dollar will begin a severe decline. My downside target is 74.72. A very strong move higher in precious metals should commence at the same time.
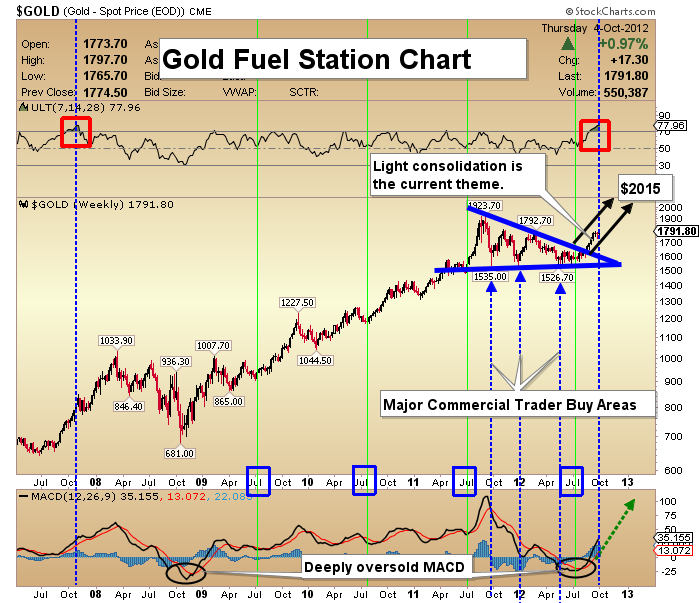
Gold Fuel Station Chart
- The breakout move from the large consolidation is now well underway. The red & black lines of the MACD indicator are widening, suggesting that the current sideways action is simply a pause in the bull move, rather than the start of a correction.
- Gold has stopped at a financial gas station for fuel. It’s not turning around or putting the transmission into reverse gear.
- I’m projecting this move higher will be a multi-year rally. Investors should reduce capital used for trading, and hold very large core positions.
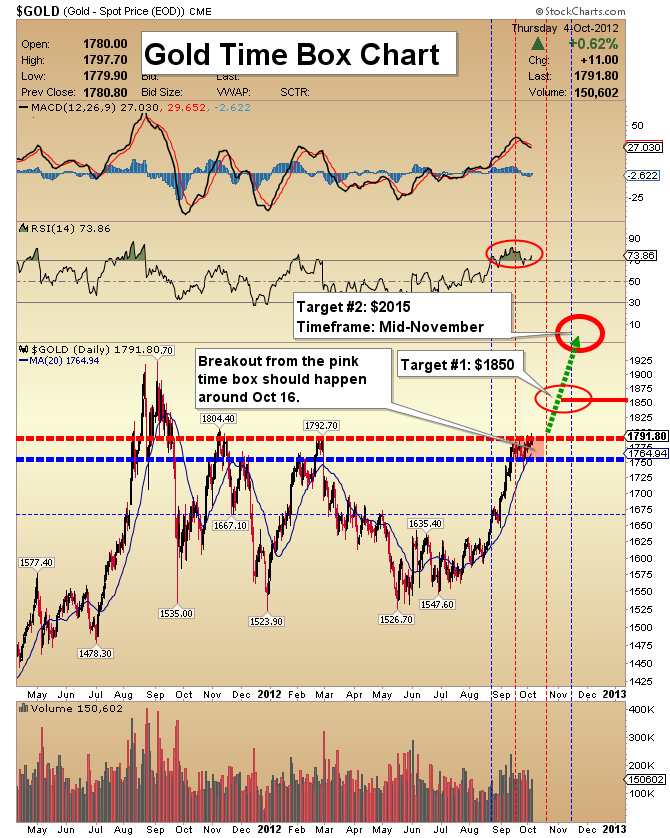
Gold Time Box Chart
- In the short term, my target is $1850. If gold moves lower at all, it should not decline by more than 5%. There’s no point in selling large positions to avoid such a small drawdown.
- My analysis suggests that the next strong leg in the gold rally will resume around Oct. 16th. Note the pink “box of time” that I’ve highlighted on the chart. From there, I’m projecting a powerful move to $2015, with a time target of mid-November.
- In my view, the correction that most investors are looking for now is more likely to occur from the highs reached in mid-November. I believe a gold price of $2300 will occur by March, 2013.
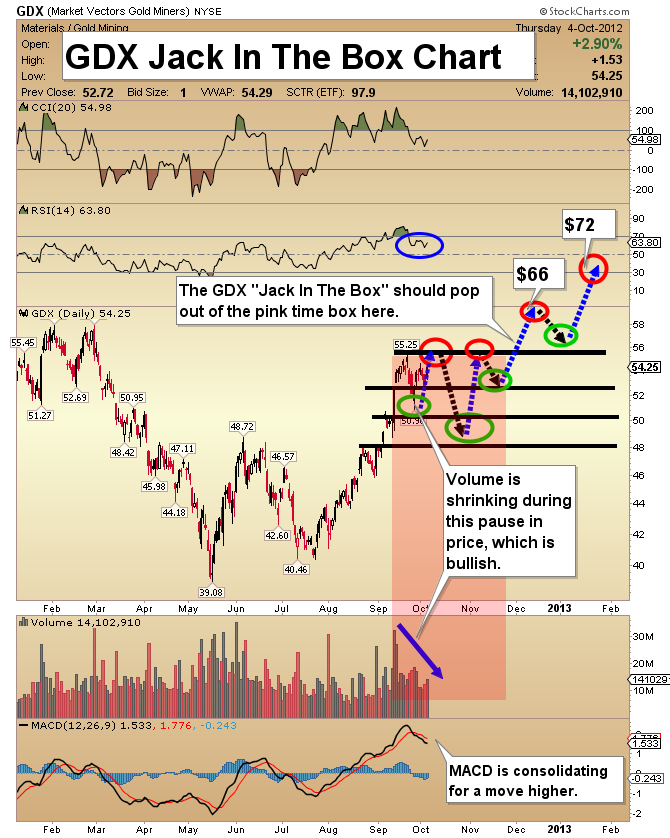
GDX Jack In The Box Chart
- The senior gold stocks have rallied about 41% and have not really pulled back at all. Like gold itself, the price rise has just paused. I have forecast a three week “digestion period” for gold stocks, which is nearing the halfway mark now.
- As I look at the trade in gold stocks, I am highly impressed with how soft the volume is. This is exactly what I want to see at this point in time. High volume in this scenario is called "churning", and it would be dangerous.
- This light volume is a great signal that strong hands are holding their positions. Amateur speculators are afraid. They are focused on the RSI indicator on the daily chart, and that’s a big mistake. Their fear is also contributing significantly to the soft volume. In my opinion, this market is preparing to advance much higher.
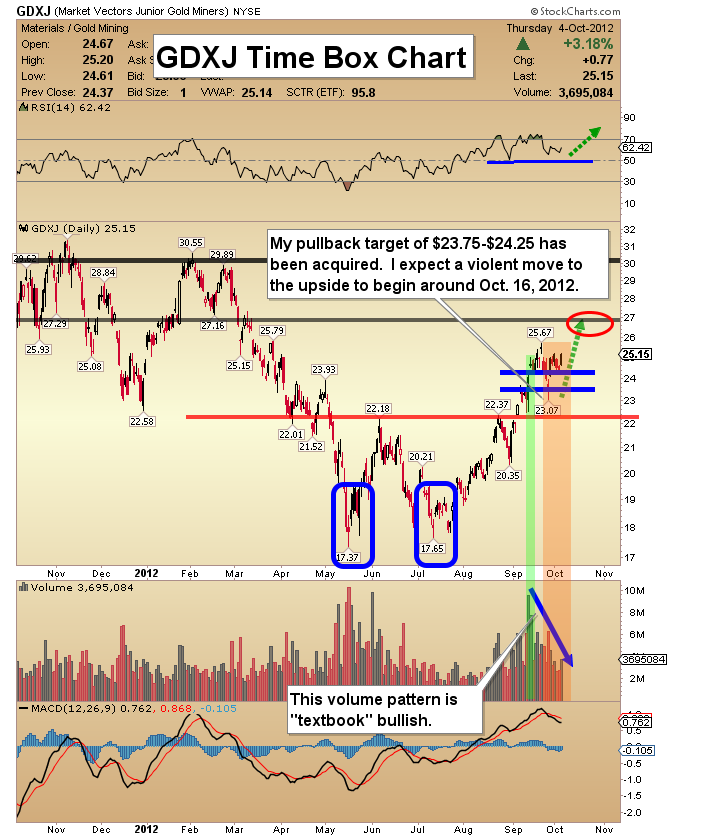
GDXJ Time Box Chart
- The price & volume action of the junior gold stocks is also indicating a lack of speculation. The reaction from traders has been textbook denial. They do not believe this rally can be sustained.
- GDXJ has rallied approximately 47% and pulled back to some of my reload targets. It then popped higher and paused. Volume is picture-perfect. I am projecting an explosive move to much higher prices.
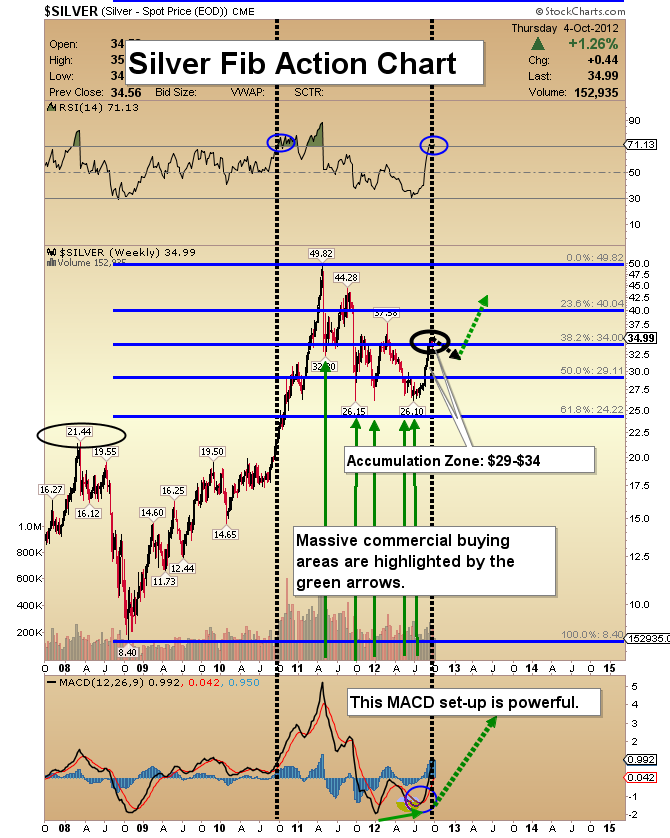
Silver Fib Action Chart
- Silver has rallied nicely, yet it is still 30% below the highs it reached about a year ago. This mighty metal is acting like a champion. It rallies strongly, and then simply pauses, rather than giving anything back to the shocked bears.
- If any price weakness does appear, I expect very strong buying by commercial traders to occur. My COT report analysis indicates the commercials will be heavy buyers, at levels just 5% below the current price. Once the current pause in the price advance is completed, I’m projecting that silver will quickly surge to $40!
Friday, Jul 3, 2026 Super Force Signals Unique Introduction For 321Gold Readers:
Send me an email to admin@supergoldsignals.com and I’ll send you my free “Inflation Thunder Now!” gold and silver stocks video report. I’ll also include 3 of my next Super Force Surge Signals free of charge, as I send them to paid subscribers. Thank you!
|
Stay alert for our Super Gold alerts, sent by email to subscribers,
for both the daily charts on Super Force Signals at www.supergoldsignals.com and for the 60 minute
charts at www.supergoldsignals.com
About Super
Gold Signals:
Our Surge Gold Signals are created thru our proprietary blend
of the highest quality technical analysis and many years of successful
business building. We are two business owners with excellent synergy.
We understand risk and reward. Our subscribers are generally successfully
business owners, people like yourself with speculative funds,
looking for serious management of your risk and reward in the
market.
Frank Johnson:
Executive Editor, Macro Risk Manager.
Morris Hubbartt: Chief Market Analyst, Trading Risk Specialist.
website: www.supergoldsignals.com
email:
admin@supergoldsignals.com
email: admin@supergold60.com
Mail:
1276 Lakeview Drive
Oakville, Ontario, L6H 2M8
Canada
###
Oct 5, 2012
Morris Hubbartt
321gold
Ltd

|
