Super Force Signals - A Leading
Market Timing Service
We Take Every Trade Ourselves
Gold is quickly becoming my personal currency
Morris Hubbartt
Weekly Market Update Excerpt
posted Sep 30, 2011
US Dollar Chart
Dollar Commentary
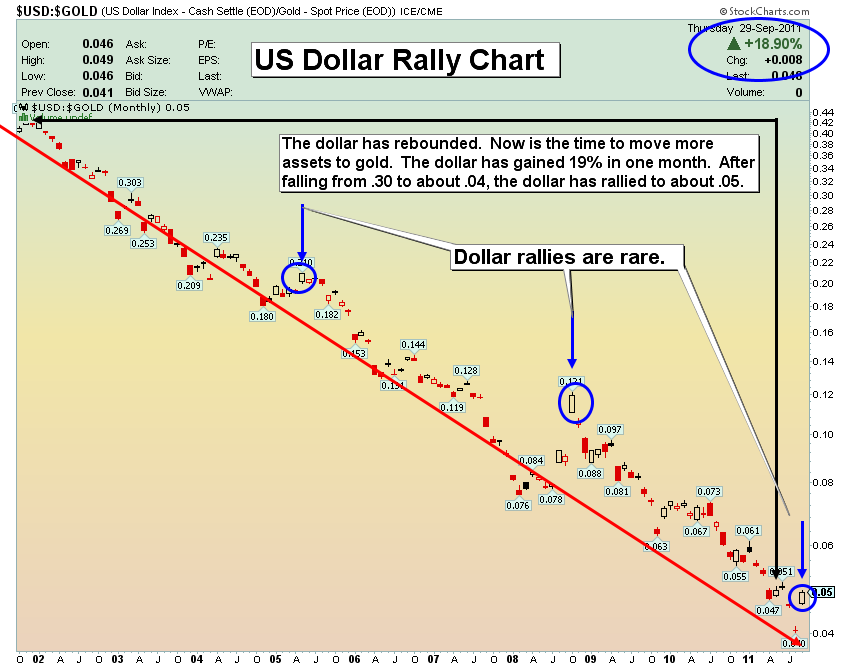
- Smart investing is about taking advantage of situations when they arise, and there are plenty of opportunities right now. On the above chart you can see that the dollar has gained 19% against gold in the last month, after falling horribly for many years. This dollar rally is effectively an invitation to increase your gold holdings, and it is what I have done this week. Gold is quickly becoming my personal currency.
- Debts have to be paid, whether in one form or another. Dollar debt can be paid traditionally or by dilution. The US debt is so large that I don’t believe it can be paid traditionally, so the dollar has to be diluted. This dilution will cost all citizens in one form or another, mostly in the form of a lower standard of living.
- If a currency is diluted it loses purchasing power, both here and abroad. The buyer gets less and pays more. In the next few months the dollar appears headed down to the $65.00 area on the $USD index. This technical price action represents the fundamental of debt payment by dilution.
- While the time of this actual quotation is uncertain, Jim Rogers has commented on the magnitude of the US debt with this statement over the years,“Europe’s got some bad problems but the entity as a whole is not nearly as deep in debt as the U.S. They don't have a huge balance of trade deficit, like we do.”
- Our debt could turn into a crisis, and it could be a lot worse than what Europe is experiencing. Will Illinois, California, and New York be viewed by the rest of America like Germany views Greece now? Where does this all end? It feels like there is no end, and much more pain to come for many years.
- The dollar rally already now appears to be starting a topping out process. This process that is topping the dollar is also creating substantial bottoming action in gold and commodities. I expect this process to take another two weeks. I want to own more gold while the “sale” is on.
Gold Super Highway Chart
Gold Analysis
Two important items:
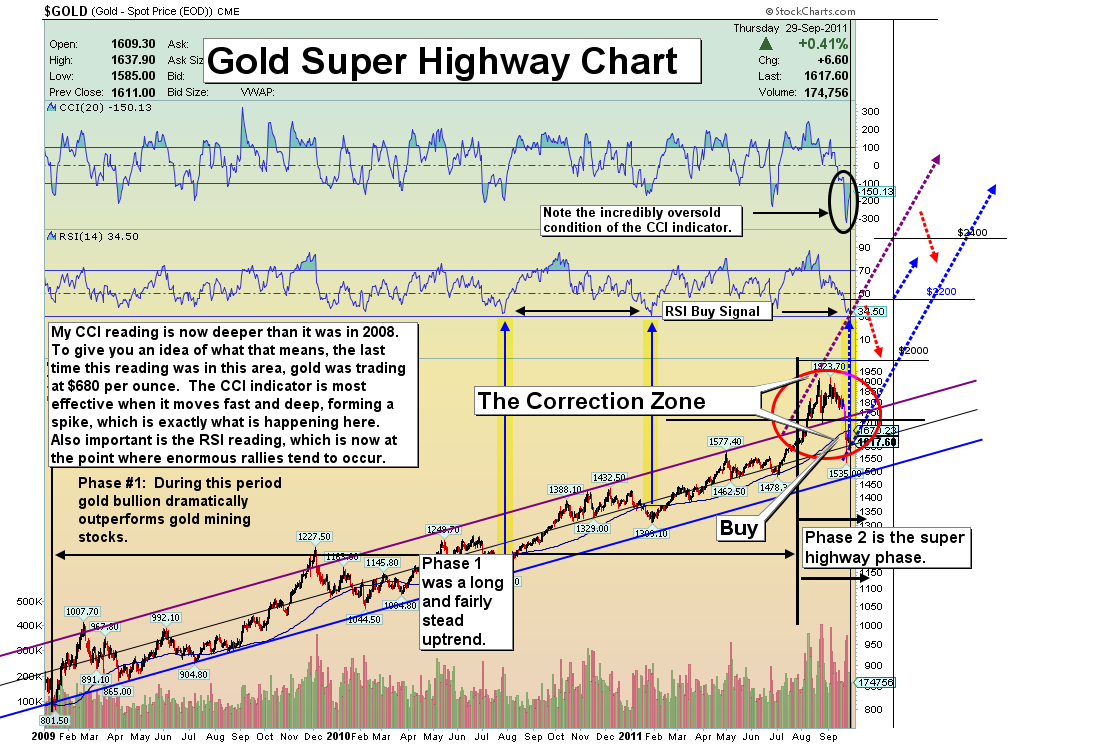
- You can make the argument that chart damage has been done here. The small symmetrical triangle I highlighted last week failed, but it was a small technical formation; the big technical picture continues to strengthen. Gold has begun the journey to becoming the worldwide asset of choice in this crisis.
- Massive Asian physical buying has come to the metals as a result of the three day correction that saw gold prices fall over 10%, and the Indian wedding season preparations are picking up steam.
- A report was posted on Bloomberg several days ago stating that gold could go to $10,000 per ounce based upon the amount of money printed on a historical basis. That is prior to any additional QE programs. More printing allows for an even higher gold price. Many believe the US government will default on obligations. There really is no final target price for gold. Over time, governments will just keep printing paper currency to dilute their debts, as they have for thousands of years. It began with diluting gold coins with other metals. The space age has brought the electronic printing press. Gold is volatile, but the largest trend of the gold price over the longest time has always been higher, against government promise-backed currency.
- I believe physical gold owners are the smartest of all investors.
- To be in a market and to stay in a market, you must believe in what you own and know why you own it. Don’t buy something simply because the chart looks nice. Buy it because of great fundamentals. Use my technical buy signals to increase your core positions.
GDX Breakout of the Decade Chart
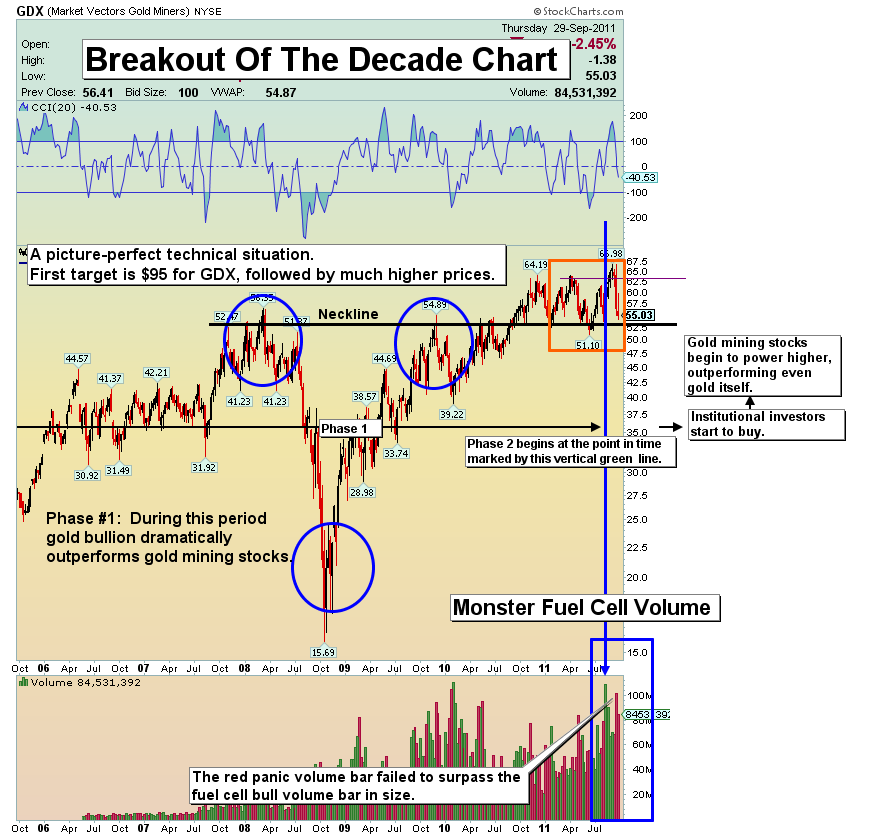
- From overbought to oversold, inside of a week; that has been the story for gold stocks. I’ve gone from issuing profit taking signals to issuing aggressive buy signals, because this market is now severely oversold.
GDX Corrections Chart
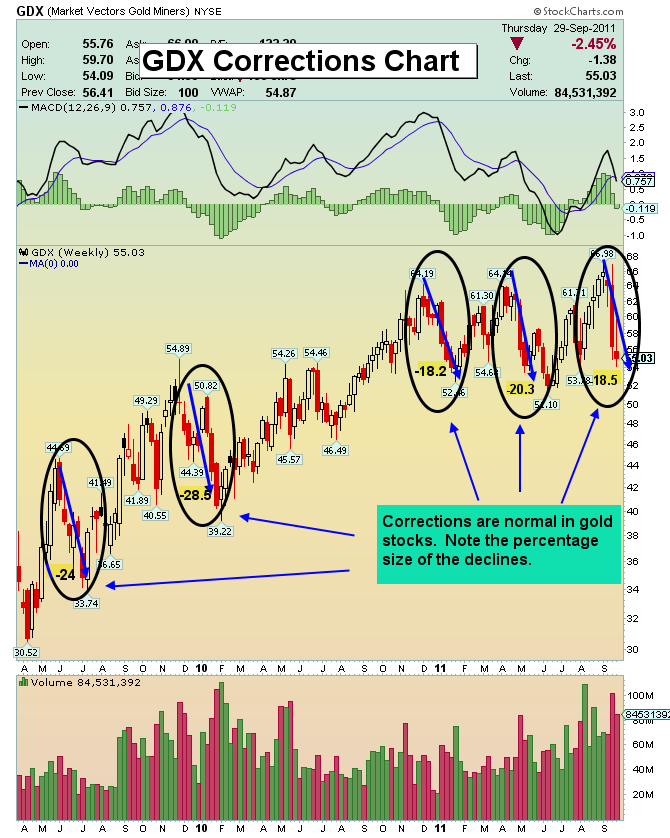
- It is easy to get discouraged and shaken, especially when using a system of stop loss trading. It is almost impossible to make money trading GDX or individual gold stocks with such a program. I want you to be a market winner and that requires a successful program, not one that involves closing out trades at losses. I issued a buy on GDX at $56.92, and that trade should only be sold at a profit.
- A look at the above chart demonstrates the corrections that have been common in this bull market. So far, the most recent correction has done less damage than most of the others. The majority of this correction came in two days, and this is normal bull market activity.
- The real key is to take light profits only as the price goes higher, and be prepared to reallocate during times of severe weakness such as we have right now. Trading positions should be smaller now because of the grossly undervalued condition of the gold stock assets. The gold stocks in general seem poised to move phenomenally higher in the next few months.
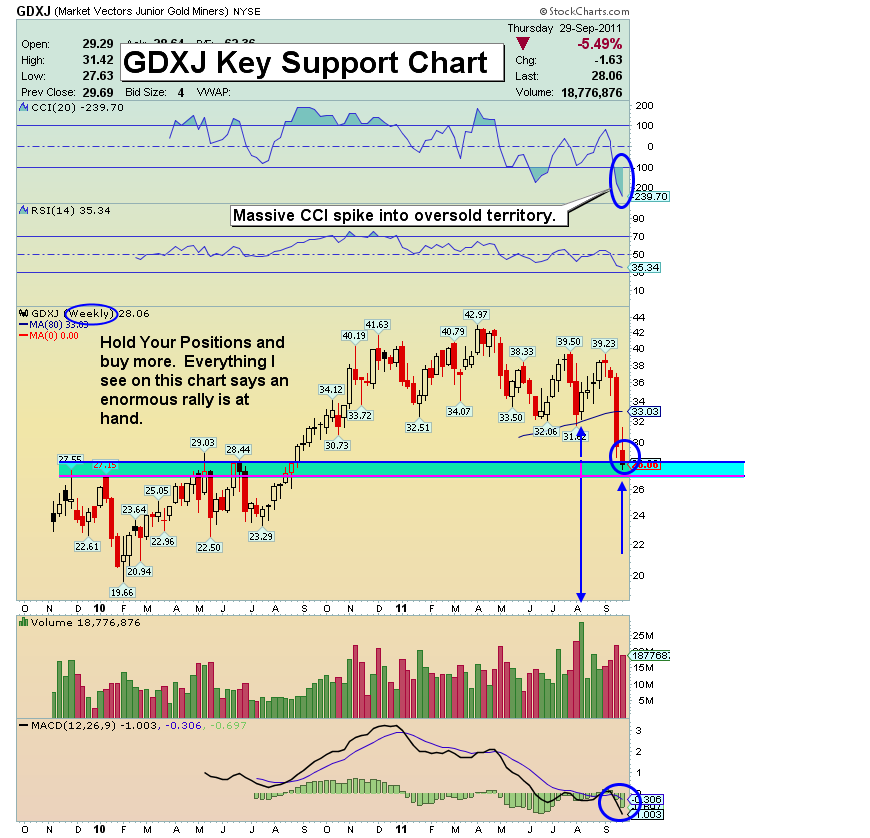
GDXJ Support Chart
- Everything on the above chart is in place for a mind blowing rally, and believe me, I’m fully aware of the shell-shocked state most of you juniors investors are in right now, and have been in for years.
- I see an enormous move higher coming in this sector, but unfortunately many holders have abandoned their positions. Sentiment readings are extreme. Most importantly, there is a technical triple play at hand. I see an excellent volume set up, extreme MACD readings, and an enormous oversold CCI spike. This combination of technical buy signals is rare and very powerful.
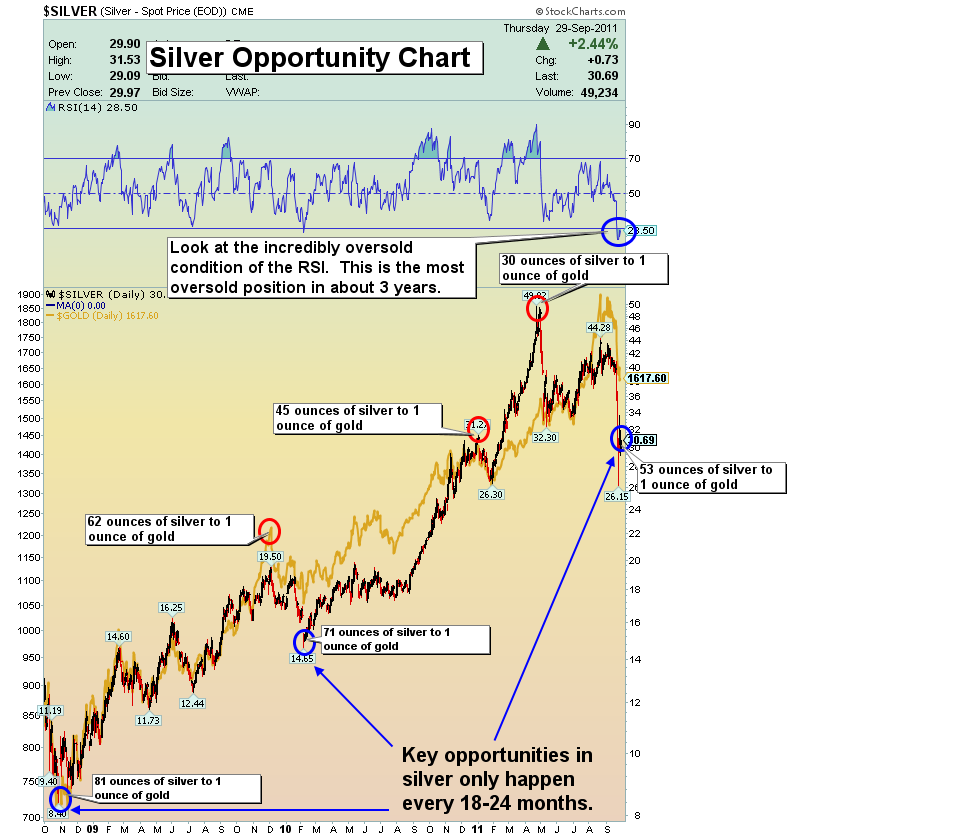
Silver Opportunity Chart
- This massive selloff in silver has opened up a great opportunity for you. Compared to my gold core positions, my silver holdings are relatively minor.
- That being said, I just traded 7% of my gold for silver!
- Look at the ratio notes I put on the above chart. Last spring when silver was peaking, the ratio was about 30 ounces of silver for one ounce of gold. That ratio, due to the recent price plunge in silver compared to gold, has quickly grown to 53 ounces of silver for one ounce of gold. These types of buying opportunities have been opening up only about once every 18-24 months, so I suggest you contact your physical dealer and get in on this play.
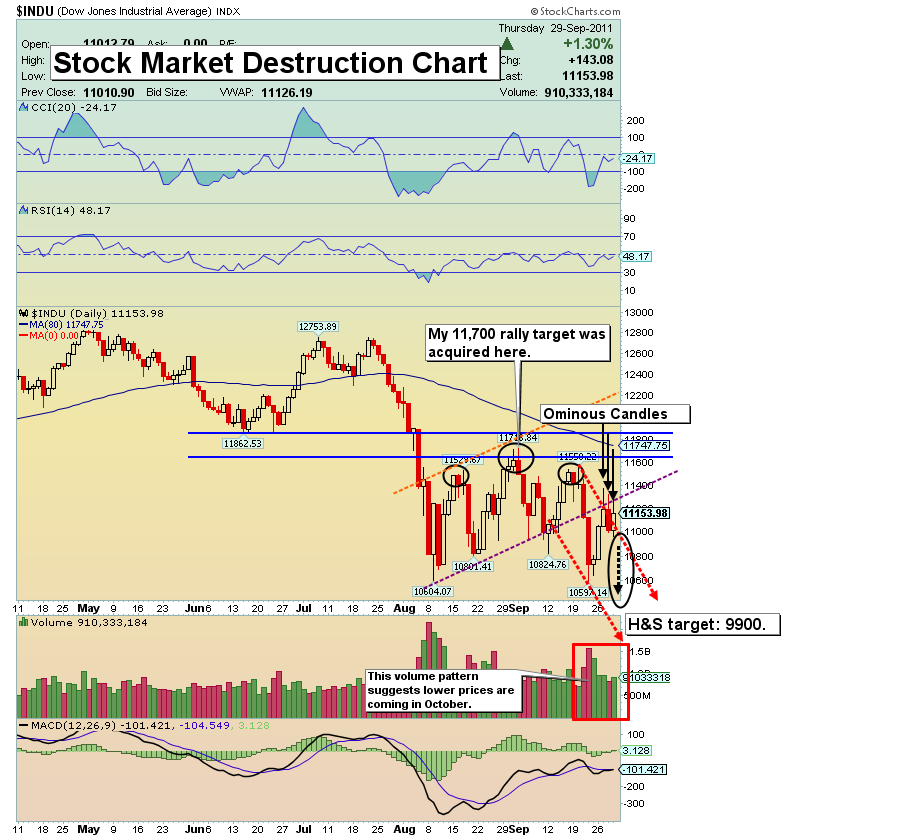
Stock Market Destruction Chart
- I see the dollar topping out in the next two or three weeks. That also means I see the stock market bottoming inside of 2-3 weeks. The window for booking profits on short sales is closing fast, but is still open, and the possibility of a heavy drop in the market is likely in this very short time span/
Here’s why I think the shorts could still prevail…
- Volume patterns are absolutely terrible. This rally has come on poor volume, and that usually is followed by lower prices. The next leg down in this market could begin as early as next week.
- In the bigger picture, my sentiment indicators are growing much more favourable. People are very scared. I have projected lows into the 9500 area, and that can happen, but as fearful as the market’s participants are, prices can bottom probably just under Dow 10,000. The head & shoulders target on the above chart indicates 9900.
- I know this may come as a bit of a shock, but I believe the next leg of weakness in the stock market could be purchased quite aggressively. Personally, I am directing my main buys towards gold, silver, gold stocks, crude oil, and agricultural commodities!
Friday, Jul 10, 2026 Super Force Signals Unique Introduction For 321Gold Readers:
Send me an email to admin@supergoldsignals.com and I’ll send you my free “Inflation Thunder Now!” gold and silver stocks video report. I’ll also include 3 of my next Super Force Surge Signals free of charge, as I send them to paid subscribers. Thank you!
|
Stay alert for our Super Gold alerts, sent by email to subscribers,
for both the daily charts on Super Force Signals at www.supergoldsignals.com and for the 60 minute
charts at www.supergoldsignals.com
About Super
Gold Signals:
Our Surge Gold Signals are created thru our proprietary blend
of the highest quality technical analysis and many years of successful
business building. We are two business owners with excellent synergy.
We understand risk and reward. Our subscribers are generally successfully
business owners, people like yourself with speculative funds,
looking for serious management of your risk and reward in the
market.
Frank Johnson:
Executive Editor, Macro Risk Manager.
Morris Hubbartt: Chief Market Analyst, Trading Risk Specialist.
website: www.supergoldsignals.com
email:
admin@supergoldsignals.com
email: admin@supergold60.com
Mail:
1276 Lakeview Drive
Oakville, Ontario, L6H 2M8
Canada
###
Sep 30, 2011
Morris Hubbartt
321gold
Ltd

|
