Super Force Signals - A Leading
Market Timing Service
We Take Every Trade Ourselves
The Golden Price Magnets
Morris Hubbartt
Weekly Market Update Excerpt
posted Sep 28, 2012
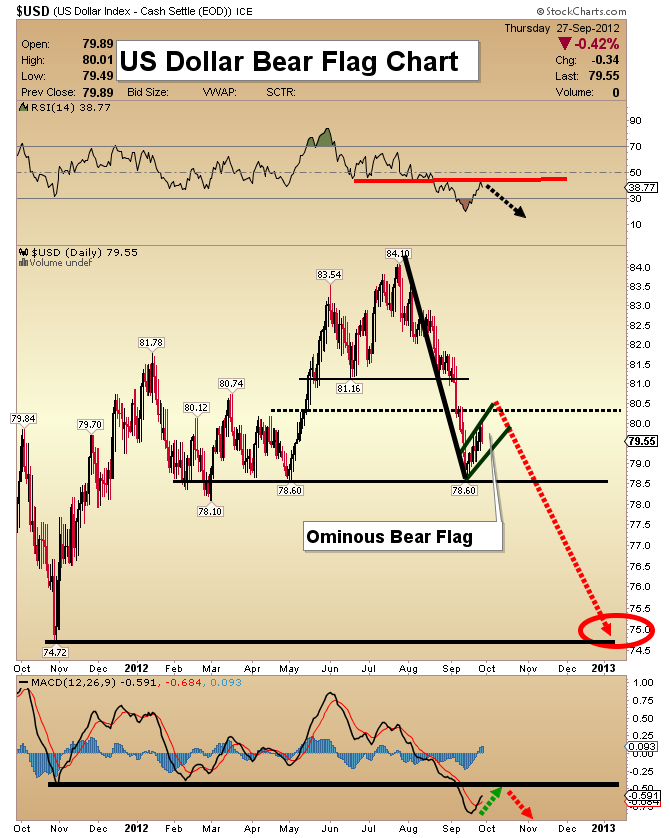
US Dollar Bear Flag Chart
- The dollar has hit my initial downside target. To ascertain what’s next, I use three important charts to create a financial roadmap.
- The 80.50 area is important to my timeline analysis, which suggests this move higher is only a countertrend “pop”. It’s not a game changer. The projected right shoulder of an h&s top is taking shape, as a bear flag.
- This pattern suggests a quick resumption of the dollar’s downtrend. It also implies that my $2015 target price for gold could be acquired by November.
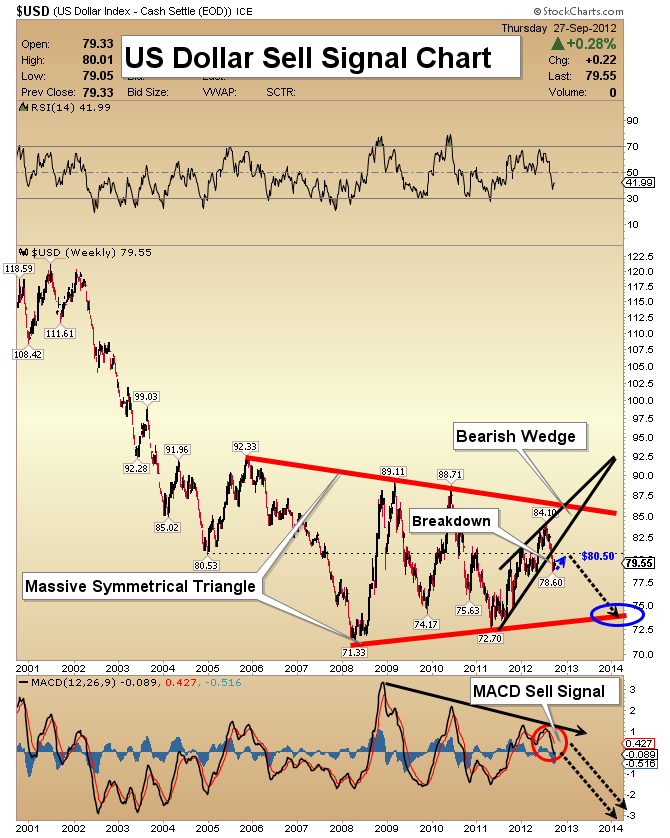
US Dollar Sell Signal Chart
- The dollar's long term risk is demonstrated by this weekly chart. Whereas the dollar is oversold on the daily chart, this powerful weekly chart indicates an immense move lower is just beginning.
- My experience with these types of situations is that placing your bets on the picture portrayed by the weekly chart, is the best course of action.
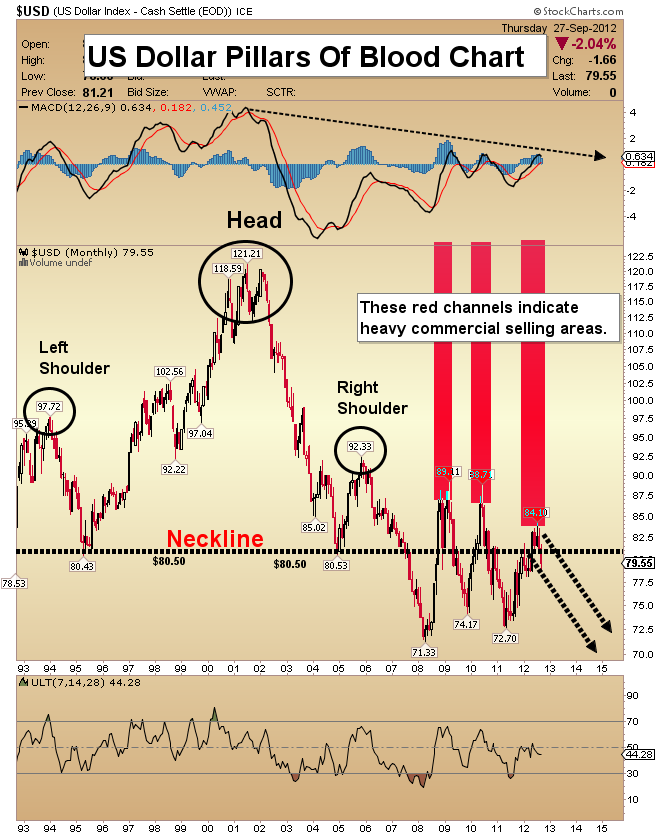
US Dollar Pillars Of Blood Chart
- This is a 20 year monthly chart. A major price breakdown has already taken place.
- It demonstrates the importance of the 80.50 area.
- After a small move sideways or slightly higher, downward pressure should once again dominate the dollar’s movement.
- Note the dotted black lines that I’ve highlighted. I believe the downtrend is already underway, and any rally will be limited to the confines of this bearish channel.
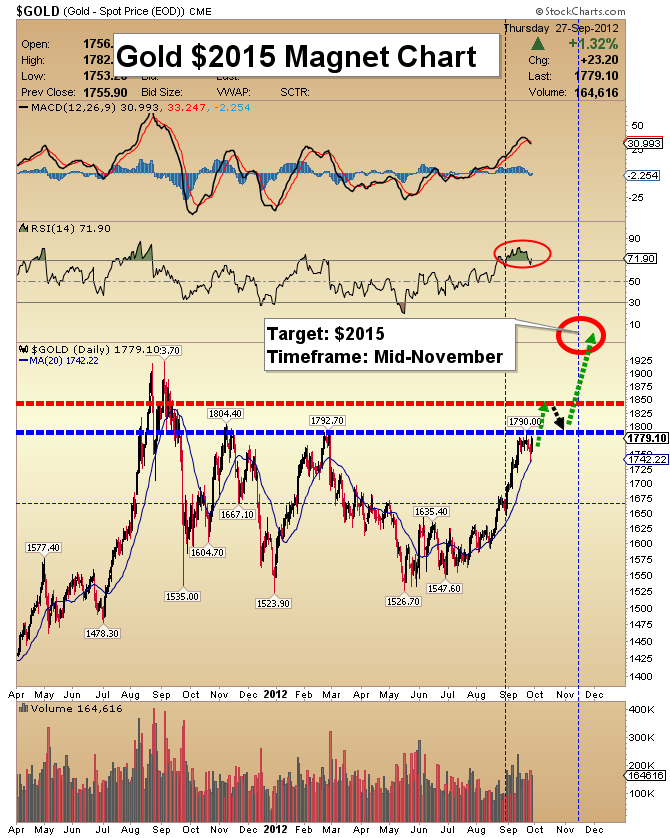
Gold $2015 Magnet Chart
- My work continues to forecast gold will rise to $1850 in the short term. From there, I am projecting a pause, and then a powerful move should take gold to $2015 by mid-November.
- My working model projects only light pullbacks will occur, before gold acquires $2015. I don’t think you need to worry about anything more than a 5% drawdown.
- Once new highs are achieved in the $2015 area, I am projecting a much deeper correction.
- At this moment, all my intermediate term technical indicators are showing green lights for gold!
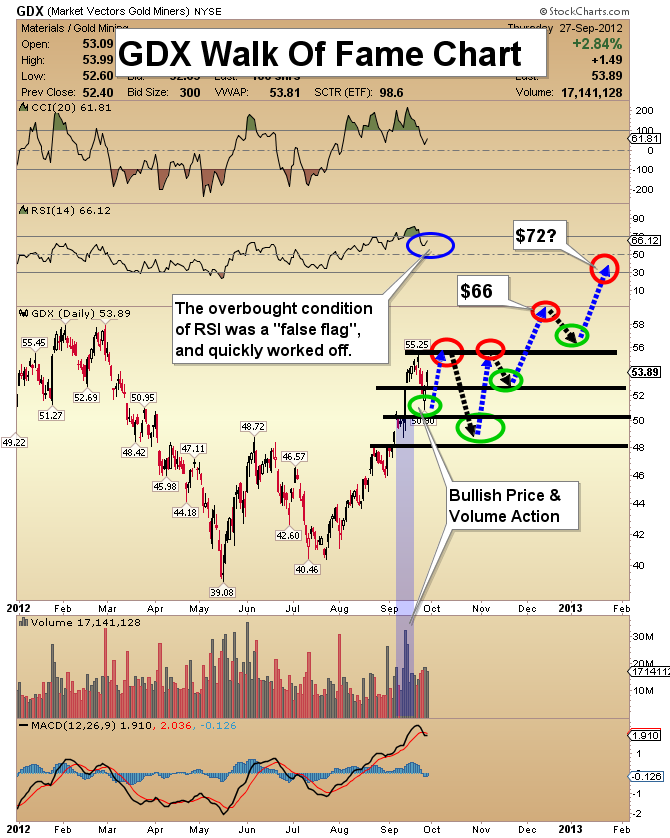
GDX Walk Of Fame Chart
- You can tell a lot about a bull when it pauses. After reaching the upside targets I set for gold stocks several weeks ago, the market pulled back briefly, before racing higher again.
- I am now projecting a rise to the $55-$57 area again, followed by a modest but frightening pullback. That decline should halt near $48.
- From there, I’m projecting a 3rd assault on the $55-$57 zone. After some hesitation, GDX should then surge higher.
- I expect $66 to be acquired by January. If the gold market gains serious momentum, it could happen by mid-November.
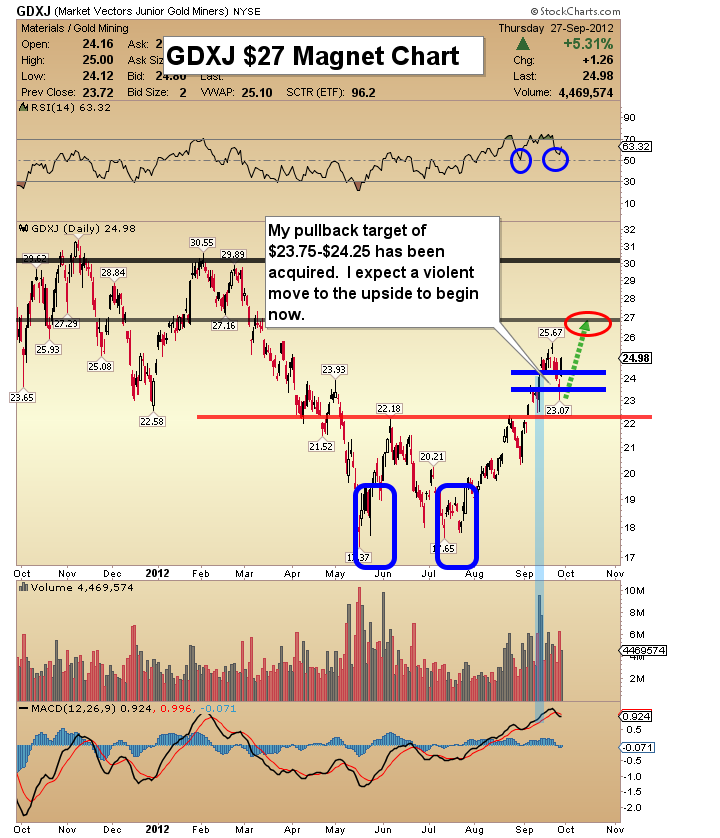
GDXJ $27 Magnet Chart
- GDXJ successfully acquired my $25-$27 target area. The market then pulled back slightly, and raced higher over the past two days. I’m projecting that this move will take GDXJ to $27.
- Volume patterns are solidly bullish.
- There is a lot of support in the $22 price zone. It should act like a “price trampoline”, if GDXJ were to decline instead of rise. Junior gold stock investors should be in fairly good spirits now. QE3 and talk of QE4 should also help to boost morale.
- RSI is no longer overbought and is in a position where strong momentum moves can occur. MACD is at a level of 0.924. Before a serious price correction begins, I am projecting that it reaches 2.00.
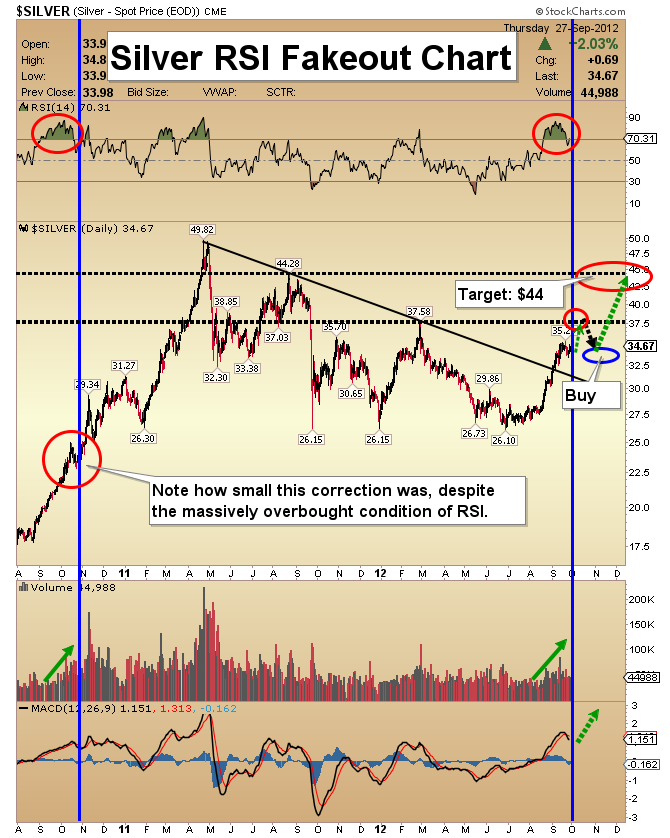
Silver RSI Fake Out Chart
- Silver refuses to back off. That probably tells you a lot about its future. I call this chart the “RSI Fake Out”. Look to the left of the chart. A week ago I noted the similarity of RSI now, to the situation in 2010.
- You can see that RSI became very overbought in both instances. Many investors panicked recently, as they did in 2010 when the same thing happened. My analysis suggests sharp pullbacks will continue to occur, rather than a significant correction.
- In the short term, my worst case scenario has silver going to $31.50, but I don’t think that will happen. I think $44 will be acquired fairly quickly. In the longer term, I see silver running to $150, and possibly higher!
Friday, Jul 3, 2026 Super Force Signals Unique Introduction For 321Gold Readers:
Send me an email to admin@supergoldsignals.com and I’ll send you my free “Inflation Thunder Now!” gold and silver stocks video report. I’ll also include 3 of my next Super Force Surge Signals free of charge, as I send them to paid subscribers. Thank you!
|
Stay alert for our Super Gold alerts, sent by email to subscribers,
for both the daily charts on Super Force Signals at www.supergoldsignals.com and for the 60 minute
charts at www.supergoldsignals.com
About Super
Gold Signals:
Our Surge Gold Signals are created thru our proprietary blend
of the highest quality technical analysis and many years of successful
business building. We are two business owners with excellent synergy.
We understand risk and reward. Our subscribers are generally successfully
business owners, people like yourself with speculative funds,
looking for serious management of your risk and reward in the
market.
Frank Johnson:
Executive Editor, Macro Risk Manager.
Morris Hubbartt: Chief Market Analyst, Trading Risk Specialist.
website: www.supergoldsignals.com
email:
admin@supergoldsignals.com
email: admin@supergold60.com
Mail:
1276 Lakeview Drive
Oakville, Ontario, L6H 2M8
Canada
###
Sep 28, 2012
Morris Hubbartt
321gold
Ltd

|
