Super Force Signals - A Leading
Market Timing Service
We Take Every Trade Ourselves
Dow Destruction & Gold Super Highway
Morris Hubbartt
Weekly Market Update Excerpt
posted Sep 23, 2011
Dollar Commentary
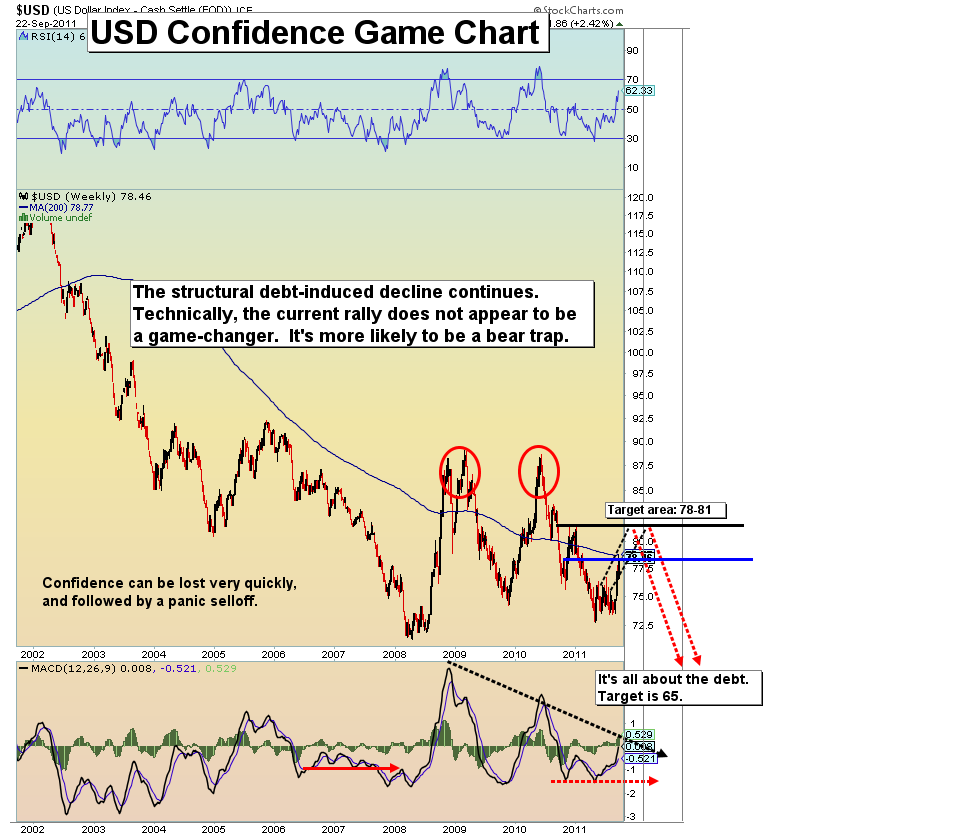
- Our leaders’ answer to all economic problems is printing and lending more money. Is that a solution, or a denial that there even is a problem?
- Our own fed promises a dollar-destroying low interest rate, for another two years. Overspending governments are not interested in a strong currency. They want your currency and purchasing power to be as weak as possible.
- Technically, the counter trend rally that the dollar is enjoying looks to be headed into mid-October. The move looks to be an oversold bounce and nothing more. A byproduct of the strengthening dollar is a stock market that is in great danger.
- My technical work continues to point to new lows for the stock market with a mid-October timeline, and that fits with my dollar bear rally timeline.
Stock Market Destruction Chart
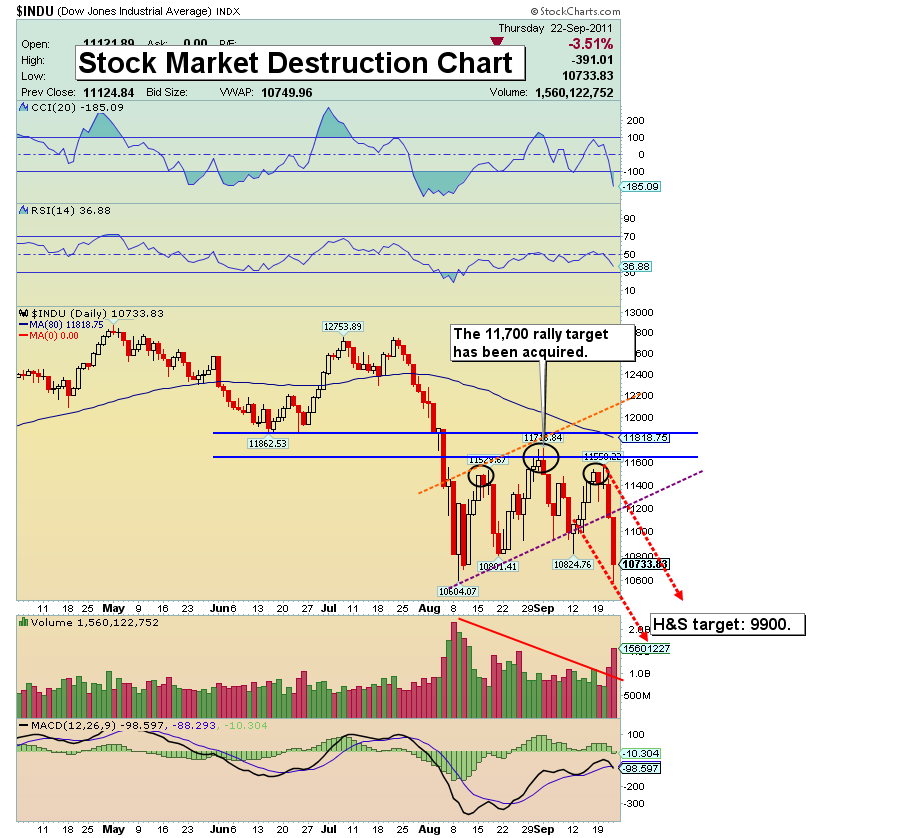
- The stock market has pretty much given me what I had expected. On June 24th I issued the headline, “Gold Stocks Bottom While SP500 Tops Out.” I targeted the 11,700 area for the Dow, and that target was acquired in early September, and the rollover I projected from there occurred on schedule. What is the next move now?
- As the dollar finishes its bounce, it’s likely to continue to tear up the stock market. The stock market has a queasy feeling to it between now and the middle of October. I see new lows coming to the stock market, likely towards the 9500 area, or even a tad lower. The target of my highlighted head and shoulders formation would put the market in that general area.
- The numbers I’m talking about for the Dow cannot help but scare investors who remember the destruction of 2008. With real terror, so comes your greatest opportunity. I’m watching my internal sentiment indicators for the stock market very closely, to identify the area of greatest opportunity for you.
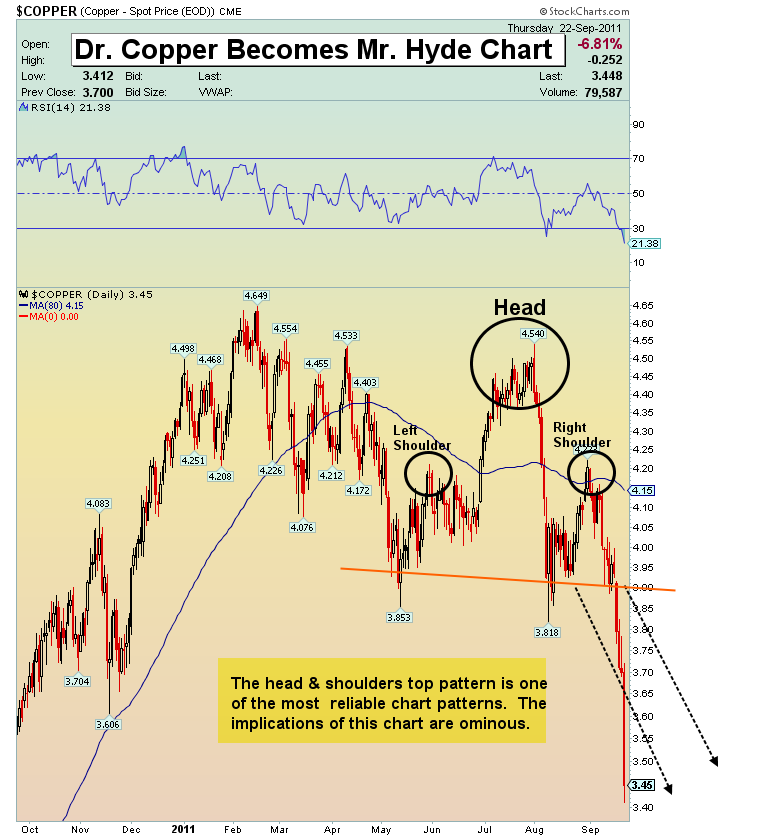
- A key indicator of the health of the economy is the copper trade. Copper is called “Dr. Copper” for good reason. Copper is said to be the metal with a Ph.D. in economics, for its ability to determine the health of the future of the global economy.
- Dr. Copper turned lower in 2008 as the credit crisis was just getting started. Then it started moving higher in the last days of 2008, three months before things turned around for the stock market. That is just one example of many cases where copper has lead the economy and the stock market.
- I’m not referring to copper as a commodity to sell or short, but rather as a barometer that measures the health of the economy. What copper is saying about the economy and the health of the stock market right now it is quite troubling, and it is in full agreement with my mid- October stock market target analysis.
Dr. Copper Becomes Mr. Hyde Chart
The technical picture on this chart is so ominous in terms of what it is saying about the American economy that the best analogy is that Doctor “Jeckyll” Copper has turned into a sort of Mr. Hyde financial character. The implications of the copper chart for the general economy and stock market are nightmarish. While I haven’t shown the weekly chart for copper here, it shows an even bigger head & shoulders top. The bottom line is that the stock market and the economy are both in tremendous danger.
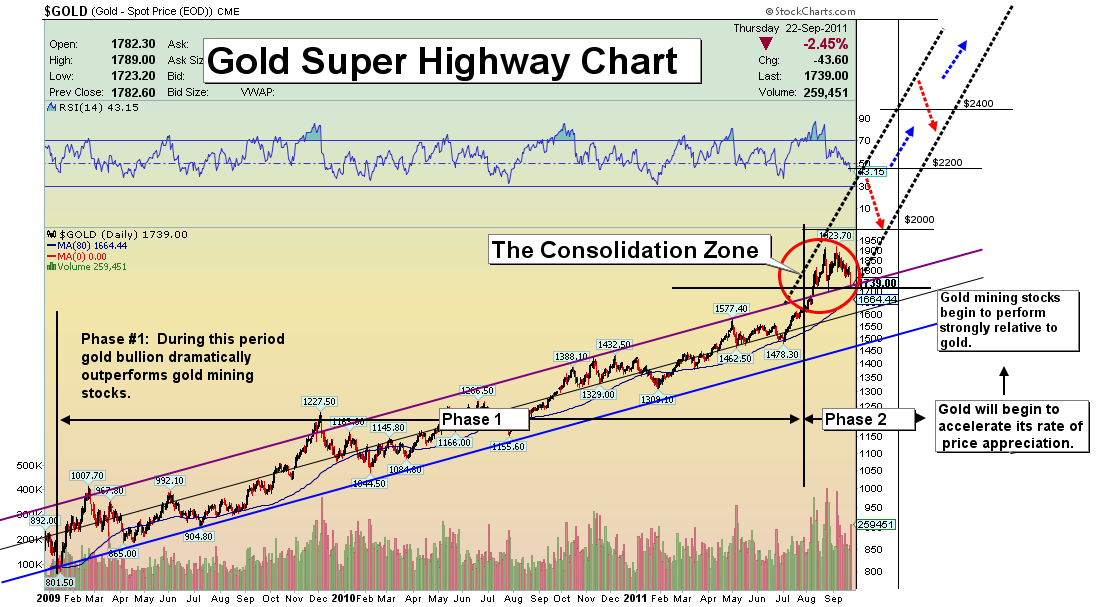
Gold Super Highway Chart
Gold Analysis
- A gold bullion rush is coming, and I believe we are within 12-18 months of seeing gold trading in the $3000 price range. Those trying to outsmart this bull market are looking to get the horn, and most of those trying already have, numerous times. Historically, when a loss of confidence hits a paper currency the decline can be earthshaking. I believe gold short sellers are going to get scorched. Large core bullion positions outside the banking system are your solution to this crisis.
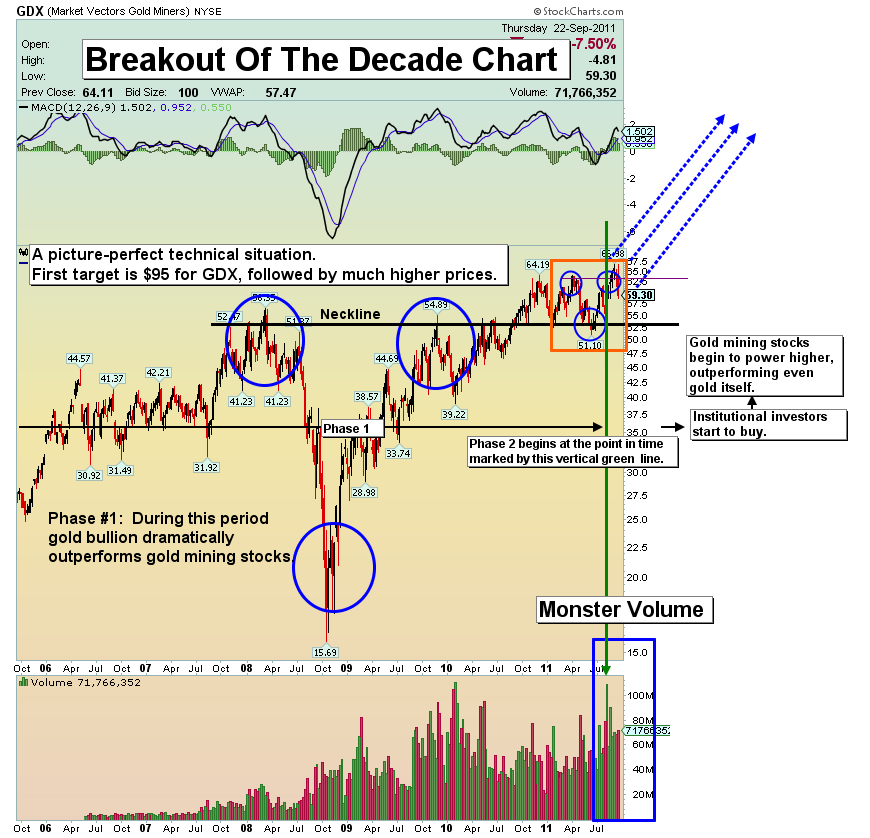
GDX Breakout of the Decade Chart
- The bullish inverse head and shoulders formation is activating, and $95.00 is the target. The powerful volume that is accompanying the move is the turbo charger that will see this market pick up serious momentum over the next four months.
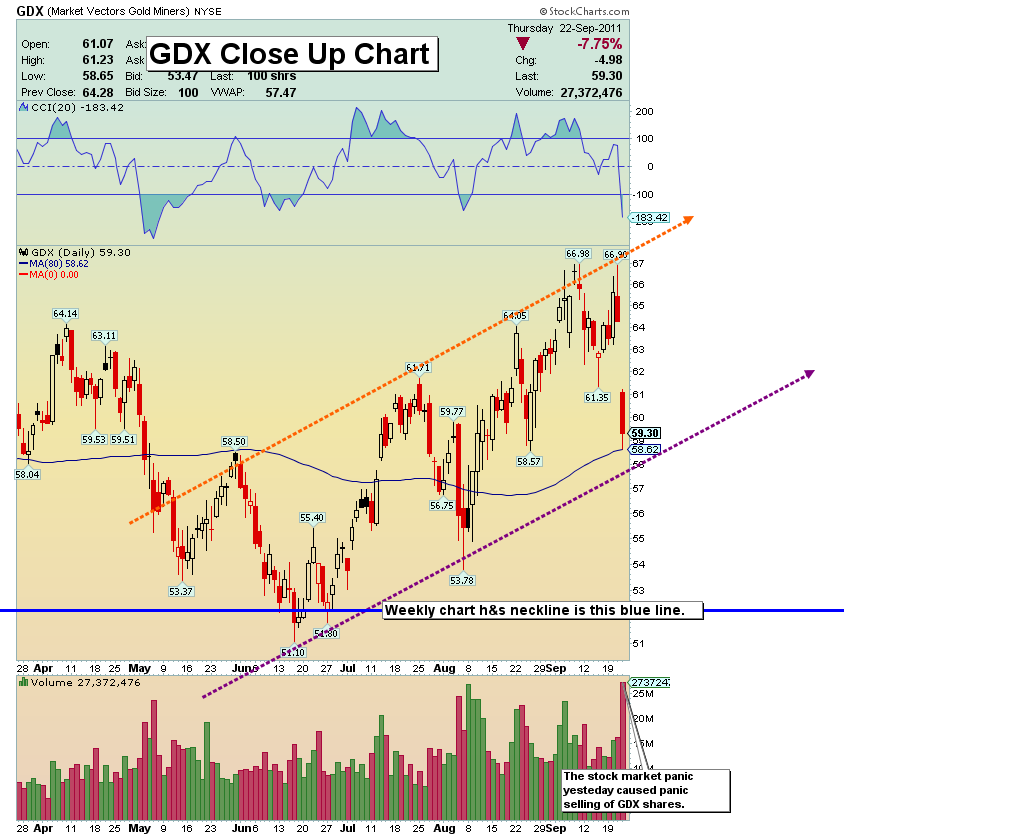
GDX Close Up Chart
- This chart is literally a close up of the right shoulder of longer term chart above. This type of multiple head and shouldering action is very bullish in this type chart pattern. Literally these formations can be used to identify stepping stone targets as prices moves higher. Note the above targets on this daily chart.
Gold Stocks Volatility Zone Chart
- What typically accompanies an overbought market is volatility, and volatility is definitely here. In the last two weeks you have seen GDX trade down 10%, only to turn higher and regain it all. It fell about 10% yesterday, again. It is important to have a program in place that operates on buying weakness to build holdings, rather than placing stop losses, because the volatility and computer program trading have effectively made the use of stop losses impractical.
- Gold senior stocks have finally gotten overbought technically, after many months of being heavily oversold. Overbought does not mean overdone. The blue boxes on the above chart represent the most favorable season for gold stocks. The overbought condition normally stays there for four months. While most gold investors are probably in almost a fit of terror this morning, the fact is, technically speaking, this move up has likely just started!
Friday, Jul 24, 2026 Super Force Signals Unique Introduction For 321Gold Readers:
Send me an email to admin@supergoldsignals.com and I’ll send you my free “Inflation Thunder Now!” gold and silver stocks video report. I’ll also include 3 of my next Super Force Surge Signals free of charge, as I send them to paid subscribers. Thank you!
|
Stay alert for our Super Gold alerts, sent by email to subscribers,
for both the daily charts on Super Force Signals at www.supergoldsignals.com and for the 60 minute
charts at www.supergoldsignals.com
About Super
Gold Signals:
Our Surge Gold Signals are created thru our proprietary blend
of the highest quality technical analysis and many years of successful
business building. We are two business owners with excellent synergy.
We understand risk and reward. Our subscribers are generally successfully
business owners, people like yourself with speculative funds,
looking for serious management of your risk and reward in the
market.
Frank Johnson:
Executive Editor, Macro Risk Manager.
Morris Hubbartt: Chief Market Analyst, Trading Risk Specialist.
website: www.supergoldsignals.com
email:
admin@supergoldsignals.com
email: admin@supergold60.com
Mail:
1276 Lakeview Drive
Oakville, Ontario, L6H 2M8
Canada
###
Sep 23, 2011
Morris Hubbartt
321gold
Ltd

|
