Super Force Signals - A Leading
Market Timing Service
We Take Every Trade Ourselves
Gold Rally Will Continue
Morris Hubbartt
Weekly Market Update Excerpt
posted Sep 21, 2012
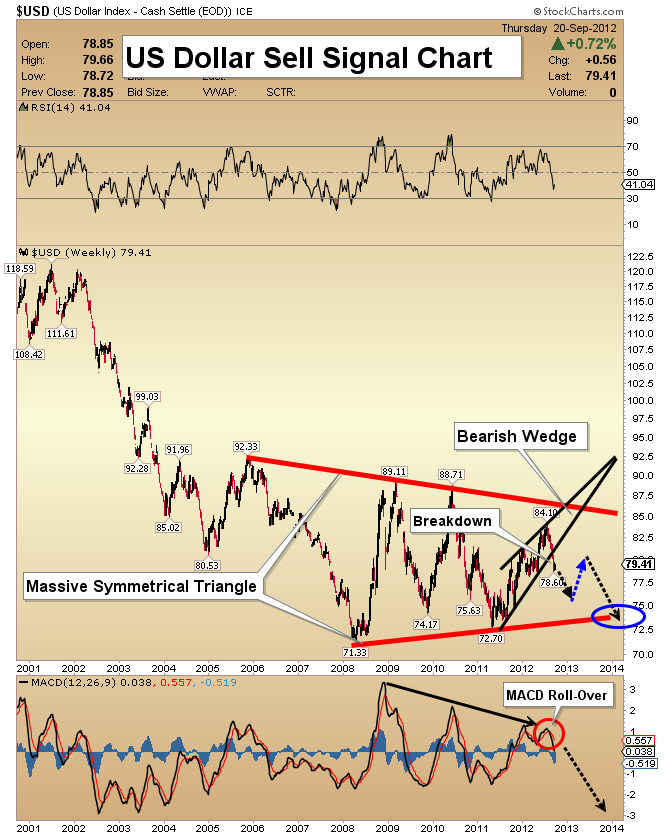
US Dollar Sell Signal Chart
- This weekly chart of the dollar shows a clear breakdown from the bearish wedge pattern, opening the door to my biggest downside target, at 55.
- While there could be a small rally now, I think there’s still one more minor push to the downside, before the dollar begins to rally. I expect the rally to die very quickly, and I’m projecting a vicious decline from there. My intermediate term target is 75, which is the lower red line on this chart.
- Use the coming rally to exit the dollar.
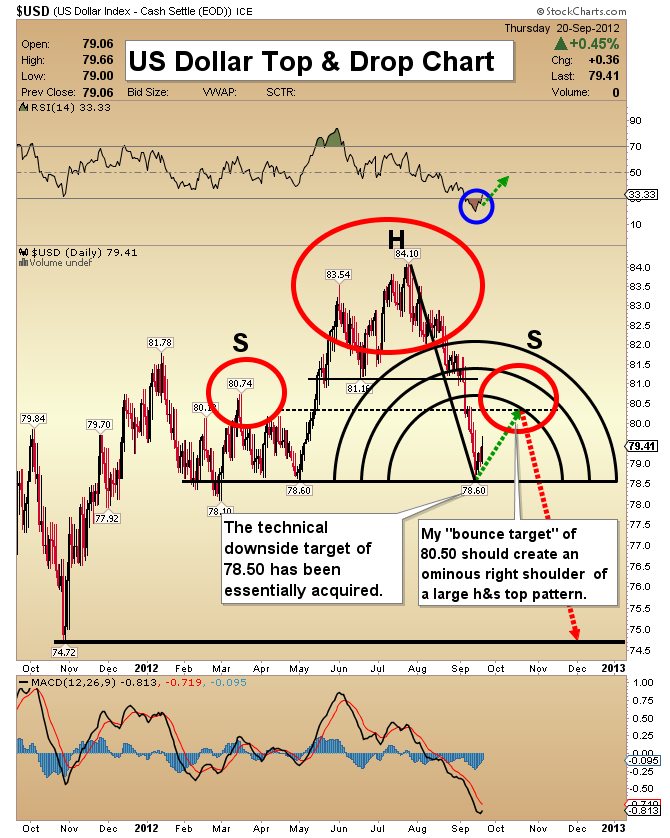
US Dollar Top & Drop Chart
- This is a daily chart for the dollar. My initial downside targets have just been acquired. The RSI indicator is registering readings under 20, and MACD is slightly oversold. After a weak bounce, I am projecting new lows.
- The use of the Fibonacci Arc tool can provide help in projecting where a right shoulder might occur in an h&s top pattern. I expect the top of the right shoulder to form in the area of the innermost arc, at about 80.50.
- The old saying, “don’t fight the Fed” is one to bear in mind. The dollar may be due for a bounce, but the biggest enemies of the US dollar could be the US government and the Federal Reserve, particularly with the arrival of QE3.
- Please, don’t fight the Fed. Use any dollar rally to increase your precious metals holdings.
Gold Analysis
- I am an advocate of holding a 70% core position in precious metals. Trade no more than 30% of your holdings for short term gains.
- During long corrections, the commercial group of gold traders are active buyers. Over the past few weeks, they have started selling. Some investors wonder if this means an end to the current leg of the bull market.
- I don’t believe that is the case. From the bottom of the correction in 2006 to the highs of early 2008, gold nearly doubled in price, despite early selling by commercial traders.
Gold COT Chart
- This chart is from www.sentimentrader.com. The current market has many similarities to the 2006-2007 timeframe. Large moves in gold tend to begin with commercial traders taking early profits.
- Hedge funds then step in, and buy aggressively. Their buying can continue for quite a long time. There is plenty of firepower in the gold market now, to send prices higher.
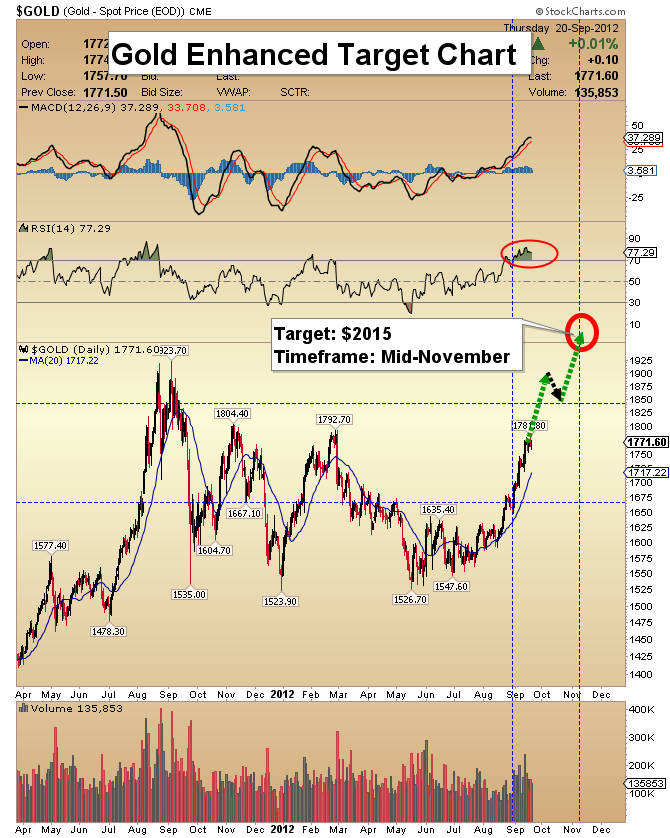
Gold Enhanced Target Chart
- I believe the current leg of the bull market could see gold reach $1850. From there I expect a shallow pullback, and then a run to new highs.
- The volume patterns suggest that gold could attain $2015, by mid-November. I think it is best to view $1850 as a road sign for higher prices.
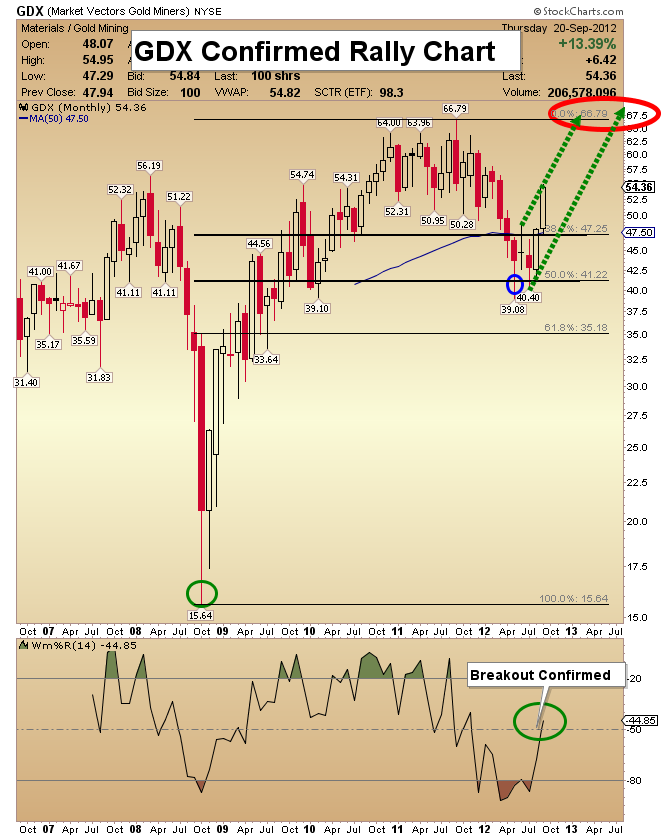
GDX Confirmed Rally Chart
- Gold stocks continue to make great progress. From the lows of May to recent highs, GDX is up nearly 40%. The Williams indicator on the monthly chart is confirming the move.
- In the history of the bull market, once gold stocks get to this point, technically, they have always continued to rally strongly.
- Note the green channel highlighted with dotted green lines. I believe this will define the range trade for GDX as it moves higher.
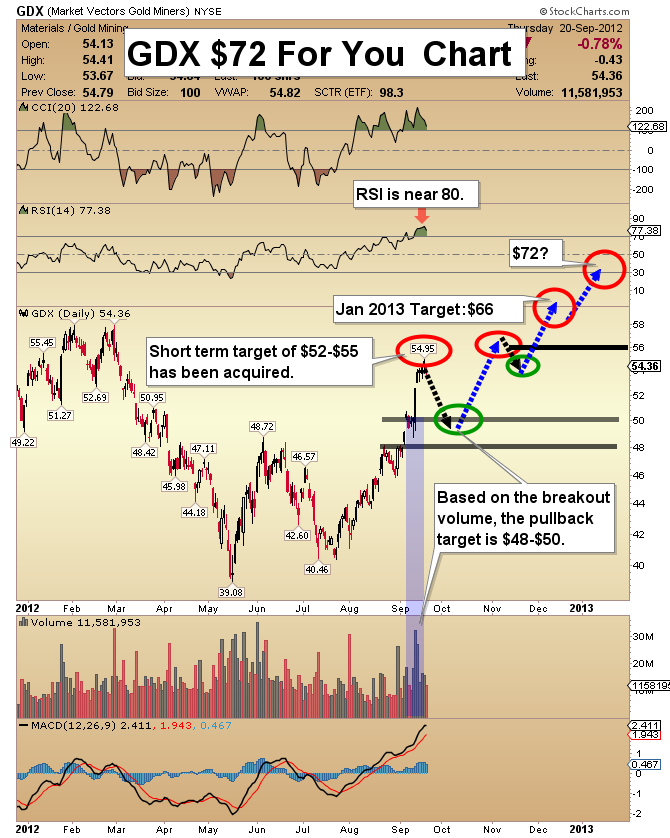
GDX $72 For You Chart
- I raised my short term GDX target, from $52 to $56. Progress continues to be made. I expect GDX to reach $56, before a correction begins.
- Once the target is acquired, I expect a 10% sell-off. Try to buy every 2-3% price decline, because in this type of environment, gold stocks may not go much lower.
- My volume analysis suggests that GDX is likely to overshoot my year-end GDX target of $66, and surge to $72.
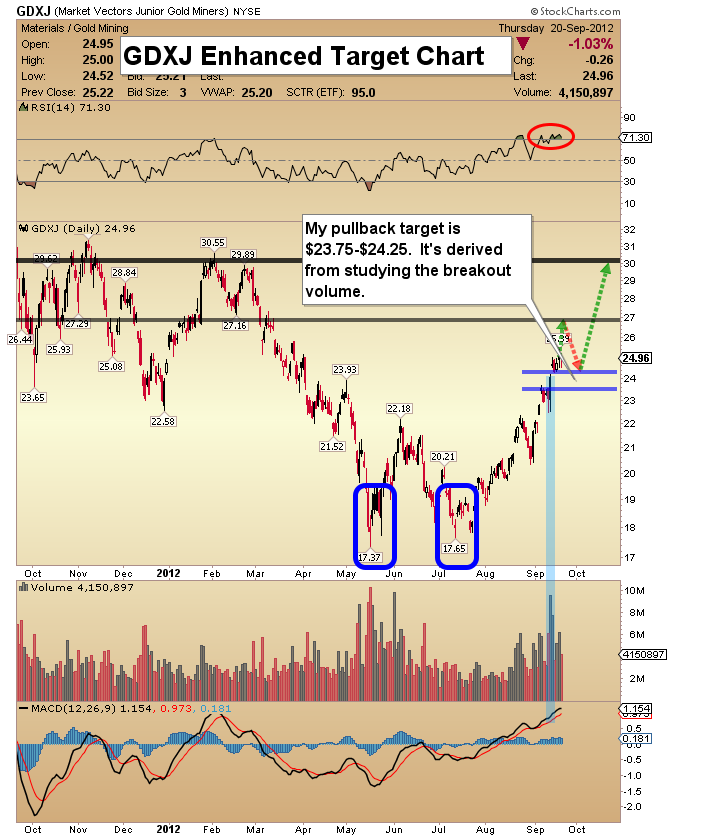
GDXJ Enhanced Target Chart
- The $25 target has been acquired. Note the enormous volume that I have highlighted in blue.
- This volume has convinced me that before a sell-off ensues, GDXJ will continue to move higher. My “enhanced” target is $27.
- From there, I’m projecting a decline to about $24.50, followed by a surge to $30.
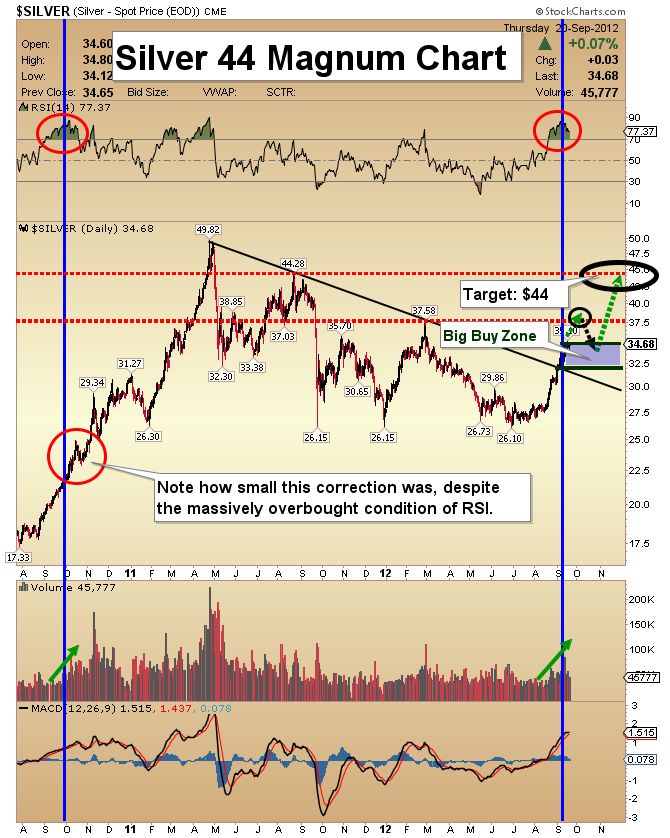
Silver 44 Magnum Chart
- Silver looks set to add to recent gains. Volume is solid. MACD is moving steadily higher.
- Note the highlighted timeframe of October, 2010. The RSI indicator surged to an extremely overbought condition. Technicians became very nervous and sold. I call volume the market’s “great truth teller”, and it signalled that the overbought RSI should be ignored. Only a small correction occurred, and then silver rocketed to almost $50!
- I think the market is now poised to run towards $125. First, I am projecting a move up to $37.50, and then a shallow correction down to the “big buy zone”. That area between $32 and $35 is where momentum players can add to core positions, in size.
- From there, I have set a target price of $44, where active traders could book some profit. Clint Eastwood used a .44 magnum handgun to “make his day”. Will $44 silver help to make your day? I think it will!
Friday, Jul 3, 2026 Super Force Signals Unique Introduction For 321Gold Readers:
Send me an email to admin@supergoldsignals.com and I’ll send you my free “Inflation Thunder Now!” gold and silver stocks video report. I’ll also include 3 of my next Super Force Surge Signals free of charge, as I send them to paid subscribers. Thank you!
|
Stay alert for our Super Gold alerts, sent by email to subscribers,
for both the daily charts on Super Force Signals at www.supergoldsignals.com and for the 60 minute
charts at www.supergoldsignals.com
About Super
Gold Signals:
Our Surge Gold Signals are created thru our proprietary blend
of the highest quality technical analysis and many years of successful
business building. We are two business owners with excellent synergy.
We understand risk and reward. Our subscribers are generally successfully
business owners, people like yourself with speculative funds,
looking for serious management of your risk and reward in the
market.
Frank Johnson:
Executive Editor, Macro Risk Manager.
Morris Hubbartt: Chief Market Analyst, Trading Risk Specialist.
website: www.supergoldsignals.com
email:
admin@supergoldsignals.com
email: admin@supergold60.com
Mail:
1276 Lakeview Drive
Oakville, Ontario, L6H 2M8
Canada
###
Sep 21, 2012
Morris Hubbartt
321gold
Ltd

|
