Super Force Signals - A Leading
Market Timing Service
We Take Every Trade Ourselves
Fall 2011: Gold Breakout Season?
Morris Hubbartt
Weekly Market Update Excerpt
posted Sep 16, 2011
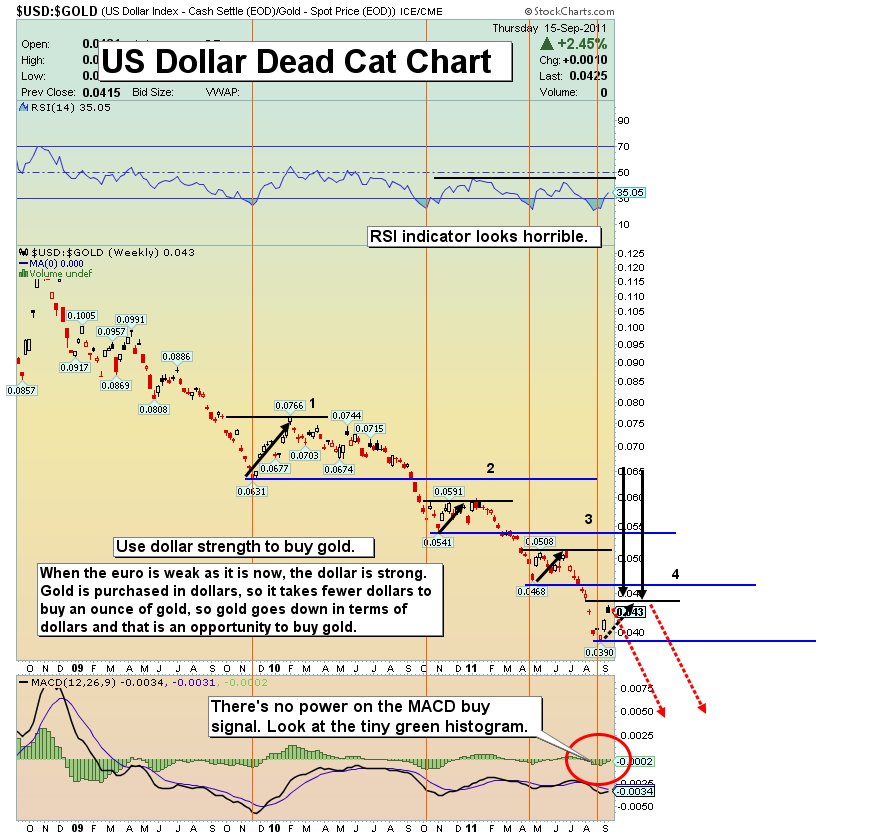
US Dollar Dead Cat Chart
Dollar Commentary
- A close look at this chart shows that every rally in the dollar against gold has been showcased with a weaker move up, and a shorter amount of time in the uptrend, and the rally has been followed by a steep decline. This chart shows nothing more than an extremely oversold technical condition for the US dollar being worked off. This technically oversold condition for the dollar is not a buy signal.
- Many considered the Swiss franc as good as gold. That idea went up in flames with the recent attack of the Swiss government on its own currency, one accompanied by a verbal threat of money printing to hold it down. Will America’s government do something similar, or even worse?
- Will the American government to try to manage its debt problem with a major devaluation of its currency against gold? The lack of confidence in the western world banking system is already creating a substantial erosion of confidence in fiat currencies. The entire fiat currency system seems caught up in a race to the bottom against gold.
- Dollar bulls should enjoy their rally while they can. It’s going to end very soon and in a very ugly way. Technically, the US dollar is sitting on a trap door, and is poised to dramatically accelerate its decline against gold. My technical work continues to show that the first move to the upper supply line of the gold superhighway channel is in “digestion mode”.
- The initial upside blast put the price of gold above the old uptrend channel. The technically oversold condition of the dollar is being alleviated, and all the gold critics are beginning to celebrate.
- That celebration is a terrible mistake.
- Technically, the fact is that gold is preparing for its next major assault on the dollar.
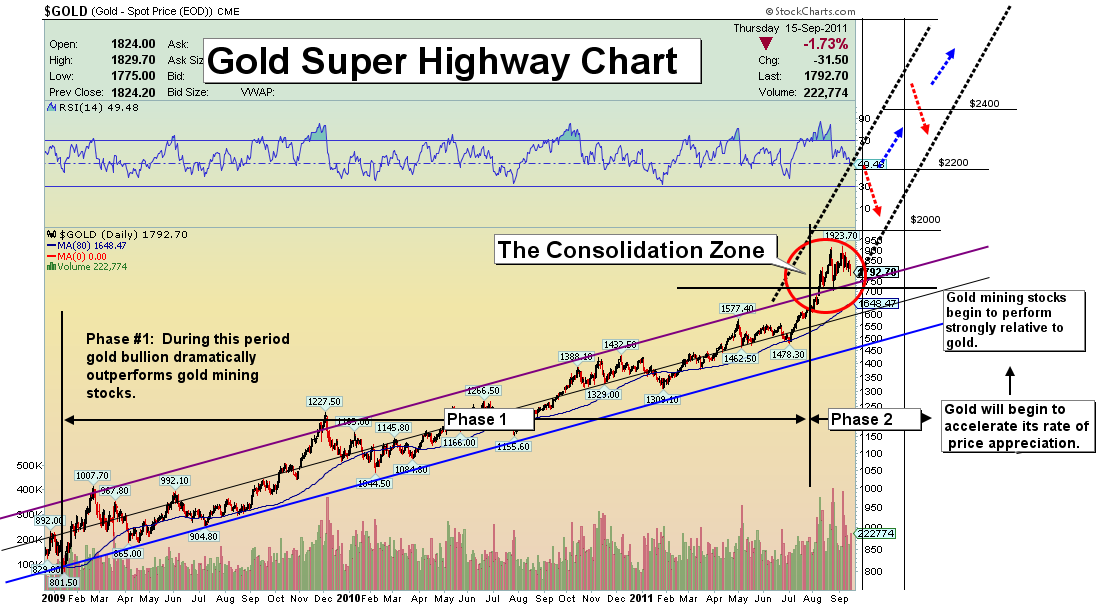
Gold Super Highway Chart
Gold Analysis
- A few money managers are already using gold for their base currency, but the wild price action in gold and silver is only in the early innings of the game. This stage of the gold market is best labeled as, “the institutional discovery of gold”, or “the awakening”.
- Look at the super highway channel on my chart. I believe the second phase of the gold bull has just started. This phase of the bull will be more powerful and volatile than the first one.
- The first phase showed gold making a slow and methodical rise against the dollar. We are now firmly in phase two, where institutions wake up and push assets into gold and especially into gold stocks. This phase could be followed by a third maniacal phase. Technically, it’s too early to speculate on the third phase.
- The “gold awakening” that I’ve talked about is literally the realization that there are unlimited dollars of any printed currency that can be manufactured, and only finite amounts of gold. Gold can really only be mined at a snail’s pace. The global supply of gold is increasing at only about 2% a year, and already there are rumours that China’s mines may be near peak production, while demand there skyrockets.
- Compare the growth in the gold money supply to the ability of the US Treasury to order a massive increase in the supply of dollars. Gold is simply “historical money”. Let’s repeat history and own some of it!
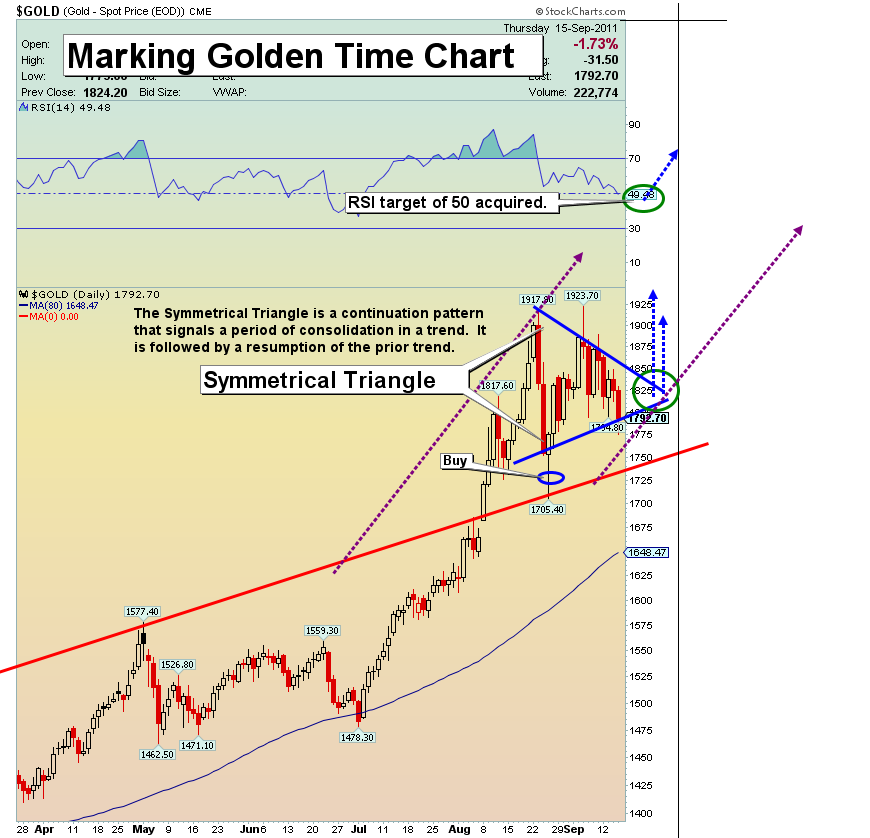
Marking Golden Time Chart
- The action in gold up and through the upper channel line of the old uptrend is reassuring. Now I want to see the gold price mark time. The price should build a base and setup the parameters for the bottom of the super highway up channel. I’m looking towards October 1st, as a time to complete this marking time process. A technical pattern is now apparent, and it is a symmetrical triangle.
- A symmetrical triangle is a bullish continuation pattern that signals a move higher is coming. The appearance of this pattern at this point in time is a truly wonderful event, technically.
- The bottom line is that phase two in this bull market is underway! Positions should be taken if you are light on the metal, before it’s too late. This triangle could become a kind hanging rectangle or flag before the end of the month, which is also very reassuring.
- RSI just acquired my target of 50 for this corrective move. When in the favorable months that we are in now for gold, normally RSI will go no lower than 48, and we got into that area yesterday on some of the gold ETFs. All signals are go on my charts. I think you are very close all the way around to seeing gold start an enormous move higher.
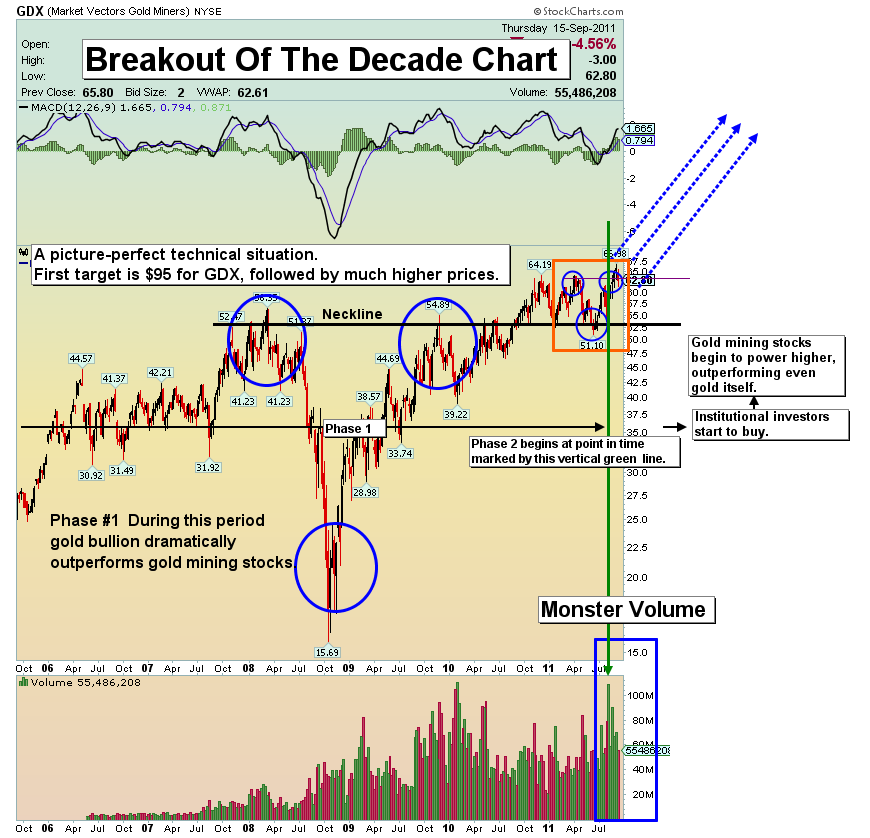
GDX Breakout of the Decade Chart
Gold Senior & Intermediate Stocks Analysis
- The greatest opportunity for Wall street and Main street investors at this very moment lies with what I call the gold “generals”. Generals lead the soldiers and that’s the action in this sector now; the seniors are leading.
- First and foremost, in this sector one must understand the importance of phase two of the bullion bull, and what that means to gold stocks. Phase 2 in the gold bull involves the realization by a new class of investors, institutional investors, that gold is the answer and that gold stocks are also a necessary and undervalued asset.
- This breakout chart is the most important chart for your money right now. The monster head and shoulders pattern is activating, giving a long term price target in the $95 area. I say long term, but the end target in most head and shoulders formation is often just the beginning of an extended move.
- The icing on the technicians’ cake is the enormous volume that gives this move total legitimacy. The great thing here is the gift that this offers to those that have missed much of the gold bullion bull. The door of opportunity is open.
- This chart is likely projecting enormous institutional liquidity flows. Estimates are that as little 1% or less of average portfolios are invested in precious metals. Money flows will begin more and more to move in this direction, pushing these stocks to the above stated inverse head and shoulders long term target, and beyond.
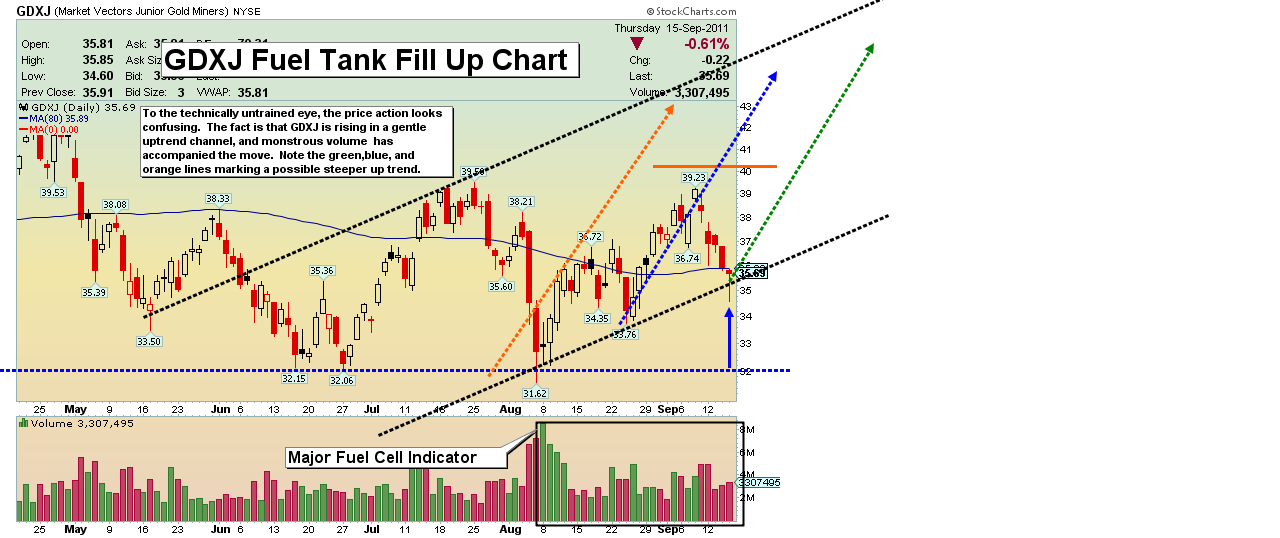
GDXJ Fuel Tank Fill Up Chart
- My focus has been more on the gold senior stocks in this report, but I have been a buyer again this week on GDXJ. All ships will rise together in the ongoing bull market.
- These issues can be volatile and that is why I want you to use a disciplined profit taking program, and a disciplined buy program. This allows you to take advantage of market volatility rather than it taking advantage of you!
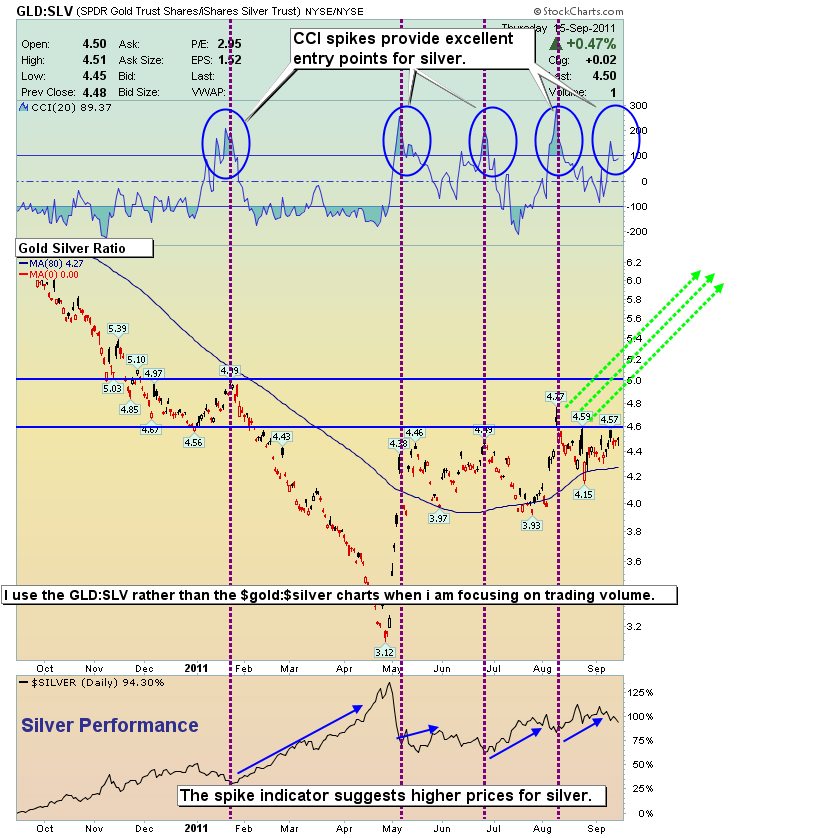
Gold Silver Ratio Spike Chart
- Gold Stocks have now activated the powerful head and shoulders formation. Next up on the launch pad could be silver. I expect silver to trade substantially higher in the next couple of months and this ratio chart is one of the reasons that I believe it happens.
- I highlight the spike indicator this week due to another fresh signal for silver. The returns have been phenomenal on this indicator’s signals for a year. This is also one of the indicators I used to identify the gold stocks bottom in late June.
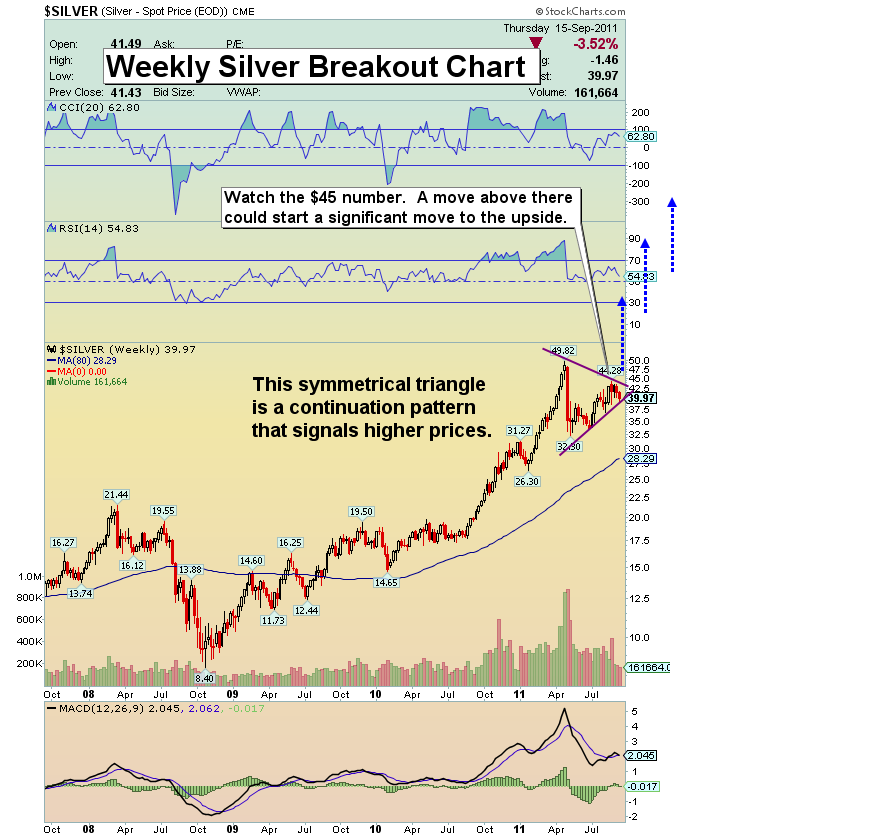
Silver Weekly Chart
- The above chart shows the spike ratio predicting upside action for silver, couple that with this weekly chart and you get an upside explosion. Is the fall season going to be “breakout season” for gold, silver, and gold stocks? My technical work says yes!
Friday, Jul 17, 2026 Super Force Signals Unique Introduction For 321Gold Readers:
Send me an email to admin@supergoldsignals.com and I’ll send you my free “Inflation Thunder Now!” gold and silver stocks video report. I’ll also include 3 of my next Super Force Surge Signals free of charge, as I send them to paid subscribers. Thank you!
|
Stay alert for our Super Gold alerts, sent by email to subscribers,
for both the daily charts on Super Force Signals at www.supergoldsignals.com and for the 60 minute
charts at www.supergoldsignals.com
About Super
Gold Signals:
Our Surge Gold Signals are created thru our proprietary blend
of the highest quality technical analysis and many years of successful
business building. We are two business owners with excellent synergy.
We understand risk and reward. Our subscribers are generally successfully
business owners, people like yourself with speculative funds,
looking for serious management of your risk and reward in the
market.
Frank Johnson:
Executive Editor, Macro Risk Manager.
Morris Hubbartt: Chief Market Analyst, Trading Risk Specialist.
website: www.supergoldsignals.com
email:
admin@supergoldsignals.com
email: admin@supergold60.com
Mail:
1276 Lakeview Drive
Oakville, Ontario, L6H 2M8
Canada
###
Sep 16, 2011
Morris Hubbartt
321gold
Ltd

|
