Super Force Signals - A Leading
Market Timing Service
We Take Every Trade Ourselves
Gold Stocks Have The Spotlight
Morris Hubbartt
Weekly Market Update Excerpt
posted Sep 9, 2011
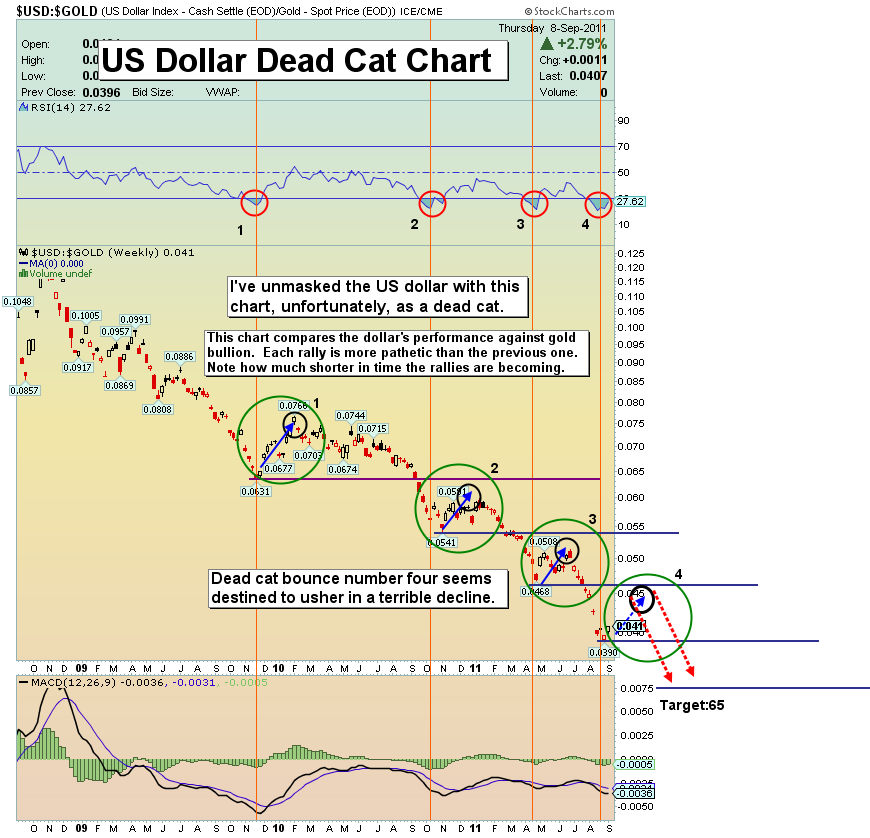
US Dollar Dead Cat Chart
Dollar Commentary
- All fiat currencies appear to be in a race to the bottom. When a nation’s currency is based on the questionable word of a man, rather than real assets of a nation, at minimum, there is a substantial door that opens up for… abuse. Without the fiat currency of the United States government, reckless spending could not have occurred to the degree that we all have lived through, in horror. CNBC seems to want you to believe that gold is a bubble. I think what is happening is an awakening.
- The great gold awakening has begun. The US government keeps spending without pause. Your government’s only solution to the crisis is to have the Federal Reserve monetize more and more debt. These policies could create worldwide inflation. The dollar moved a bit higher on Tuesday, but not due to its own strength. This tiny rally was simply due to another debt crisis, involving the euro! How terrible it is for us all, here in the gold community, to understand that the world’s paper currencies are in a race to zero.
- Technically, the dollar cannot muster even a single fuel cell volume indicator day. My gold to US dollar ratio chart above unmasks the dollar as nothing but a dead cat. Included on this chart is a general projection of the bounce in the dollar. I anticipate the US dollar dead cat rally will peak inside of 6 weeks, and it will be followed by a horrible decline that shocks even seasoned institutional money managers.
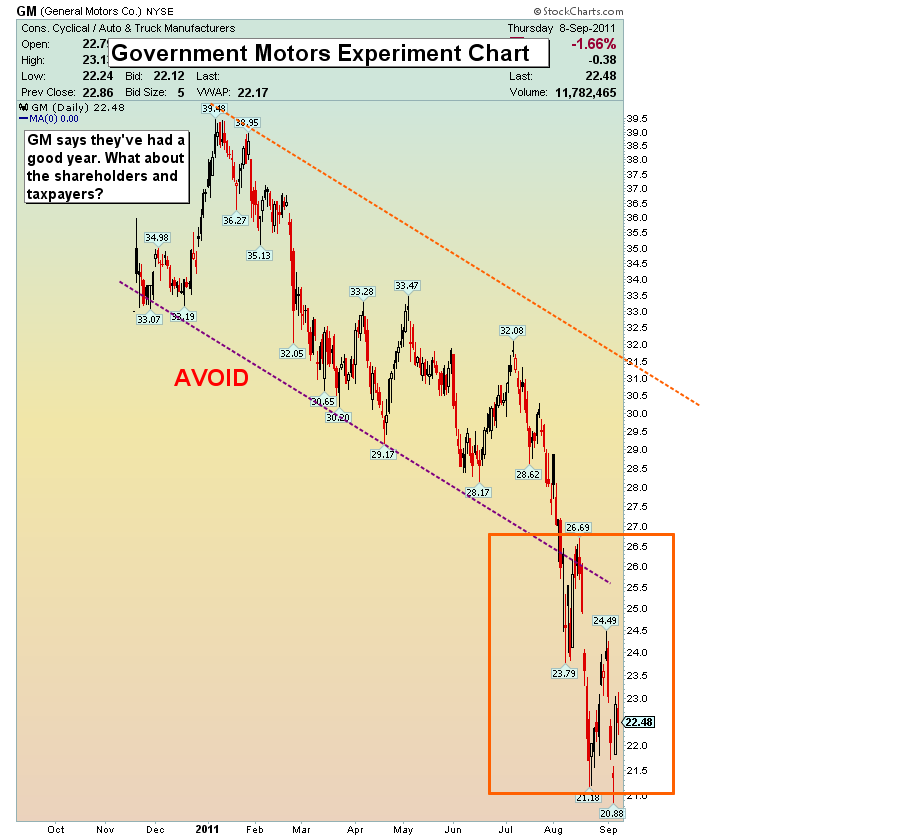
Government Motors Chart
- Here is a glimpse of General Motors in action. One look at the chart says it all; this is yet another situation where the government has intervened to supposedly save us all, and instead destroys the shareholders and bondholders of the company.
- The general chart picture says something is seriously wrong. General Motors is running commercials stating they’ve had a good year. Really? A good year for who, exactly? Certainly not for the shareholders! Soon after the first batch of GM shareholders was wiped out, the new ones are already down about 50%.
- Investors are taking it on the chin, along with taxpayers. There has been a saying in America, and that is, “As GM Goes, So Goes The Nation”. Unfortunately, I see government overstepping and overspending everywhere I look, whether it is at GM, or in the White House itself. Overspending is at the heart of every debt crisis.
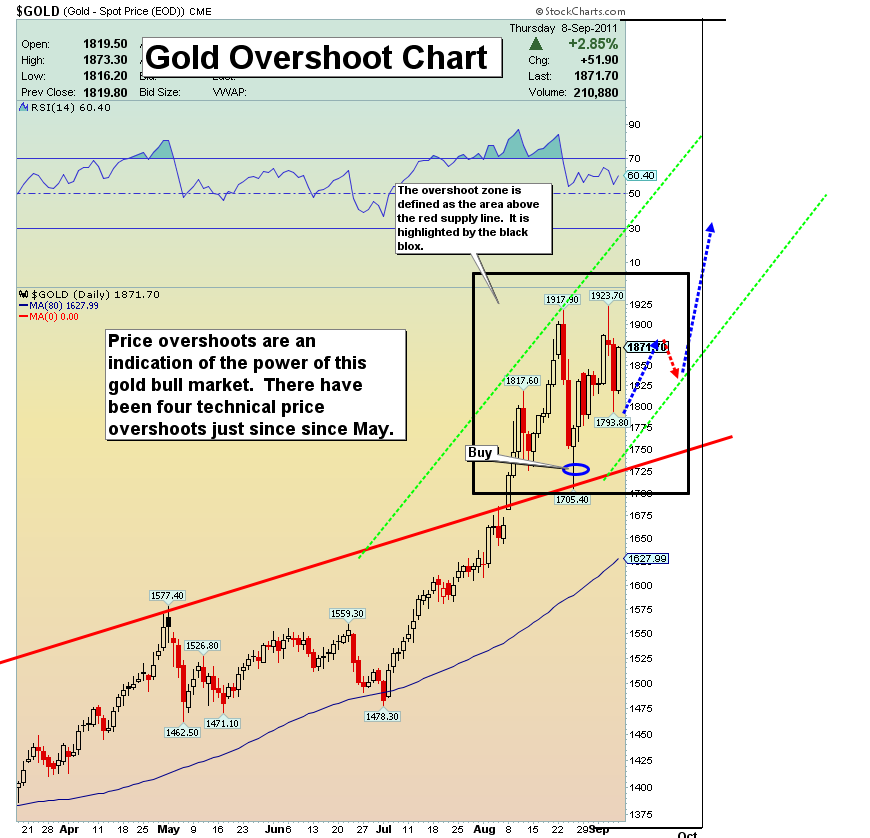
Gold Overshoot Chart
Analysis
- One of the main traits of the gold market for the last few years has been price over-achievement, meaning overshoot of defined technical targets. In this mighty bull market for gold the consistent overshooting of technical targets demonstrates how far price probably has yet to run.
- Tactical action. I see the consolidation I called for last week continuing for the next 2-3 weeks and probably into Oct 1st. The current consolidation is a base building process, and it is extremely necessary, technically. The longer gold holds here, the more pressure is building for a big move, to the upside.
- One of the greatest traders I know told me the other day, “I would rather be a year early than a minute too late”. Don’t play games with timing, if they are games that could take you substantially out of this bull market.
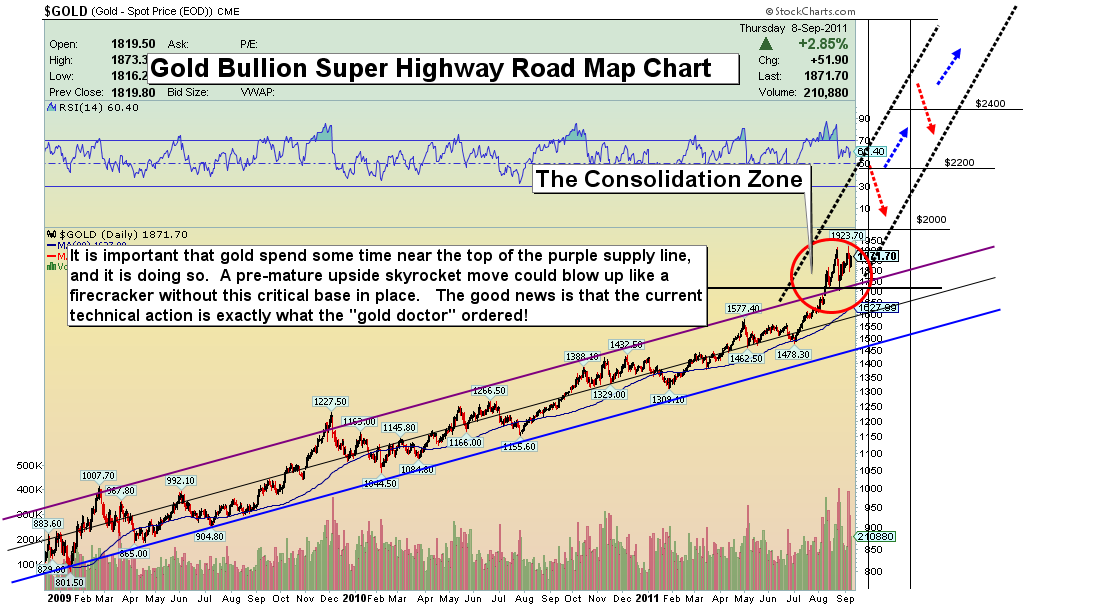
Gold Super Highway Chart
Analysis
- Gold is going global. There is enormous global demand, because gold ownership simply makes common sense. One of the themes I have written about since last spring, when silver went into to backwardation, is the coming shortage of gold. Many institutional money managers are beginning to wonder if the mines coming on line are going to be able to keep up with Asian demand for gold. A huge new Asian gold exchange is scheduled to open by year-end. China’s central bank has stated it intends to buy much more gold in the coming years, as have other banks. Can the mines deliver all that is required? My technical work on the super highway chart suggests the answer is no.
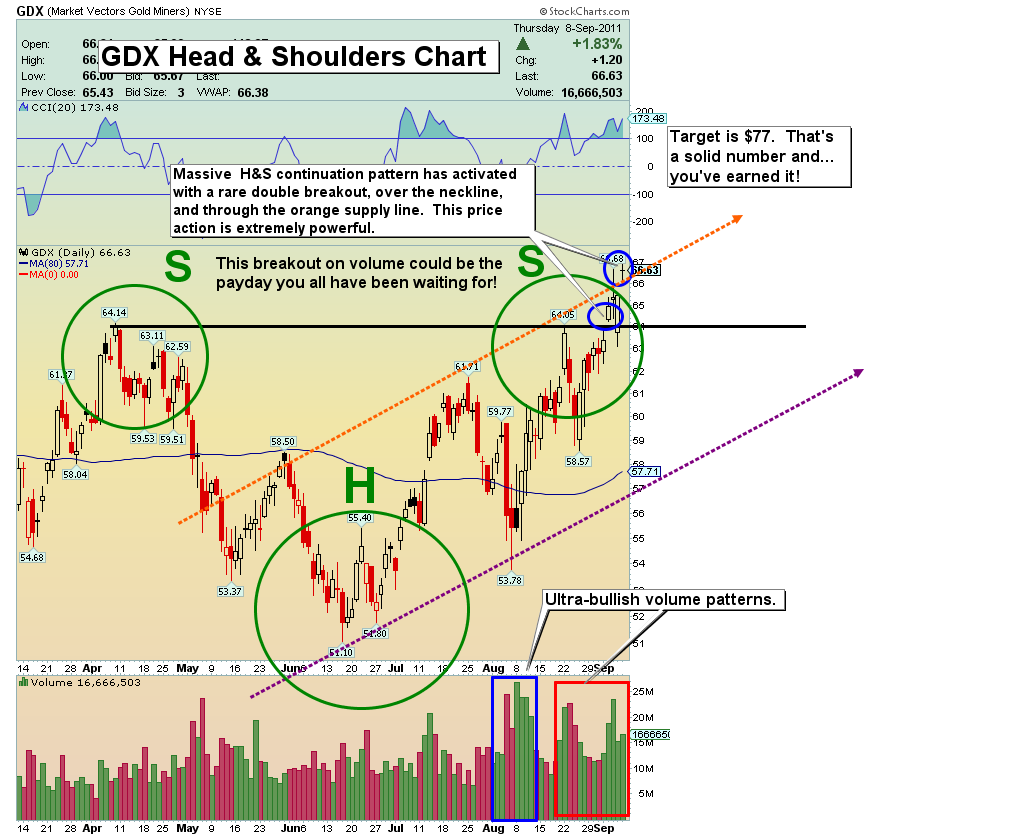
GDX Head and Shoulders Chart
- Inverse head and shouldering formations are now activating on the GDX chart. Not only are they activating, they are doing it on heavy volume. Has the gold community’s long awaited gold stocks pay day finally arrived? I think the answer is yes.
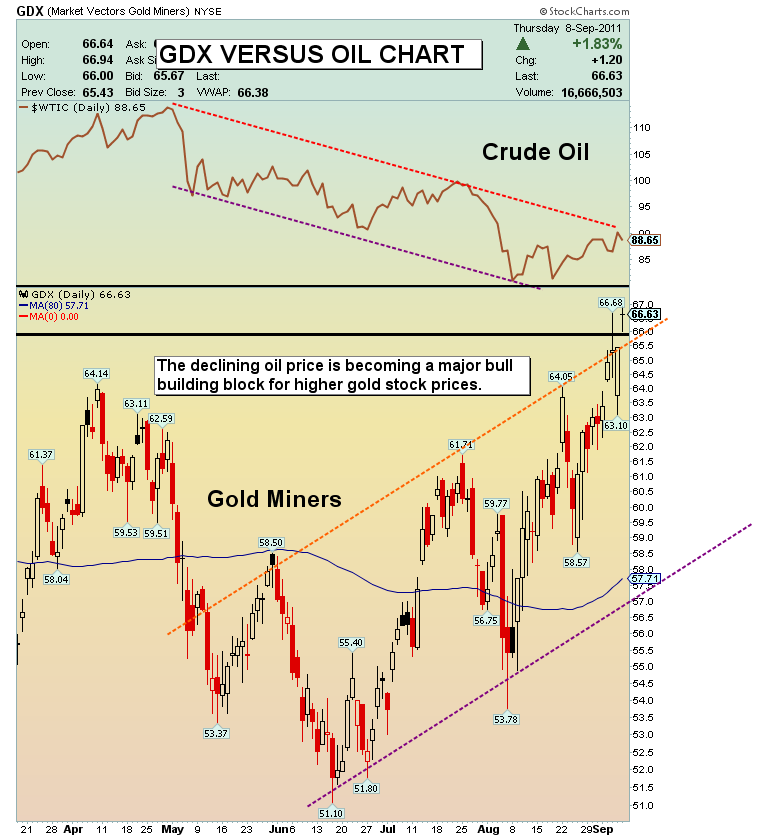
Gold Stocks and Crude Oil
- A very important shift has taken place in the way the gold shares have been trading in relation to the stock market in recent weeks. Until very recently, anytime general equities would get smashed, gold shares would generally be taken down with even greater force. Now, when the general stock market declines, it is not gold stocks, but crude oil, that gets taken down.
- A large underlying expense to mining companies is indeed crude oil. As you can see on the above chart, declining oil prices are now starting to push gold stocks higher. Declining oil and $1800 gold is a very powerful combination of fundamental forces for gold stocks, and I think most analysts are not quite up to speed on just how huge a play is likely at hand.
- The gold stocks upside breakout in this seasonably favorable time of the year is another positive factor to embrace now. Volume is the biggest star of the gold stocks show. Good luck to those shorting these issues; they are likely soon going to smell like burning sulfur. The volume on this move is stellar.
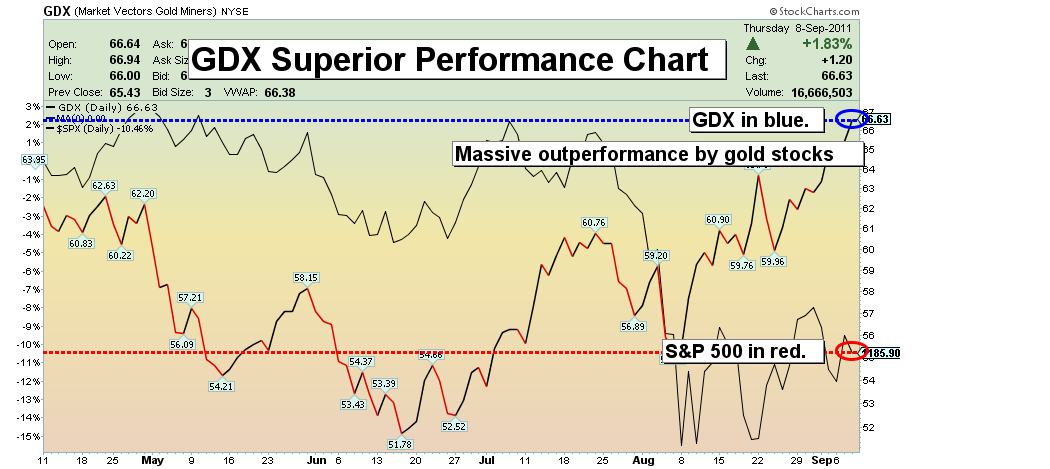
GDX Superior Performance Chart
- Here is a visual picture of the massive outperformance by gold stocks, when compared to the general equity market. I expect the current outperformance of about 12% to increase dramatically if gold rises above $2000.
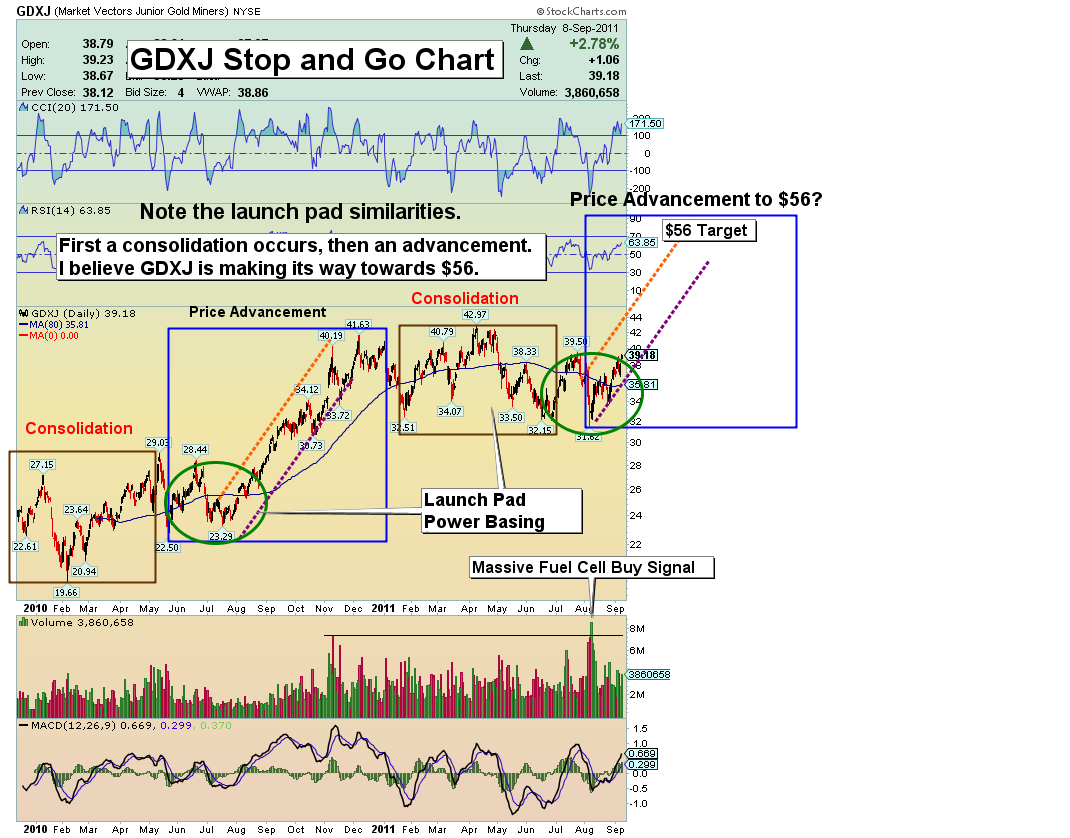
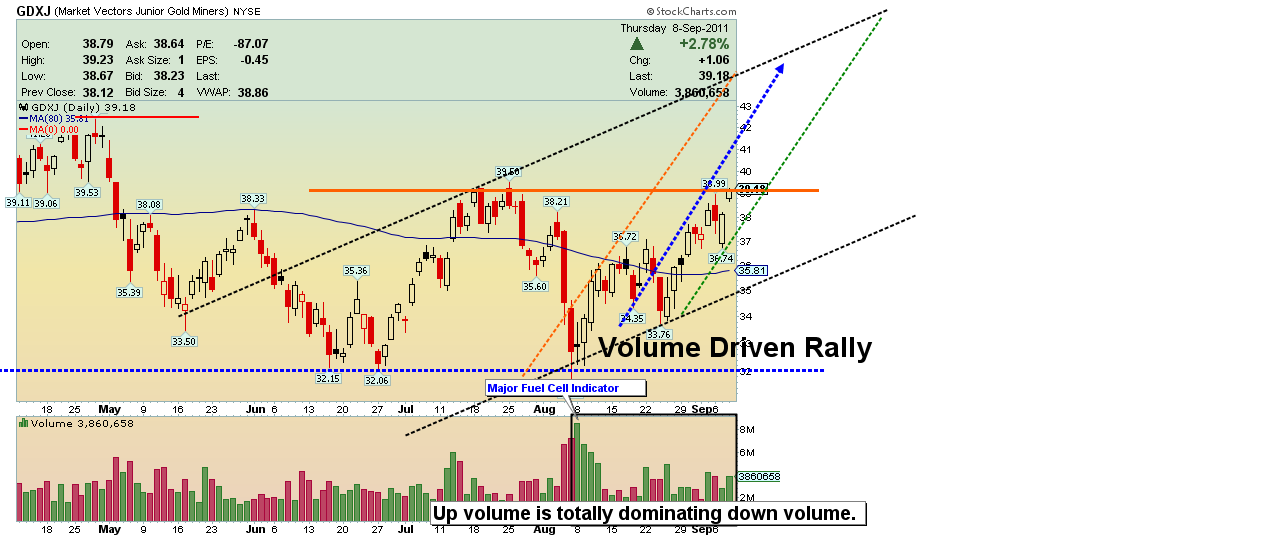
GDXJ Stop & Go Chart
- You won’t see the beautiful inverse head and shoulders pattern on GDXJ that sits on GDX, but there is a volume-driven runway, and that is where I want you to focus all your technical energy today. This type of fuel cell volume is rocket fuel. I am projecting a huge catch rally. In terms of their long term ultimate performance, juniors will likely far surpass that of the gold seniors.
GDXJ Stellar Volume Chart
- The overall health of gold equities is fantastic. At this point, I prefer to see the Generals (GDX) lead, instead of the soldiers (GDXJ). Your juniors will have their day in the sun, as will mine. Let’s leave the great march forward against the dollar in the hands of the generals. Thanks!
Friday, Jul 3, 2026 Super Force Signals Unique Introduction For 321Gold Readers:
Send me an email to admin@supergoldsignals.com and I’ll send you my free “Inflation Thunder Now!” gold and silver stocks video report. I’ll also include 3 of my next Super Force Surge Signals free of charge, as I send them to paid subscribers. Thank you!
|
Stay alert for our Super Gold alerts, sent by email to subscribers,
for both the daily charts on Super Force Signals at www.supergoldsignals.com and for the 60 minute
charts at www.supergoldsignals.com
About Super
Gold Signals:
Our Surge Gold Signals are created thru our proprietary blend
of the highest quality technical analysis and many years of successful
business building. We are two business owners with excellent synergy.
We understand risk and reward. Our subscribers are generally successfully
business owners, people like yourself with speculative funds,
looking for serious management of your risk and reward in the
market.
Frank Johnson:
Executive Editor, Macro Risk Manager.
Morris Hubbartt: Chief Market Analyst, Trading Risk Specialist.
website: www.supergoldsignals.com
email:
admin@supergoldsignals.com
email: admin@supergold60.com
Mail:
1276 Lakeview Drive
Oakville, Ontario, L6H 2M8
Canada
###
Sep 9, 2011
Morris Hubbartt
321gold
Ltd
|
