Super Force Signals - A Leading
Market Timing Service
We Take Every Trade Ourselves
Gold Stocks Meet Doctor Flag
Morris Hubbartt
Weekly Market Update Excerpt
posted Sep 7, 2012
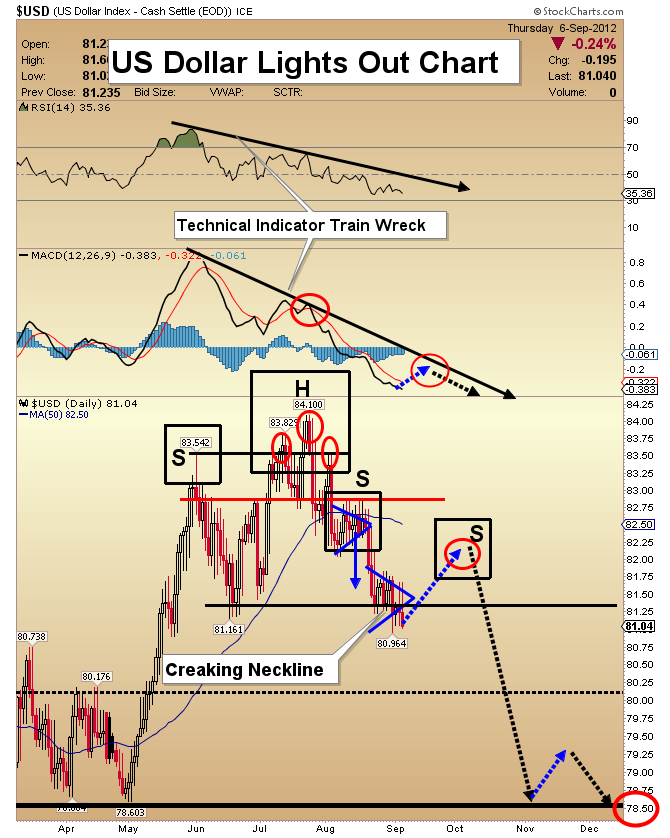
US Dollar Lights Out Chart
- From a technical standpoint, the dollar has now touched my initial downside target. It is probably due for a bounce to as high as USD 82.80.
- That bounce would form a right shoulder of an ominous head & shoulders top pattern. If the dollar doesn’t bounce, the move lower could become violent, and a panic into the metals could occur.
- Note the technical indicators “train wreck”. RSI is drifting aimlessly, and any rally in MACD is likely to halt at the black downtrend line. This is typical action around the right shoulder of h&s top patterns.
- Dr. Bernanke says that QE has worked, and can “work more”. I take his statement to mean that QE3 is likely, and this time it could be open-ended.
- This chapter of QE may be more destructive than previous rounds, both for the US dollar and for the standard of living of many Americans. To protect yourself, you should own precious metals.
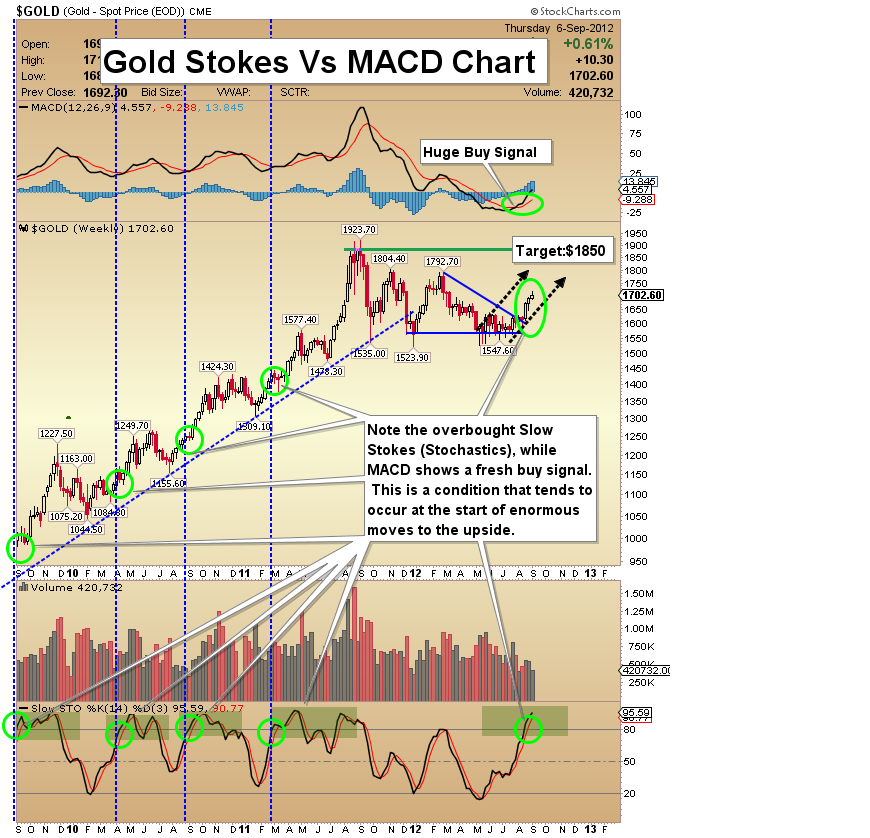
Gold Stokes Versus MACD Chart
- Since May of this year, I have argued that a major bottom would form across the entire precious metals sector. The last two weeks have been quite rewarding, for gold investors.
- MACD on this weekly chart is showing a major buy signal. My “slow stokes” (slow Stochastics indicator) is now overbought, and in the history of this bull market, that tends to occur right before a major advance in the gold price. My intermediate term target is $1850. It should be acquired by November, and possibly sooner.
- The US dollar looks like it could launch a brief counter-trend higher, perhaps for 1-3 weeks. If that happens, the bullish advance in gold would stall. I recommend that active traders book light profits in gold now, on about 5%-10% of your total position.
- Aggressive investors could take a bit more off the table, but keep in mind that gold could shoot higher without giving you a good re-entry point.
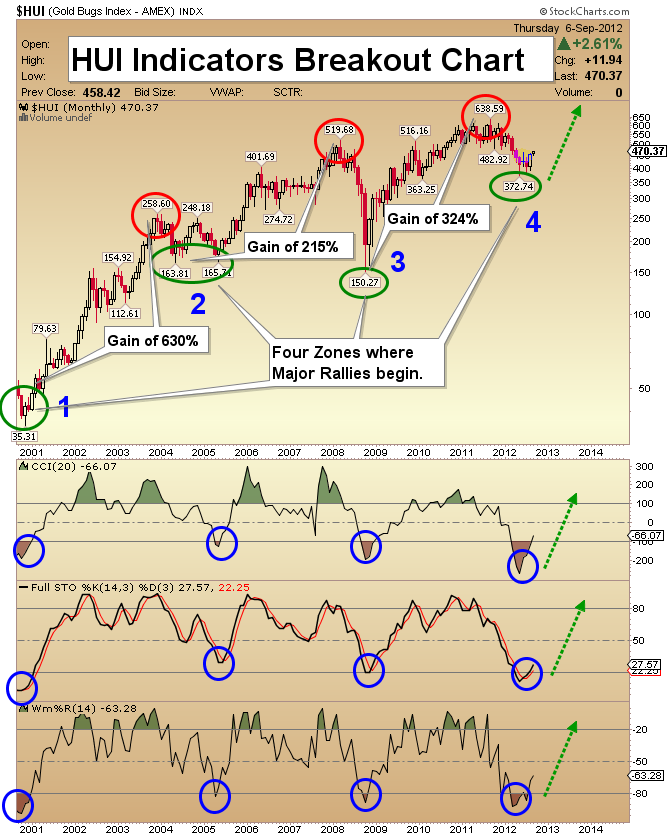
HUI Indicators Breakout Chart
- On this key gold stocks index, all three of the highlighted indicators on the lower portion of the chart are “officially” out of oversold territory. This is a major victory for the bulls! Keep your eye on the gold stocks indicator ball. It looks to be heading much higher.
- If you look closely at the CCI indicator, you can see it shooting upwards, from a low that was even more oversold than the timeframe of 2000-2001.
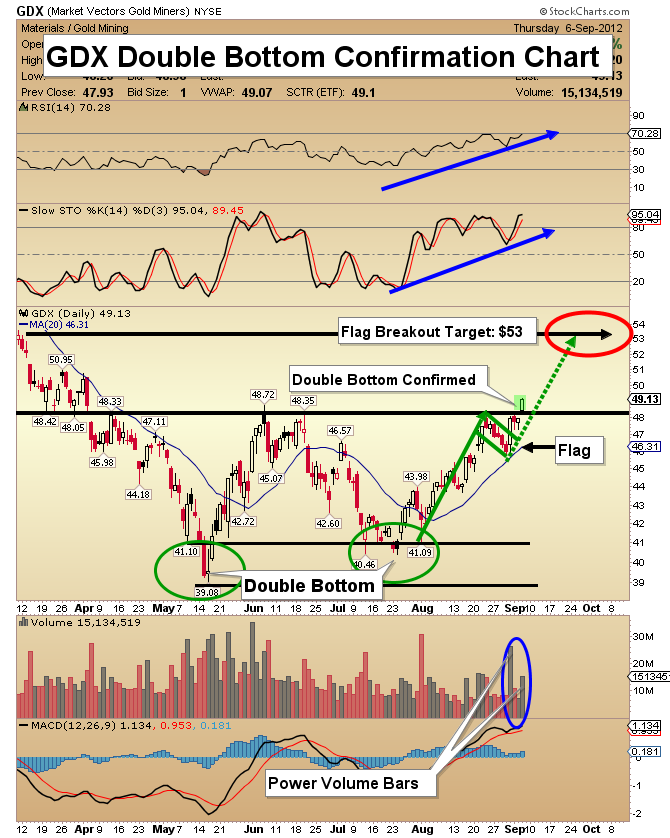
GDX Double Bottom Confirmation Chart
- I believe GDX will acquire my price target of $53, likely by October 1st, based upon current volume patterns, and the highlighted flag pattern breakout.
- While MACD is overbought in the short term, on the weekly and monthly charts, it is flashing powerful buy signals.
- Note the power volume bars on the chart, and the position of MACD, slow stokes, and RSI. Those indicators are following the technical orders of “Doctor Flag”, precisely!
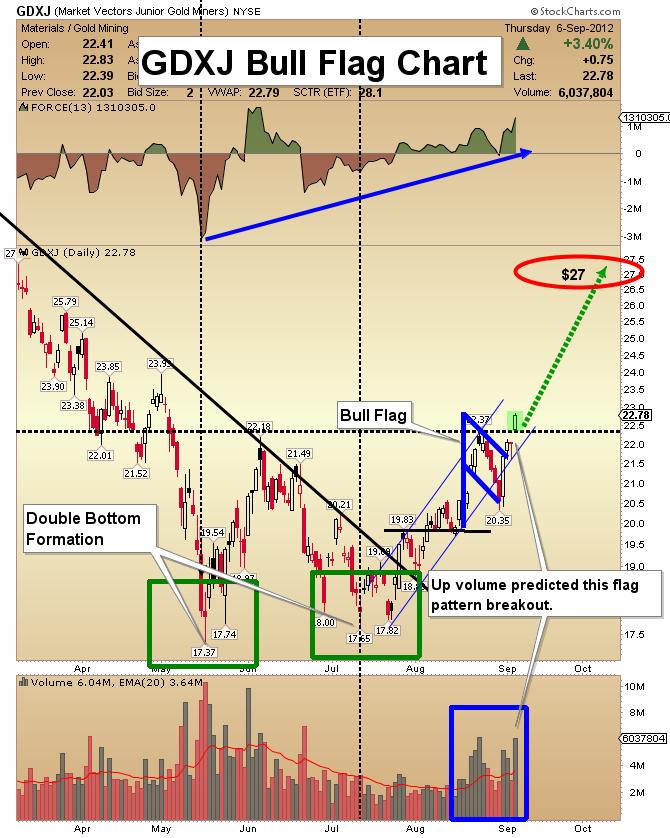
GDXJ Bull Flag Chart
- “Doctor Flag Pattern” is also at work on the GDXJ chart. The highlighted breakout is accompanied by very bullish volume patterns.
- Final confirmation of breakout from the large double bottom formation would be a two-day close over $22.50.
- Once this breakout is confirmed, my target is $27, with a timeframe of the first week of October.
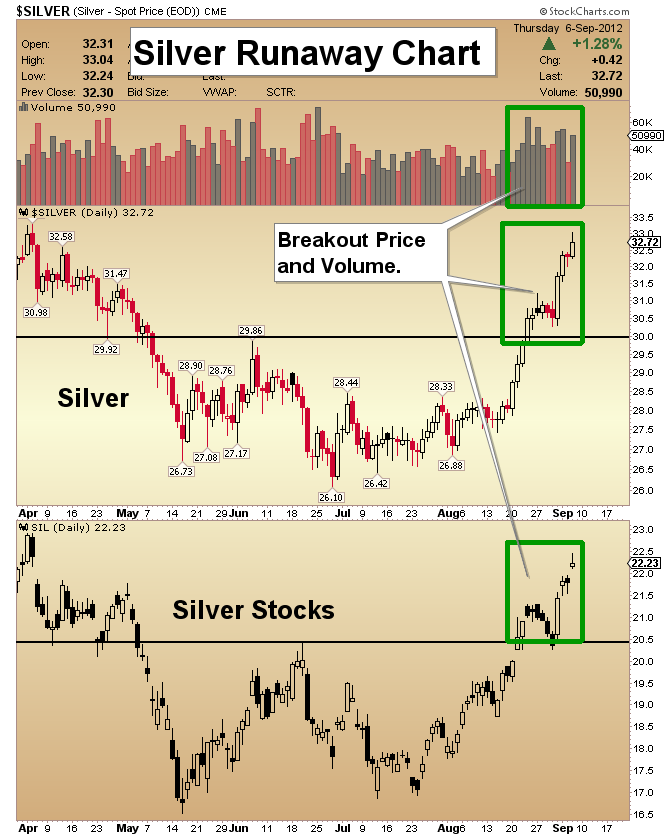
Silver Runaway Chart
- In the last week heavy accumulation has occurred in the silver market. Momentum-based trading funds are replacing the commercial group as the key price driver.
- This type of liquidity flows pattern is similar to 2008, when silver traded under $10. From the lows of 2008, the price of silver rose towards $50. Silver has been my favorite sector for months, and patient investors are beginning to get rewarded.
- Note the action of silver stocks at the bottom of the chart, via the silver stocks ETF. Silver, and especially silver stocks, are “runaway leaders” in this rally.
- All pullbacks towards the $20.50 price area on this ETF should be bought aggressively!
Friday, Jul 3, 2026 Super Force Signals Unique Introduction For 321Gold Readers:
Send me an email to admin@supergoldsignals.com and I’ll send you my free “Inflation Thunder Now!” gold and silver stocks video report. I’ll also include 3 of my next Super Force Surge Signals free of charge, as I send them to paid subscribers. Thank you!
|
Stay alert for our Super Gold alerts, sent by email to subscribers,
for both the daily charts on Super Force Signals at www.supergoldsignals.com and for the 60 minute
charts at www.supergoldsignals.com
About Super
Gold Signals:
Our Surge Gold Signals are created thru our proprietary blend
of the highest quality technical analysis and many years of successful
business building. We are two business owners with excellent synergy.
We understand risk and reward. Our subscribers are generally successfully
business owners, people like yourself with speculative funds,
looking for serious management of your risk and reward in the
market.
Frank Johnson:
Executive Editor, Macro Risk Manager.
Morris Hubbartt: Chief Market Analyst, Trading Risk Specialist.
website: www.supergoldsignals.com
email:
admin@supergoldsignals.com
email: admin@supergold60.com
Mail:
1276 Lakeview Drive
Oakville, Ontario, L6H 2M8
Canada
###
Sep 7, 2012
Morris Hubbartt
321gold
Ltd

|
