Super Force Signals - A Leading
Market Timing Service
We Take Every Trade Ourselves
Gold Surprises Both Bulls & Bears
Morris Hubbartt
Weekly Market Update Excerpt
posted Sep 2, 2011
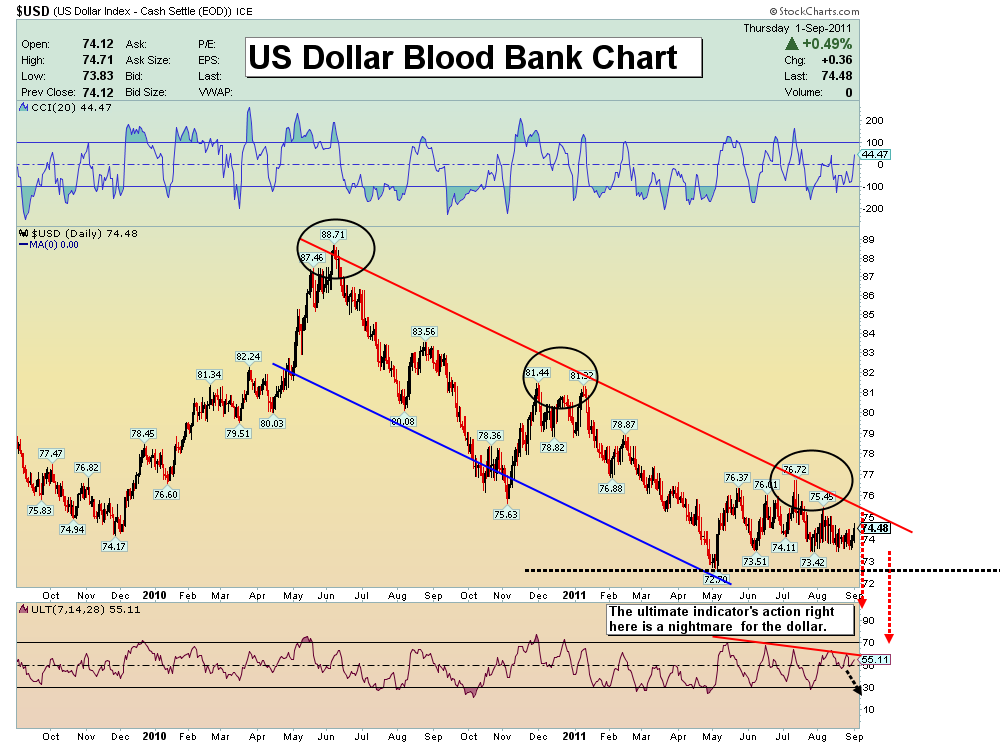
US Dollar Blood Bank Chart
Dollar Commentary
- The safe haven status for the dollar is nearly one for the history books. All rally attempts have fizzled. The technical situation is deteriorating daily. The dollar is in the early stages of having its coveted world reserve currency status destroyed. Holders of the currency are not interested in seeing their money diluted away, but that’s exactly what is happening.
- I want you to focus on the valuable Ultimate Oscillator I have annotated in the above chart. I use this indicator primarily to predict dollar downtrends. It is indicating that a serious decline in the dollar is near.
- The dollar is in trouble on a number of levels. Fundamentally, the debt is a disaster, and technically the dollar is a train wreck. My charts target the $65 area in the coming months.
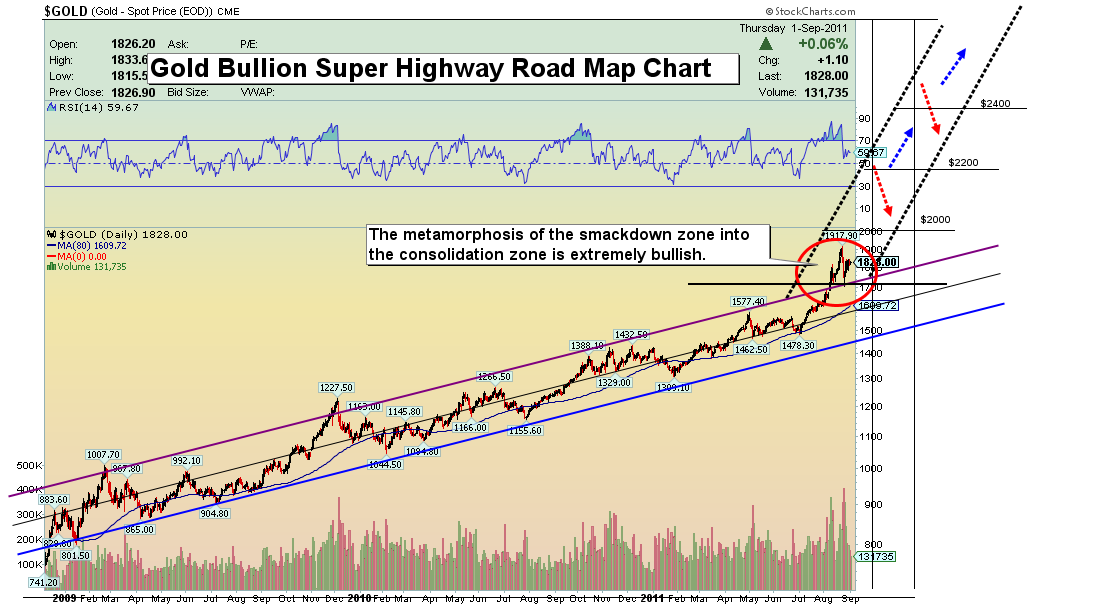
Gold Super Highway Road Map Chart
Gold Analysis
- This is not your average gold bull market. The gold bull is about a nation’s life change unfolding before your eyes. Gold is a part of the day of debt reckoning. Sell your gold at your own peril. Bernanke spoke last Friday, and the gold correction ended faster than it started! That action indicates that additional monetary stimulus is likely coming.
- Powerful volatility is now a key theme of this gold bull market. I have warned about this since the “Gold Superhighway” was opened up, on the rise in the gold price above the status quo up channel. That epic event occurred around Aug 8th. The recent correction has been healthy, making the gold pull even stronger.
- The weak longs were snuffed out into $1700, and strong hands reloaded positions. I issued new buys at around $1713 in gold, silver and gold shares, and your positions have been quickly rewarded.
- I view the smack down correction as one already in the history book. What I look for now is a consolidation period that will likely last a few weeks, which may surprise both bulls and bears, who want more action right now. I believe this consolidation period will build a new solid base and widen the gold trading channel’s supply and demand lines. In plain English, the surprise consolidation will prepare gold bull for an explosive move upwards.
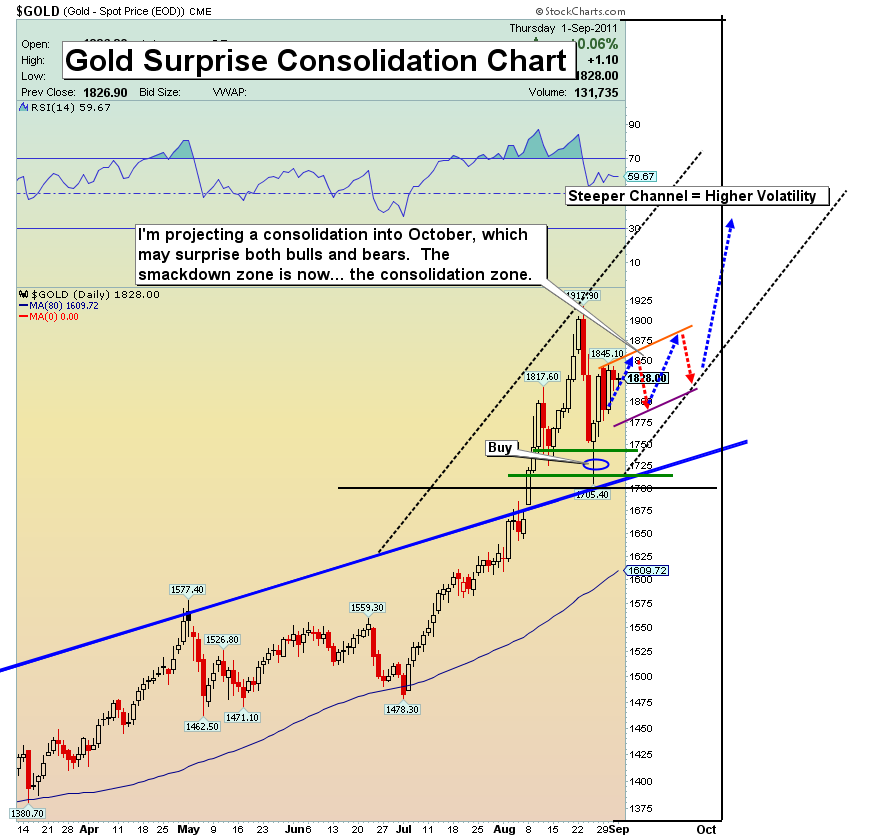
Gold Surprise Consolidation Chart
- After asking you to buy right into the recent $1700 lows, I want you to understand that I am looking for this base building consolidation to continue until October 1st. As bullish or bearish as you may be, I think you’ll be stunned that gold continues to surprise! Understand that sideways action for thirty days only helps the bull market, and helps you.
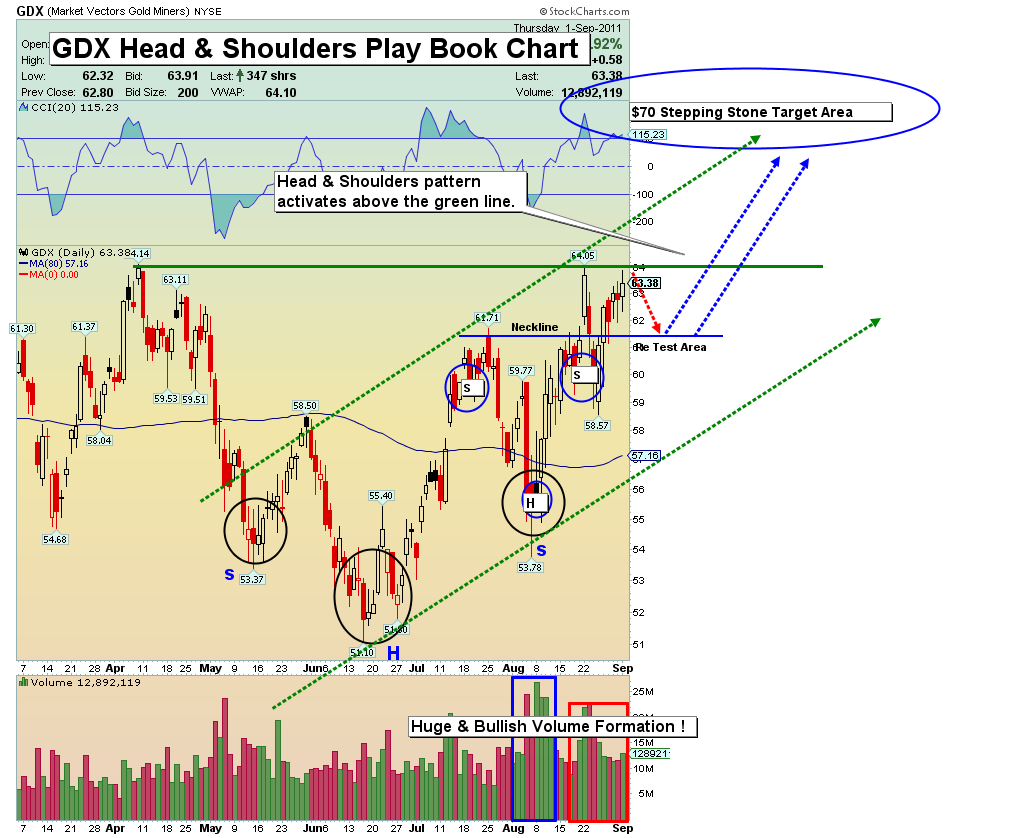
GDX Head and Shoulders Play Book Chart
- The Wall Street chatter is about gold and silver being in a bubble. Well, they’re about to get a huge surprise. I’m projecting surprisingly explosive upside action in the gold stocks. It takes patience to see the fundamentals begin to overrule trading patterns. You are finally starting to see gold stocks offer the kind of return you have been waiting on for many years.
- The head and shouldering action on the above chart is classic “wall of worry” building. Inverse head and shoulders patterns that develop in a bull market are a picture of the fears of traders being worked off. Every time the market moves up, buyers step in, only to see price decline and disappoint. The buyers become sellers, accelerating the move lower.
- That head and shouldering picture is exactly what has been happening to gold stocks. Unfortunately the majority of those traders using stop losses lose their positions and the huge potential profits. Selling price declines - in a market that has a tremendously strong fundamental backdrop - almost amounts to financial suicide.
- The most important thing to do now is hold on tight to large portions of your gold stocks portfolio. I recommend a 65% core position. Don’t trade out these core positions because a massive pay day is coming for you.
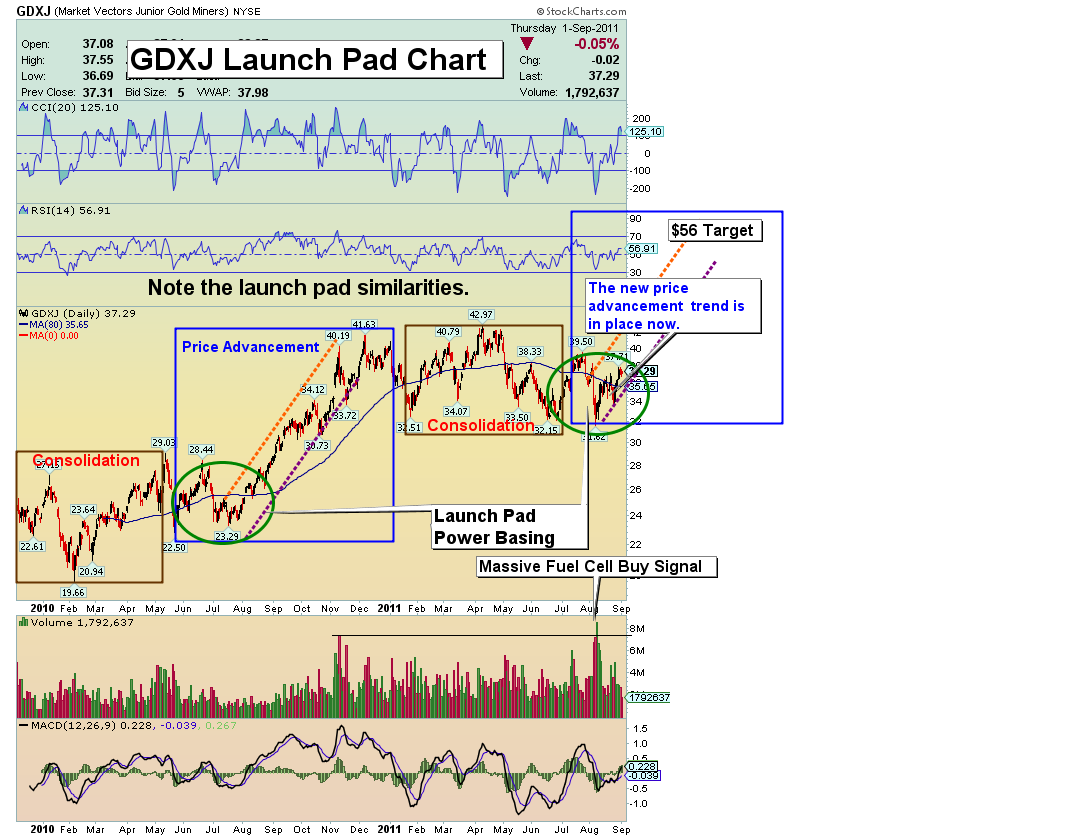
GDXJ Launch Pad Chart
- The above chart is a compelling reason to own a large position in this diversified gold juniors fund, GDXJ. We are entering a period when price advancement is the theme, and action. I’ve highlighted similarities between the current “power basing” and that which preceded the move last year.
- The power base this time hints that the price advancement phase will have much more intensity than last year. Volume patterns are greatly improved. Last year, price basically doubled. In the short term, it is slightly overbought and likely to pullback. I expect the pullback to be minor, but remember that the juniors sector is extremely volatile. I asked subscribers to buy into last week’s lows and I’m suggesting you book a little profit here, after a beautiful 9% run up in price. Don’t trade out any core positions, please, not even one share!
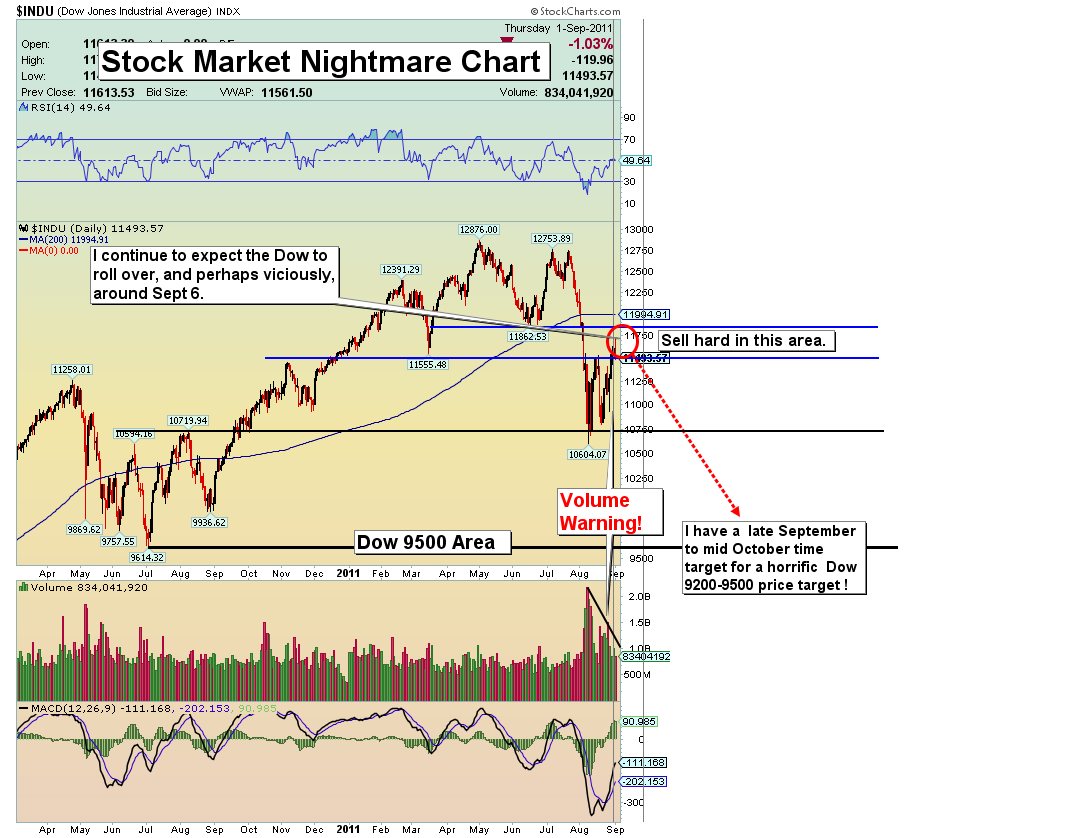
Stock Market Nightmare Chart
- I projected a relief rally that would carry the market to early September, and then “look out below”! It’s early September now, and I see no reason to change my projection of a serious price decline in the Dow.
- My key upside target area has been 11,700 on the Dow, and that target was acquired Thursday. Now is a time to be very cautious if you are a stock market investor. I expect the Dow to fall below 10,000 on this down move, so my suggestion to you has to be to stay with gold, silver, and precious metals equities. Avoid the stock market. An immediate and severe decline appears to be beginning.
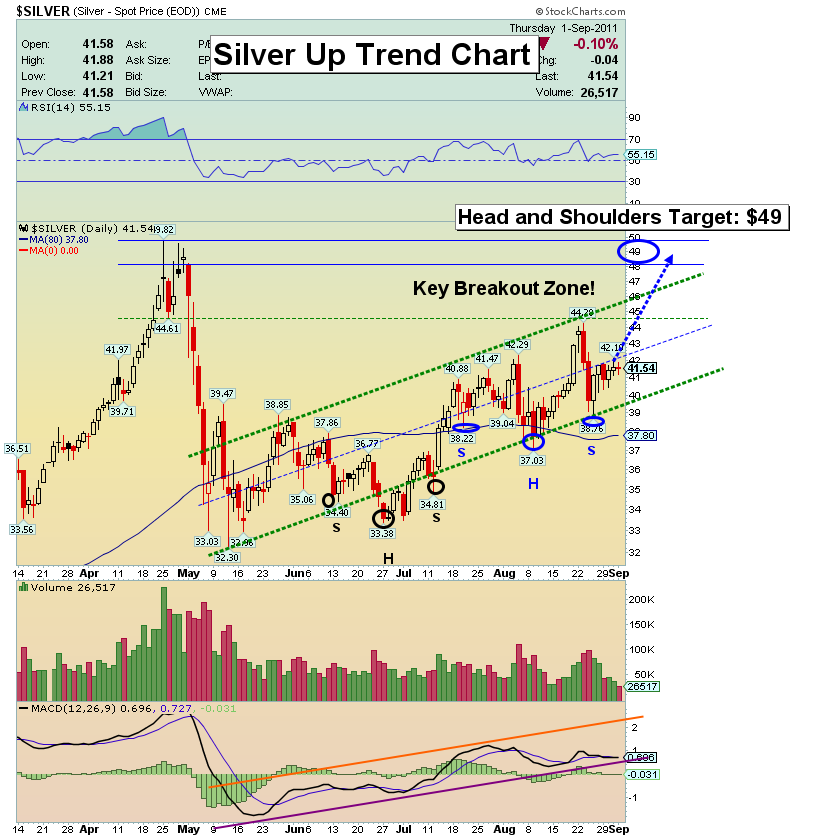
Silver Up Trend Chart
- The large short positions that exist on the COMEX are probably mainly metals dealers selling inventory forwards. The commercials are carrying 48,000 longs, according to the latest COT report. That’s a solidly bullish number.
- Technically, this market feels like a coiled snake ready to strike much higher, and the twin head & shoulders pattern I’ve annotated on the above chart could well be the technical fuel that finally pushes silver above $50.
- Accumulate the silver bullion asset now, because the potential for a sort of “cornucopia of price advancement” seems very real. If you are light on physical silver, my suggestion is to get it bought, while this short consolidation period is here!
- In this gold bull market, gold has traded to a price that is more than 100% above its previous bull market high of approx. $887. Silver has not even traded above its previous bull market high. If silver were to simply match gold’s performance, it could mean silver is going to $100 an ounce.
- While anything can go wrong, I think the head and shouldering action, the bullish COT reports, and the enormous lag against gold are three great reasons to take a serious look at this mighty metal!
Friday, Jul 3, 2026 Super Force Signals Unique Introduction For 321Gold Readers:
Send me an email to admin@supergoldsignals.com and I’ll send you my free “Inflation Thunder Now!” gold and silver stocks video report. I’ll also include 3 of my next Super Force Surge Signals free of charge, as I send them to paid subscribers. Thank you!
|
Stay alert for our Super Gold alerts, sent by email to subscribers,
for both the daily charts on Super Force Signals at www.supergoldsignals.com and for the 60 minute
charts at www.supergoldsignals.com
About Super
Gold Signals:
Our Surge Gold Signals are created thru our proprietary blend
of the highest quality technical analysis and many years of successful
business building. We are two business owners with excellent synergy.
We understand risk and reward. Our subscribers are generally successfully
business owners, people like yourself with speculative funds,
looking for serious management of your risk and reward in the
market.
Frank Johnson:
Executive Editor, Macro Risk Manager.
Morris Hubbartt: Chief Market Analyst, Trading Risk Specialist.
website: www.supergoldsignals.com
email:
admin@supergoldsignals.com
email: admin@supergold60.com
Mail:
1276 Lakeview Drive
Oakville, Ontario, L6H 2M8
Canada
###
Sep 2, 2011
Morris Hubbartt
321gold
Ltd
|
