Super Force Signals - A Leading
Market Timing Service
We Take Every Trade Ourselves
Gold Stocks Trigger Time
Morris Hubbartt
Weekly Market Update Excerpt
posted Aug 31, 2012
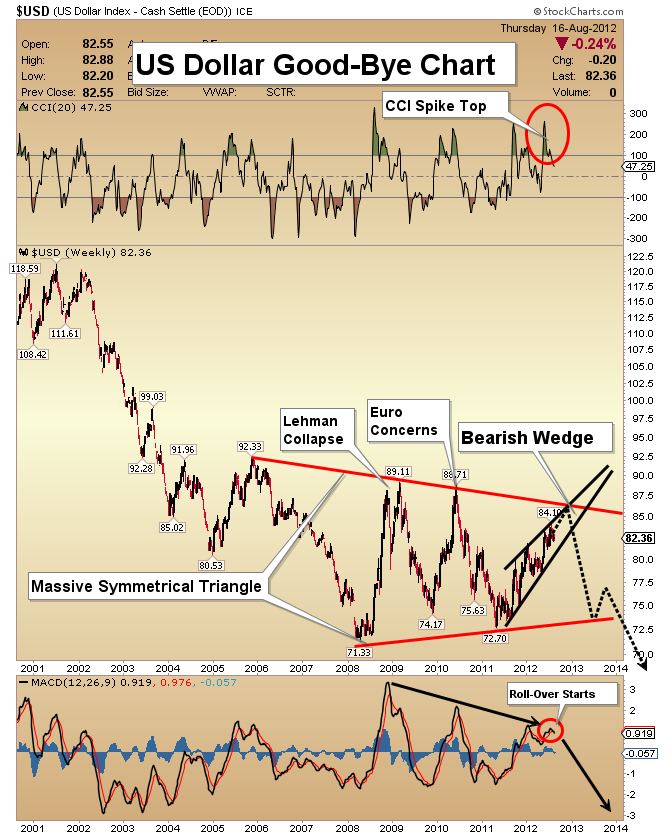
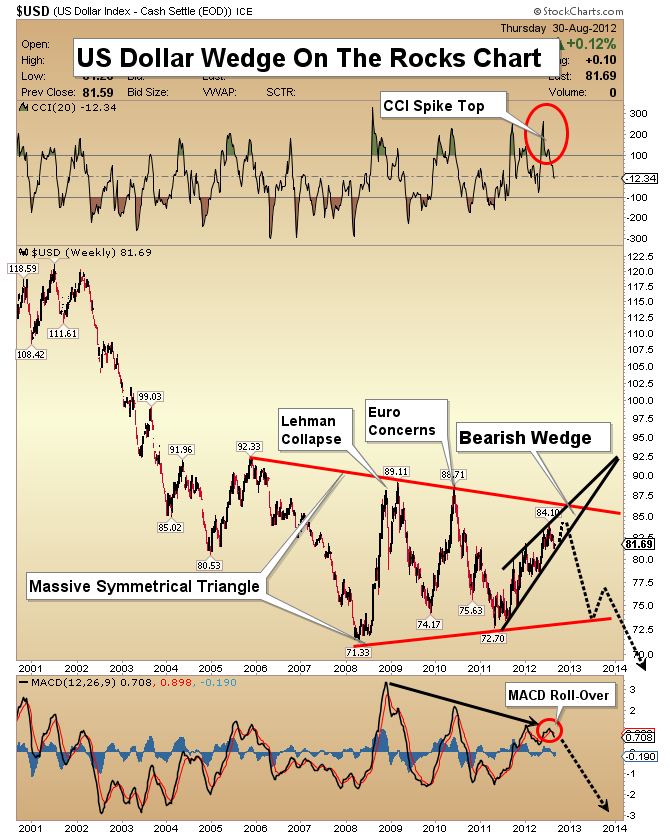
US Dollar Wedge On The Rocks Chart
- Technically, the US dollar could bounce as high as 82.80, but from there I expect a major decline. The dollar is trading in a bearish wedge formation within an immense symmetrical triangle. As it falls through the bottom of the wedge, the decline could turn into a crash.
- My analysis suggests that a one-week close under the lower line of the wedge would create a target of 74.
- The dollar is held in savings accounts all across the country. It is the dollar that is created out of thin air to purchase bonds. Quantitative easing is largely responsible for the inability of the dollar to rally strongly, even in the face of the raging crisis in Europe.
- QE3 is likely to result in lower priced fiat currencies, bonds that “tread water”, and gold that is strongly higher.
Gold and Bond Correlation Chart
- I’m projecting a 15% correction for the T-bond against the dollar, and a catastrophic decline against gold.
- Note the substantial non-confirmation in play on the MACD indicator. While the bond has rallied, MACD has declined.
- The ominous wedge pattern suggests that a decline to 136 could happen very quickly.
- At these price levels, aggressive investors could short the T-bond.
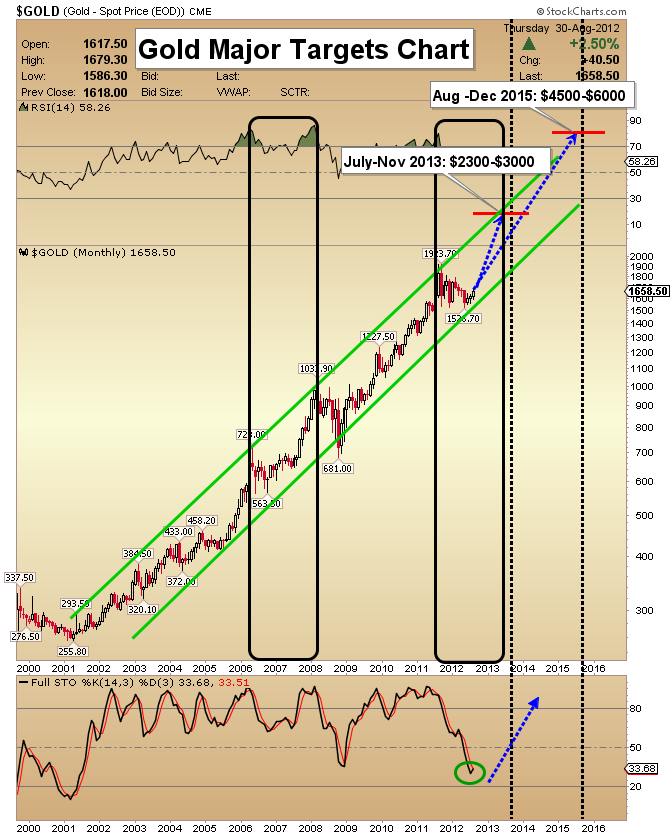
Gold Major Targets Chart
- After many months of corrective action and strong commercial “smart money” support, the gold bull market has probably started a major move to the upside.
- There is a strong chance of a more radical price trajectory developing in the coming months. I’ve referred to it as a “superhighway”. It would be created on the chart by accelerated institutional buying. The superhighway event was probably delayed by the euro crisis, but it seems more likely now.
- My year-end target for 2012 is $1850. By March of 2013, I expect $2300 should be acquired, and $3000 by December.
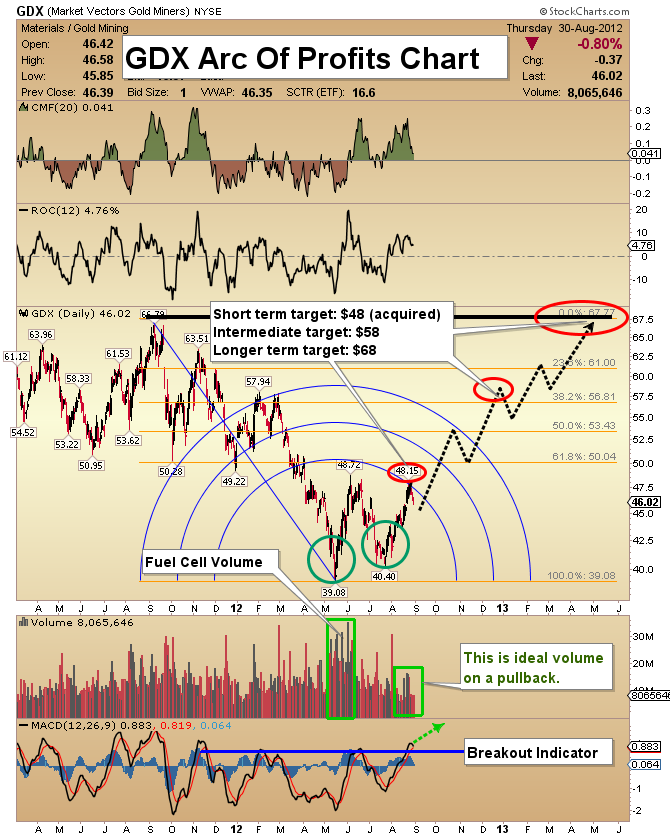
GDX Arc Of Profits Chart
- GDX rallied 19% from the 2nd low of the double bottom pattern, and acquired my initial price target. For the past week or so, it has been pulling back on subdued volume.
- As some technical indicators start to look overbought, they can remain so for months. I think that will be the case with GDX for quite a long time.
- The MACD indicator has traded above a number of previous peaks, indicating this rally is not done. While it has rallied, MACD is still barely above the zero line, and can go much higher!
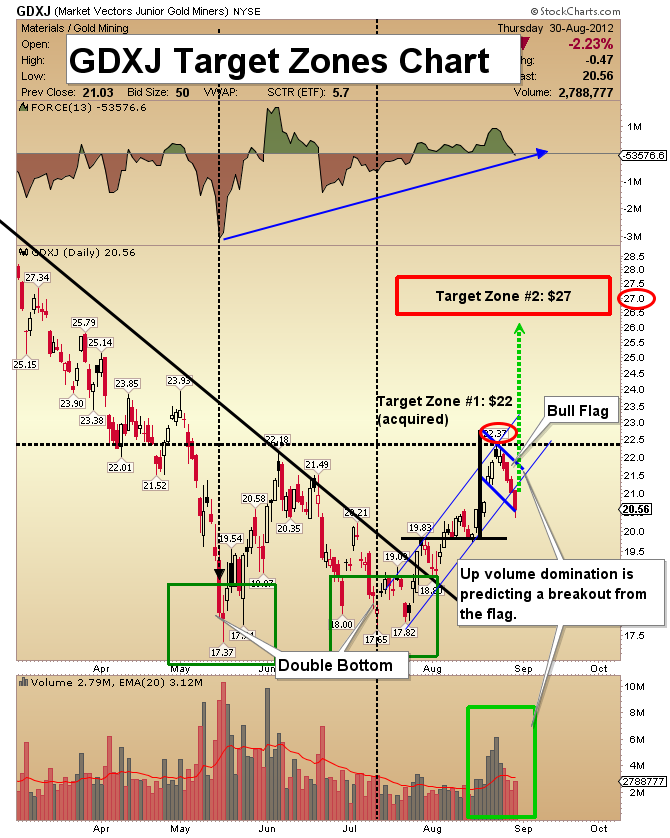
GDXJ Bull Flag Chart
- This GDXJ chart is displaying a bullish flag formation. Volume patterns indicate that a sharp move higher is imminent.
- Once a breakout from the flag occurs, my next target is $27. The “trigger number” for the double bottom pattern is $22.18, and the flag could be viewed as an itchy finger on that trigger!
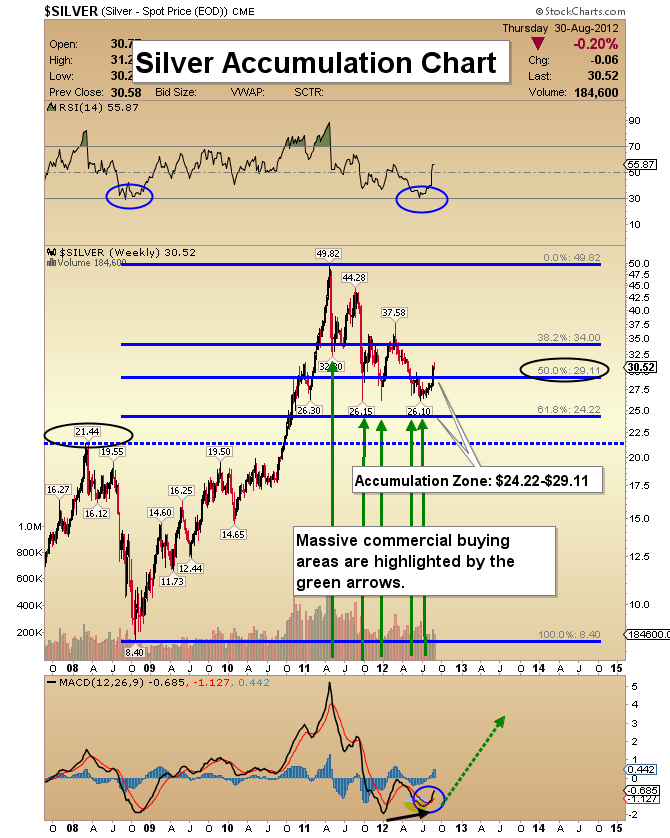
Silver Accumulation Chart
- Note the great progress made by silver in recent weeks. The 50% bull market retracement level at $29.11 has been re-captured.
- Throughout most of the corrective period, commercial traders have purchased silver repeatedly, and I’ve advised readers to buy in the $24.22-$29.11 price range.
- RSI turned sharply higher, indicating great underlying strength in this market.
- MACD never made a new low when silver did, at $26.10. This key indicator is now flashing a major buy signal for silver investors!
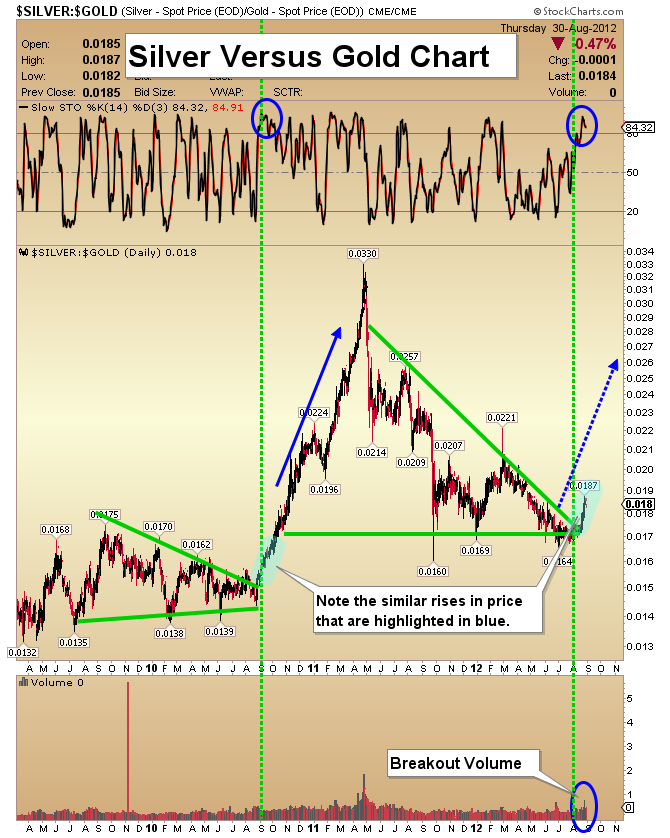
Silver Versus Gold Chart
- Silver has started to outperform gold. Note the great similarity between the current price action, and the last major breakout in silver.
- In the fall of 2010, the “slow stokes” (Stochastics indicator) became overbought. Many investors thought a top was occurring and sold.
- The slow stokes gyrated between 50 and 90, while silver kept advancing. I believe we are entering another period like that now.
- Silver is breaking out on heavy volume, which gives the rally staying power!
Friday, Jul 10, 2026 Super Force Signals Unique Introduction For 321Gold Readers:
Send me an email to admin@supergoldsignals.com and I’ll send you my free “Inflation Thunder Now!” gold and silver stocks video report. I’ll also include 3 of my next Super Force Surge Signals free of charge, as I send them to paid subscribers. Thank you!
|
Stay alert for our Super Gold alerts, sent by email to subscribers,
for both the daily charts on Super Force Signals at www.supergoldsignals.com and for the 60 minute
charts at www.supergoldsignals.com
About Super
Gold Signals:
Our Surge Gold Signals are created thru our proprietary blend
of the highest quality technical analysis and many years of successful
business building. We are two business owners with excellent synergy.
We understand risk and reward. Our subscribers are generally successfully
business owners, people like yourself with speculative funds,
looking for serious management of your risk and reward in the
market.
Frank Johnson:
Executive Editor, Macro Risk Manager.
Morris Hubbartt: Chief Market Analyst, Trading Risk Specialist.
website: www.supergoldsignals.com
email:
admin@supergoldsignals.com
email: admin@supergold60.com
Mail:
1276 Lakeview Drive
Oakville, Ontario, L6H 2M8
Canada
###
Aug 31, 2012
Morris Hubbartt
321gold
Ltd

|
