Super Force Signals - A Leading
Market Timing Service
We Take Every Trade Ourselves
Gold Gets Stoked
Morris Hubbartt
Weekly Market Update Excerpt
posted Aug 24, 2012
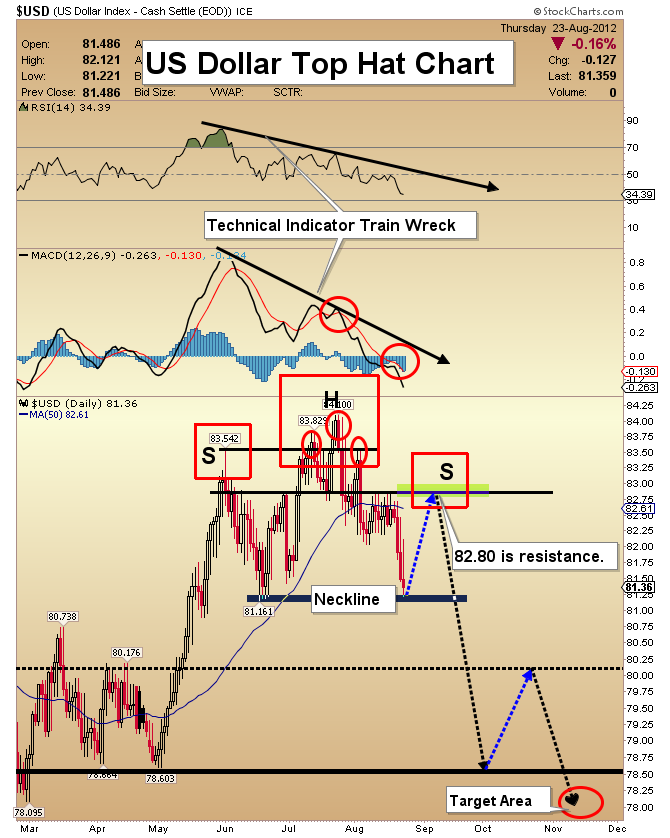
US Dollar Top Hat Chart
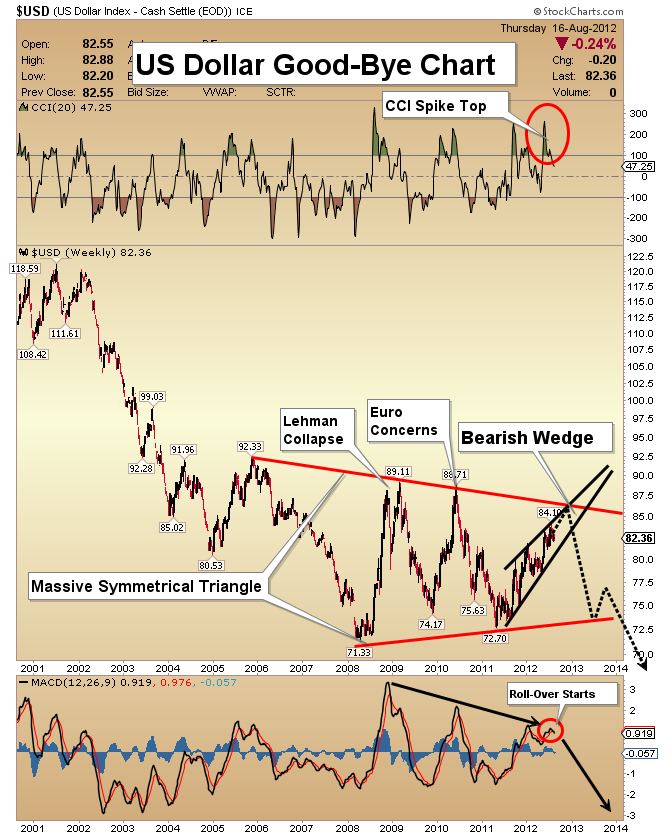
- This crisis has created a “fear bubble”. Each time there is bad news, massive amounts of capital flow into the US dollar and Treasury bonds.
- Worldwide, there is only about 1% as much gold as fiat currency. Money is being debased at a record rate. One of my themes for months has been, “there is no currency at greater risk than the US dollar”.
- Major tops in markets are normally created by overwhelming bullishness. But the tops that I see in the dollar and the bond are based on the misguided belief that the dollar is absolutely safe.
- The trigger event could be a realization that the United States is at the mercy of our creditors, because of un-payable debt obligations. At that point a panic would likely occur.
- I have predicted that a head & shoulders top pattern would form on the dollar at current price levels, and that appears to be in play now. Note the neckline area around 81.16.
- It appears likely that a small rally occurs now, taking the dollar to around 82.80. From there, I expect a major collapse in the dollar to begin.
- I call this technical pattern a “top hat”. Please note that the head of the pattern is itself a small head & shoulders top.
- The RSI and MACD indicators look like a train wreck. Their situation adds weight to the premise that the dollar is making a significant top right here.
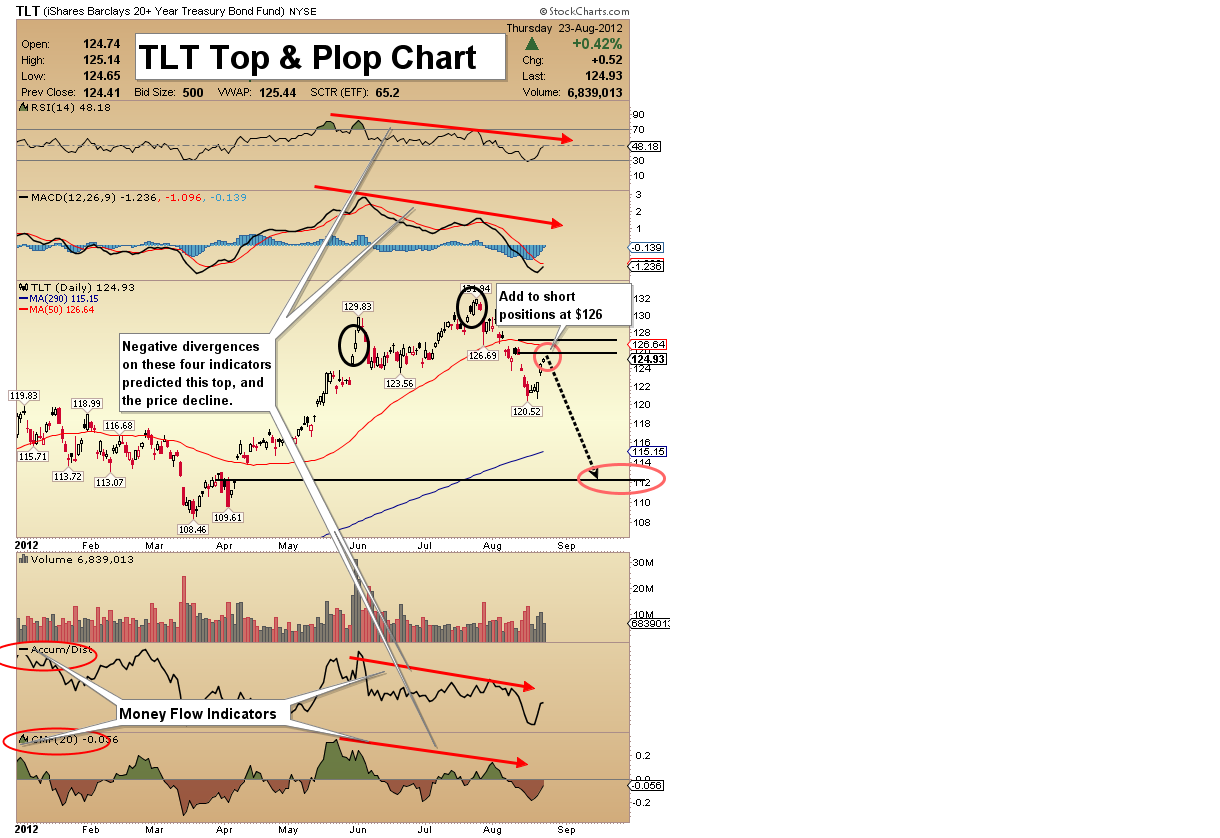
TLT (T-Bond Proxy) Top & Plop Chart
- The bond chart is becoming very bearish. The weak-volume rally that I projected has taken TLT close to resistance at $126. Aggressive investors can add to short positions in that price area.
- Ben Bernanke cannot be very happy when he looks at the chart of the bond market. The lower the bond goes, the stronger the case for immediate QE3 becomes. Dr. Bernanke has categorically stated that he will maintain low interest rates until 2014.
- To achieve that Fed mandate, he must buy US T-bonds if market participants are causing prices to fall.
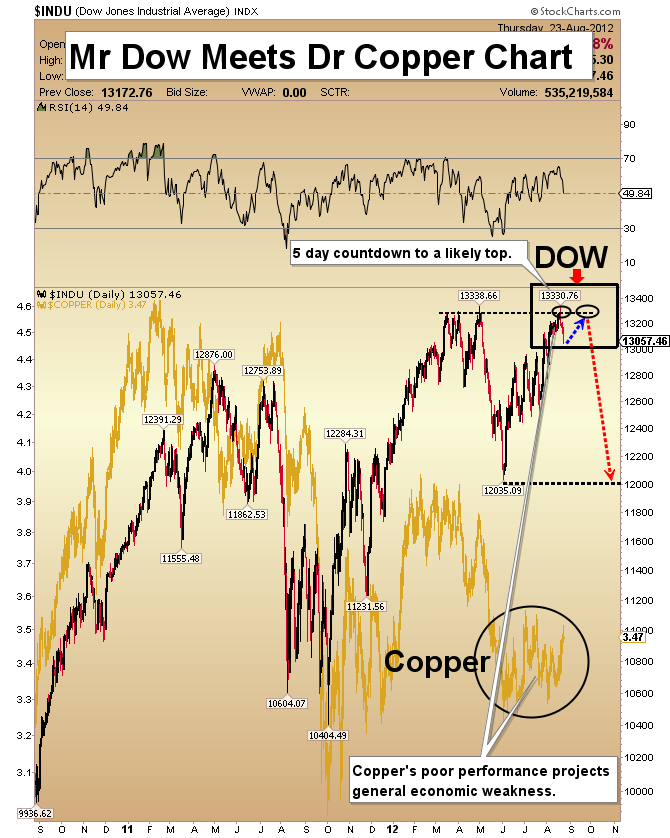
Mr. Dow Meets Dr. Copper Chart
- Last week I predicted the Dow would make a top within 10 days. The market has begun falling, and the most likely scenario now is a double top.
- I expect the Dow to re-test the highs in early September. From there, I am projecting a substantial decline that will usher in QE3.
- I have highlighted copper on this chart as well as the double top scenario. “Dr. Copper” is used heavily in industrial applications, and is known for forecasting economic weakness. As you can see, copper has fallen quite dramatically, indicating a recession is likely on the way, unless QE3 is quickly implemented.
- I don’t see any signs that the market could crash, but a deep correction seems to be in the cards. If the Dow goes even moderately higher, I advocate adding to short positions on the Dow.
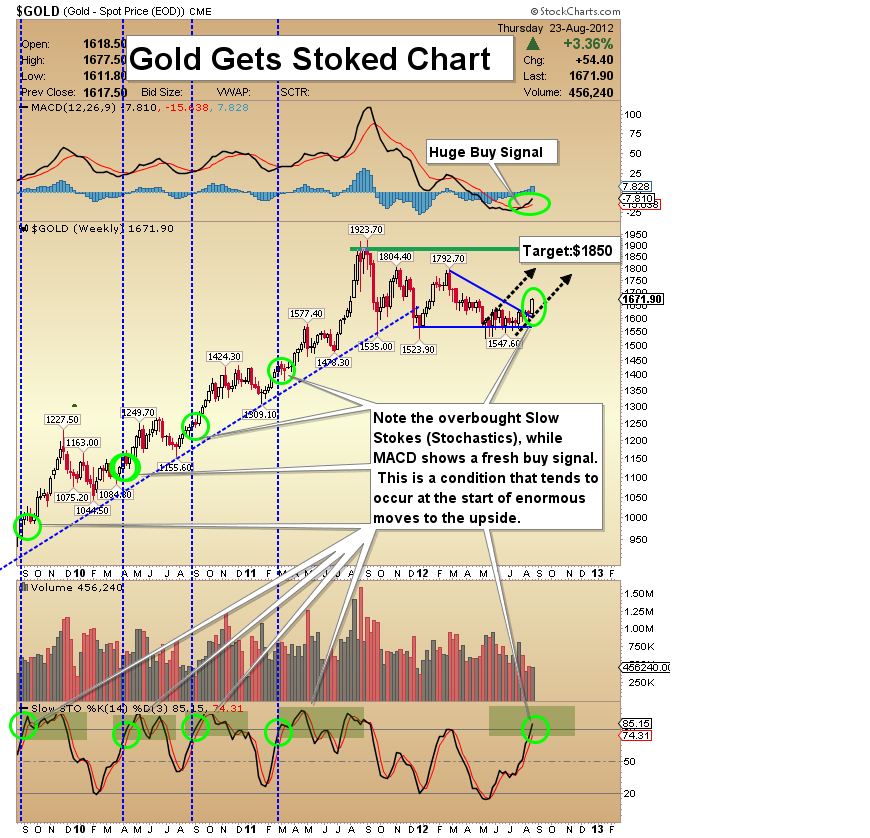
Gold Gets Stoked Chart
- The above commentary on the dollar, bond, and Dow may be reason enough to make gold your largest holding. Technically, gold looks very good. My intermediate-term target is $1850.
- I realize that most investors are a little shocked at how quickly gold has raced up in price over the past few trading sessions. Traders can book very light profits, but I think the move to the upside is only just starting.
- When major moves begin, the Slow Stochastics (“Slow Stokes”) indicator usually gets overbought very quickly, as it is now, while the MACD indicator flashes a buy signal.
- This technical situation is ideal for investors who like to hold very large positions in gold, silver, and gold stocks. Get gold, and get stoked!
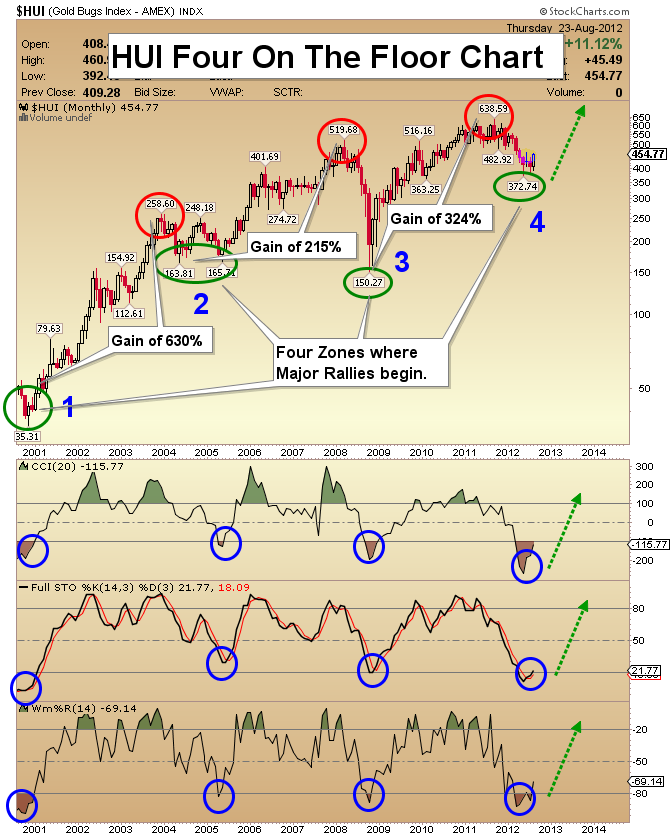
HUI Four On The Floor Chart
- For the past year, the most challenging sector of the precious metals group has been gold stocks. This chart suggests that situation is about to change, dramatically.
- I call it the “Four On The Floor” chart, because three of my most reliable indicators are all issuing huge buy signals in unison, for the fourth time in this bull market, from an “on the floor” oversold position.
- Williams, CCI, and Full Stochastics indicators work best on the HUI monthly chart to indicate market bottoms.
- When these indicators rise to the top of the chart, they can stay quite overbought for a long period of time. In contrast, when they become oversold and turn higher, a solid bottom is usually in place.
- The “Four On The Floor” chart shows you that gold stocks are likely beginning a trending move, to much higher prices.
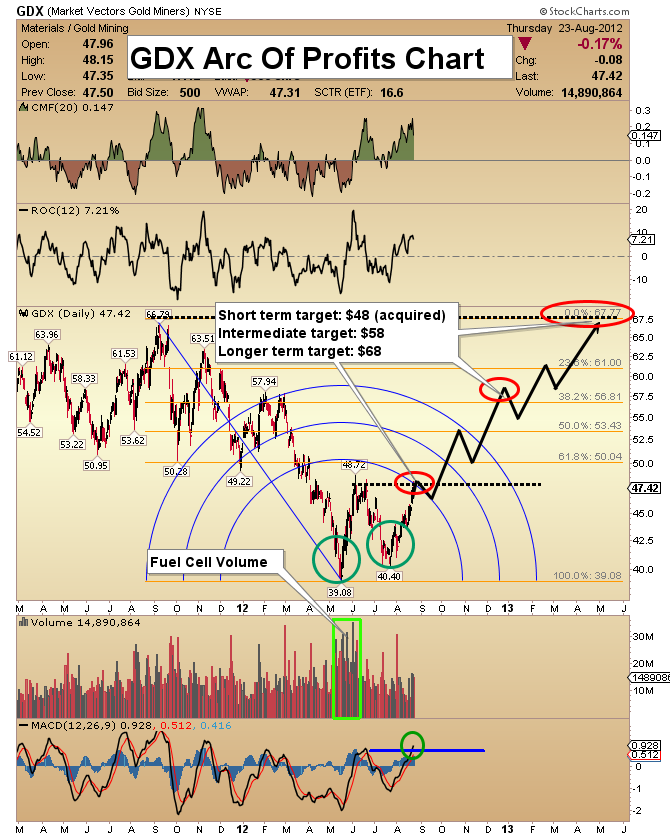
GDX Fibonacci Arc Of Profits Chart
- I use the Fibonacci Arc to estimate the price targets on a timetable. Gold stocks have made solid progress since bottoming, and target #1 on this chart was acquired yesterday, at $48.
- Traders should take light profits, and be ready to add to positions in the $45-$46 area.
- MACD just touched a new high, suggesting that the price could quickly began rising towards target number two, at $58.
- Target number three is $68, which is near the all-time highs. GDX mimics the HUI index, and the technical action on the “Four On The Floor” chart suggests that GDX is going to price levels far above $68.
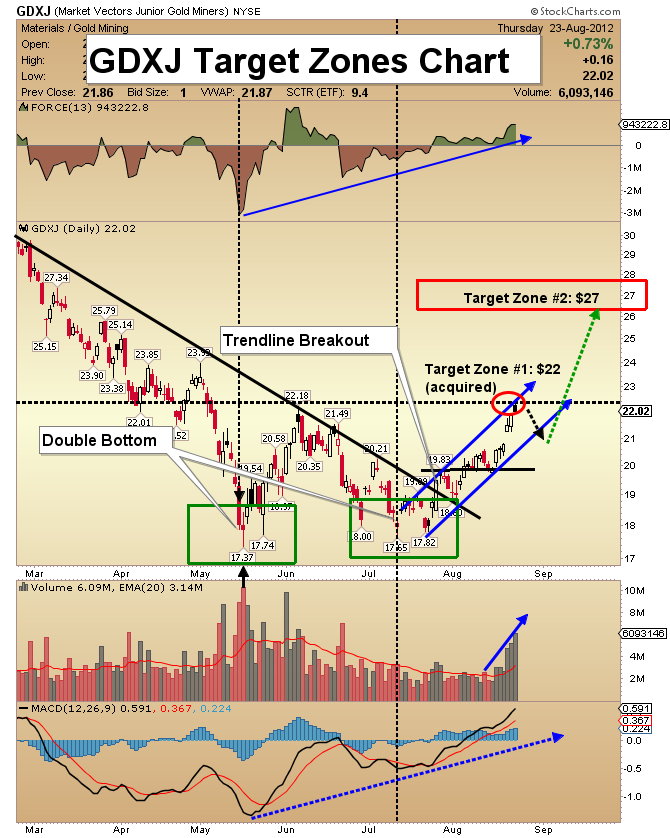
GDXJ Target Zones Chart
- The shorter term action on this chart is very encouraging. Volume patterns are stellar, and that means the overbought condition of short term oscillators is likely a “false flag” event.
- The first target at $22 was acquired yesterday. Book only light profit and hold your core positions tightly.
- A light pullback towards $20-$21 is possible. If it occurs, investors should buy in anticipation of a move towards target number two, at $27.
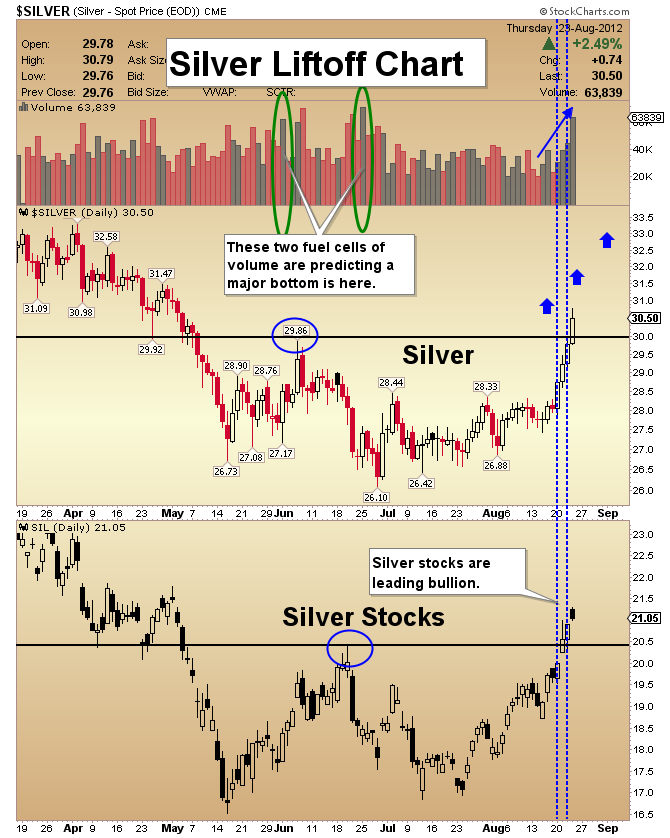
Silver Liftoff Chart
- Silver has been my favorite sector for months. Now, the price has started to move with good volume.
- Note the lower half of the silver chart, which highlights the action in silver stocks, via the ETF SIL-NYSE. The silver miners have already broken out to the upside, and miners tend to lead bullion.
- Because SIL has closed over $25.50 for two consecutive days, the double bottom pattern is now confirmed.
- Physical silver is my 2nd largest holding. Aggressive investors should concentrate on buying silver equities, for outperformance!
Friday, Jul 3, 2026 Super Force Signals Unique Introduction For 321Gold Readers:
Send me an email to admin@supergoldsignals.com and I’ll send you my free “Inflation Thunder Now!” gold and silver stocks video report. I’ll also include 3 of my next Super Force Surge Signals free of charge, as I send them to paid subscribers. Thank you!
|
Stay alert for our Super Gold alerts, sent by email to subscribers,
for both the daily charts on Super Force Signals at www.supergoldsignals.com and for the 60 minute
charts at www.supergoldsignals.com
About Super
Gold Signals:
Our Surge Gold Signals are created thru our proprietary blend
of the highest quality technical analysis and many years of successful
business building. We are two business owners with excellent synergy.
We understand risk and reward. Our subscribers are generally successfully
business owners, people like yourself with speculative funds,
looking for serious management of your risk and reward in the
market.
Frank Johnson:
Executive Editor, Macro Risk Manager.
Morris Hubbartt: Chief Market Analyst, Trading Risk Specialist.
website: www.supergoldsignals.com
email:
admin@supergoldsignals.com
email: admin@supergold60.com
Mail:
1276 Lakeview Drive
Oakville, Ontario, L6H 2M8
Canada
###
Aug 24, 2012
Morris Hubbartt
321gold
Ltd

|
