Super Force Signals - A Leading
Market Timing Service
We Take Every Trade Ourselves
Gold: Is It Invincible?
Morris Hubbartt
Weekly Market Update Excerpt
posted Aug 19, 2011
US Dollar QE Repercussion Chart
Dollar Commentary
- Loss of confidence in the dollar is accelerating and it effectively sits now on what amounts to a trap door. US debt downgraded by S&P was a big story. The bigger story is the performance of the dollar in comparison to gold! Gold is being elevated back to its ultimate currency status. I think it’s fair to almost say that it is gold that has really downgraded the dollar for months, and this downgrade continues with a fury.
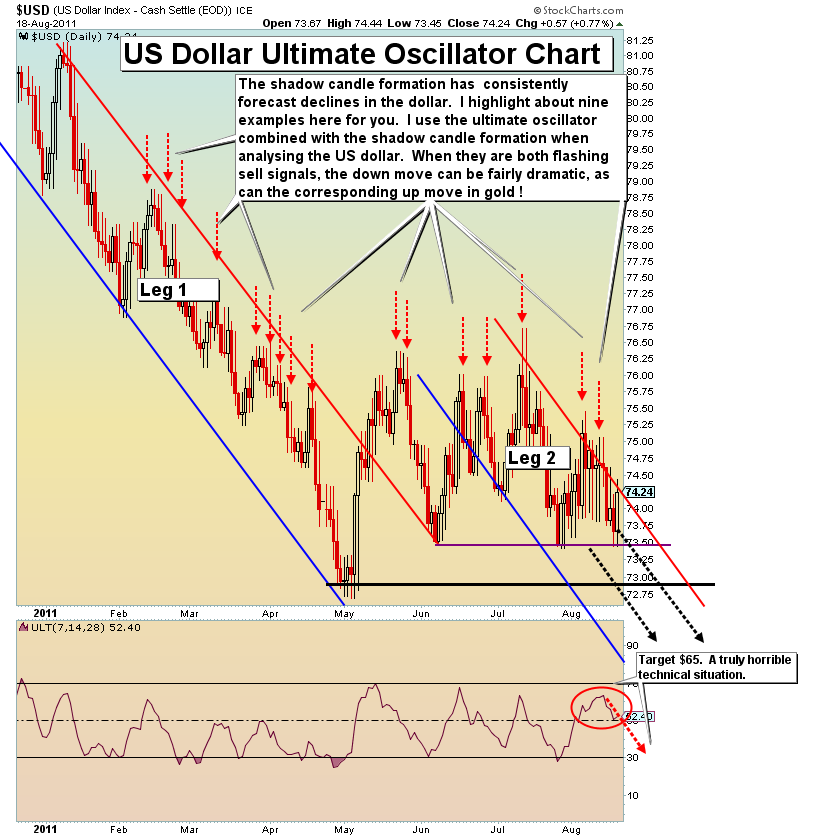
US Dollar Ultimate Oscillator Chart
- The USD has had a rough 12 months, losing in excess of 10%. Unfortunately, the policies of the United States Government for the foreseeable future are unchanged. I expect that policy to show itself in the performance of the dollar.
- During protracted downtrends, I like to use the ultimate oscillator on my price charts. When a rollover in the oscillator occurs in conjunction with a shadow candle formation, odds favor a decline. This chart could alternately be labeled the “Trap Door Chart”. Technically, the picture is absolutely horrific.
- It’s hard to believe the current placement of the ultimate oscillator now, considering how far the dollar is already down, yet it’s predicting still lower prices! My 2011 target on the currency remains $65. The projected time frame for the target price is November 2011, although a delay into February is possible.
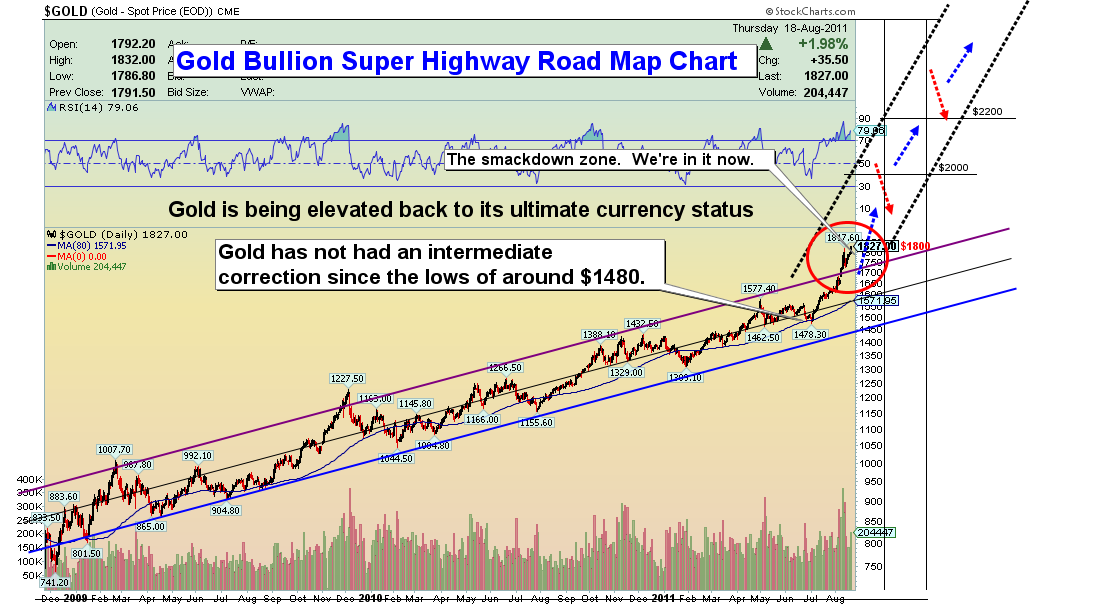
Gold Super Highway Chart
Gold Analysis
- The great awakening is taking place, for gold. We are only at the very earliest moments of the public beginning to notice gold. It’s almost imperceptible now, despite gold reaching mid $1800s! As the perception grows, it may create a new phase of the gold bull market. It could deliver great new highs in all sectors of the precious metals. The trigger was the debt ceiling fiasco that made headlines around the world. I believe the deal was another wrong step, down a dead-end road, by an out of control government.
- The higher gold goes, the more apparent the failing worldwide fiat currency system becomes. Central banks, which have been net sellers of gold, are now net buyers. The Wall Street Journal reported yesterday that central bank buying quadrupled in the latest quarter! This is an under-reported phenomenon that shows tremendous confidence of central bankers in gold.
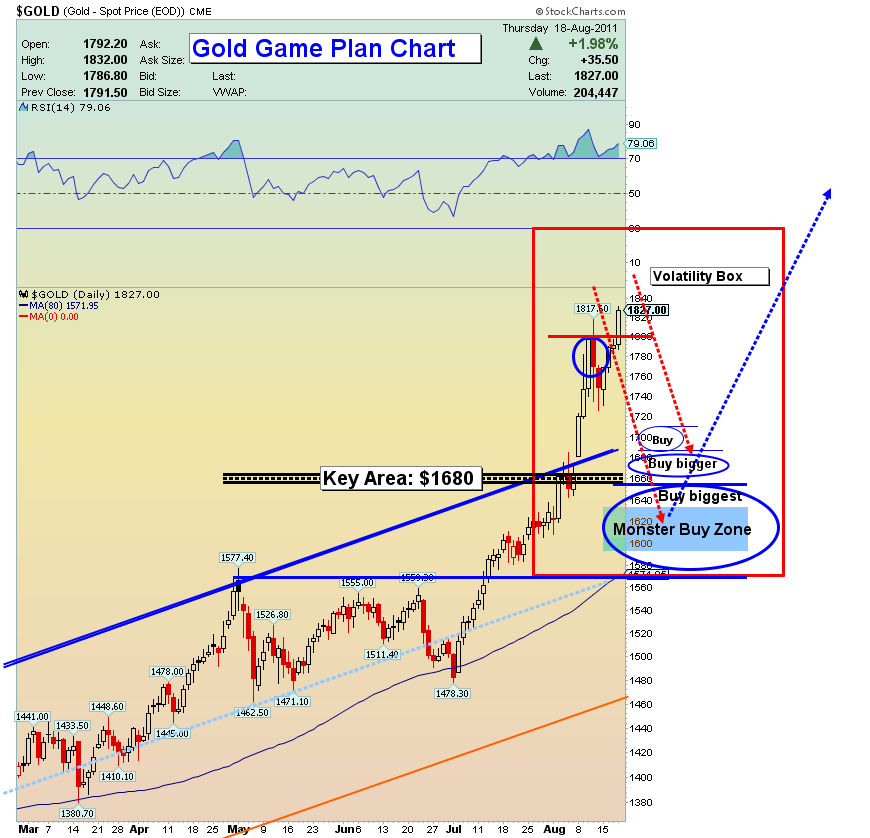
Gold Game Plan Chart
- Technically, gold has completed a price overshoot. What I mean by this statement is that price has risen enough above the upper supply trend line to label the situation as signifying price is out of the former rising channel and entering a new one.
- This action has been a feature of the gold bull market since inception, and it is now ushering in the gold “super highway”. The big question is, how do handle yourself in the gold market now?
- Well, here’s what I expect into the next several weeks, and I hope I’m not raining on any parades. The fact is that I suspect $1680 could be tested. It is really the price area that ushered in this accelerated phase of price appreciation. If you have physical gold, just sit tight. For those who don’t, I would strongly recommend buying down into the $1680 area, incrementally. We may touch that price before surging higher, but we may not, so buy into the target, not just at it.
- Buying gold in the future at higher prices than where we are now is likely to be very painful for those who try. Buy weakness now, because the heat in the volatility kitchen is going to get much hotter. This gold market is not a normal market. You must be prepared for gold to get technically overbought and stay overbought, for months or longer, and exhibit unbelievable swings in price.
- I am projecting that the volatility in gold will dwarf anything you’ve seen in the Dow in the last ten years.
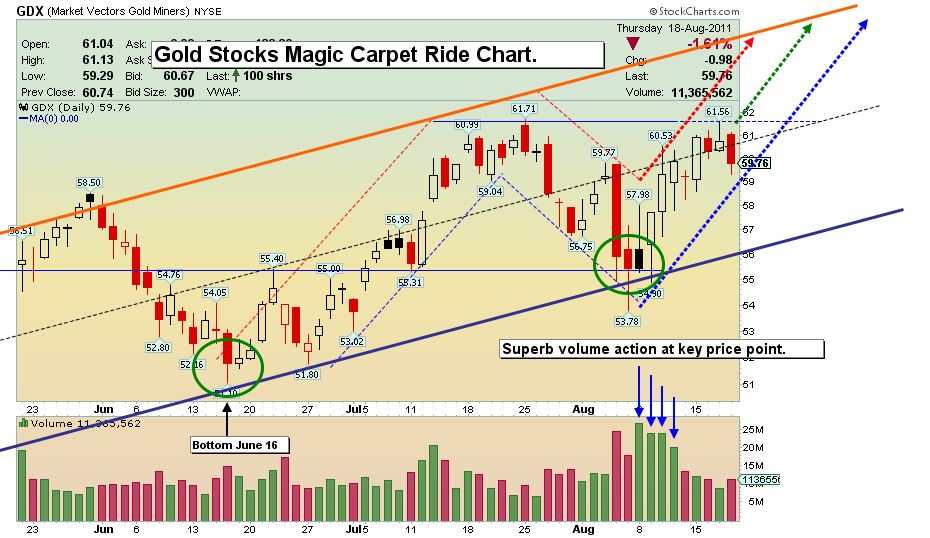
GDX Magic Carpet Ride Chart
- My analysis of the GDX chart indicates that gold shares are preparing for a magic carpet ride, and the smartest money is working, on days of weakness, to get your shares. The greatest fundamental of the mining shares is the price of gold, and the smartest money understands very well what the current central bank buy programs eventually mean for gold stocks, which is much higher prices.
- Every time the market takes a hit and someone sells into weakness there has to be a buyer. It may be hard to watch the volatility in your assets, but please do not sell these shares in times of price panic.
- Remember when the Dow was trading at 3000 and those saying it would go to 10,000 were labeled insane? Well it did it, and it only took five years. I think a bigger event is coming on the upside for gold stocks.
- Still, that gain will come one small dollar of share price at a time for GDX. My price projection for GDX on Dec 24, 2010 was $70.00, looking one year forward. That target looks solid and reasonable.
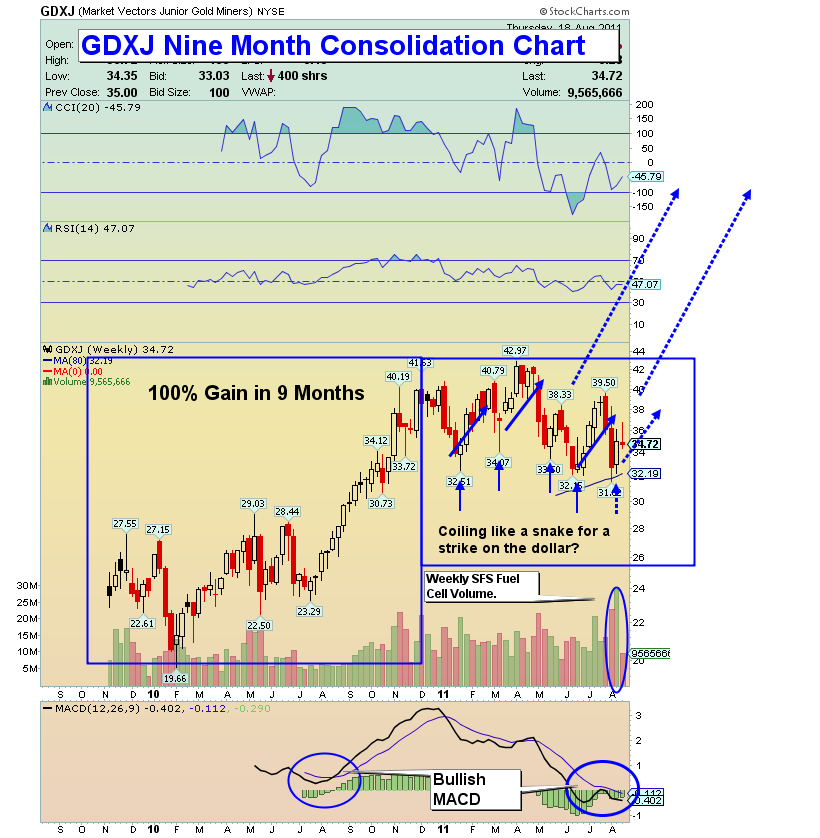
GDXJ Consoidation Chart
- This GDXJ chart is signaling much higher prices in the next 3-4 month timeframe. I see GDXJ up substantially by Dec 2011. I like GDX and GDXJ for a superior way to own a diversified gold stock portfolio. I own some individual issues, but my primary focus is GDX and GDXJ, and I urge you to consider the benefits of these products.
- Note that GDXJ rose over 100% in nine months with a majority of the move coming in just 3 months. Since then, it has consolidated for the same amount of time. Currently it is a coiling like a snake, poised to strike out in a big move higher.
- Note the SFS Fuel Cell Indicator on this ETF is a weekly signal, which is normally very powerful, MACD is also indicating price can move substantially higher.
- I set a $56.00 target on Dec 24, 2010, looking one year forward. That target looks solid into the end of the year. Stay long and strong in gold stocks, because the technical situation really is excellent.
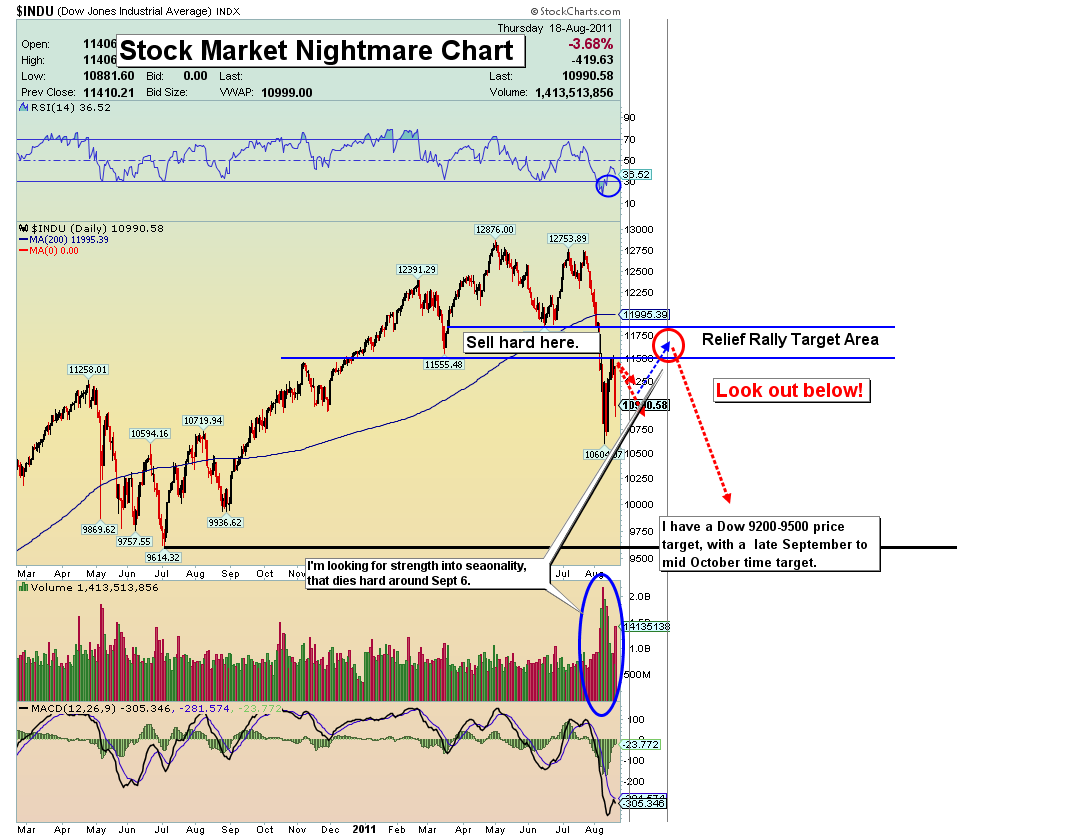
Stock Market Nightmare Chart
- I said a week ago that I was convinced a small relief rally was at hand, but rather than backing up the buy truck, you need to take advantage of the bounce and then work hard to prepare for a steeper decline into the fall.
- I am quite concerned about the stock market, especially going into this fall, and I will be monitoring the technical situation very closely. It’s possible there is a rally toward 11,700, but I would use any further strength to exit positions in the general equity market.
Friday, Jul 3, 2026 Super Force Signals Unique Introduction For 321Gold Readers:
Send me an email to admin@supergoldsignals.com and I’ll send you my free “Inflation Thunder Now!” gold and silver stocks video report. I’ll also include 3 of my next Super Force Surge Signals free of charge, as I send them to paid subscribers. Thank you!
|
Stay alert for our Super Gold alerts, sent by email to subscribers,
for both the daily charts on Super Force Signals at www.supergoldsignals.com and for the 60 minute
charts at www.supergoldsignals.com
About Super
Gold Signals:
Our Surge Gold Signals are created thru our proprietary blend
of the highest quality technical analysis and many years of successful
business building. We are two business owners with excellent synergy.
We understand risk and reward. Our subscribers are generally successfully
business owners, people like yourself with speculative funds,
looking for serious management of your risk and reward in the
market.
Frank Johnson:
Executive Editor, Macro Risk Manager.
Morris Hubbartt: Chief Market Analyst, Trading Risk Specialist.
website: www.supergoldsignals.com
email:
admin@supergoldsignals.com
email: admin@supergold60.com
Mail:
1276 Lakeview Drive
Oakville, Ontario, L6H 2M8
Canada
###
Aug 19, 2011
Morris Hubbartt
321gold
Ltd
|
