Super Force Signals - A Leading
Market Timing Service
We Take Every Trade Ourselves
Stock Market Turns Bear, Gold Stocks Stand Tall
Morris Hubbartt
Weekly Market Update Excerpt
posted Aug 12, 2011
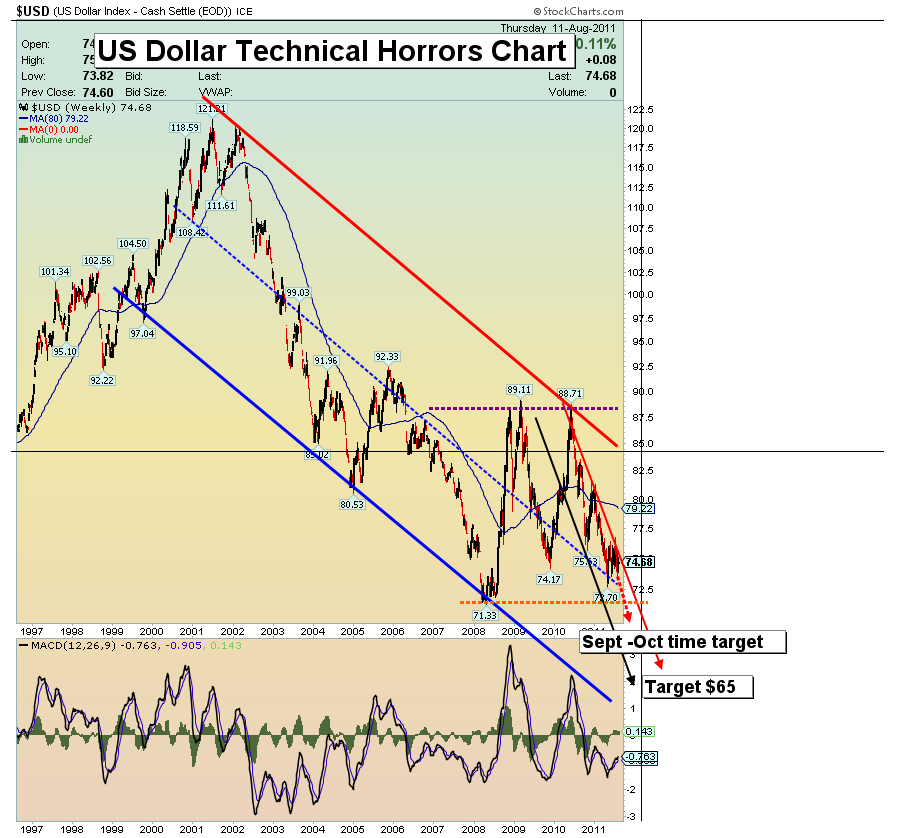
US Dollar Chart
Dollar Commentary
- You were told by Congress and the Fed that if the government didn’t raise the debt ceiling, a disaster would ensue. Well, the debt ceiling was raised and the disaster continues. The situation now feels “out of control.”
- The debt downgrade was the fundamental driver that pushed gold above the technical channel and onto what I’ve labeled the “super highway” price channel. The Fed seems to have pulled out all the stops, and still business is almost at a standstill. Something is very wrong.
- The economy is weakening, unemployment remains over 9%, and the stimulus that did not help before is called for again. The Fed can lower rates to boost bond prices, but not enough to help businesses.
- Ben Bernanke told Congress in July that the Fed would intervene to buy US Treasuries if the economy began to stall or if deflation re-emerged as a threat. My Sept-Nov USD $65.00 target for the dollar on the above chart feels solid. Longer term, the fundamentals indicate death or coma for the dollar.
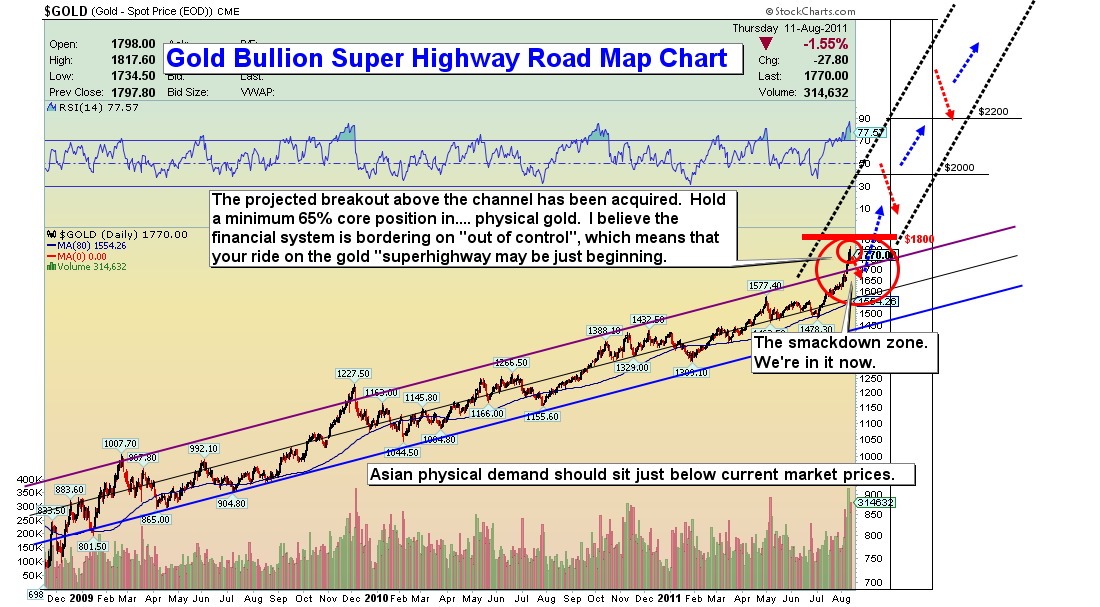
Gold Bullion Super Highway Chart
Gold Analysis
- I believe this gold chart is the most important long term chart you can examine. It is a picture of a likely revaluation that could see gold go way beyond even what is indicated on my chart.
- Welcome to the battle for gold $1800. While the move onto the “super highway” may have officially started, don’t think this is going to be an easy ride. There will be a lot of money to be made, but there will be unbelievable pain for those who don’t play this situation correctly.
- If you own gold, sit tight, particularly in core positions, which should not go below a level of 65%. The rush to liquidity by global central banks means a much higher gold price, but the volatility will likely be brutal.
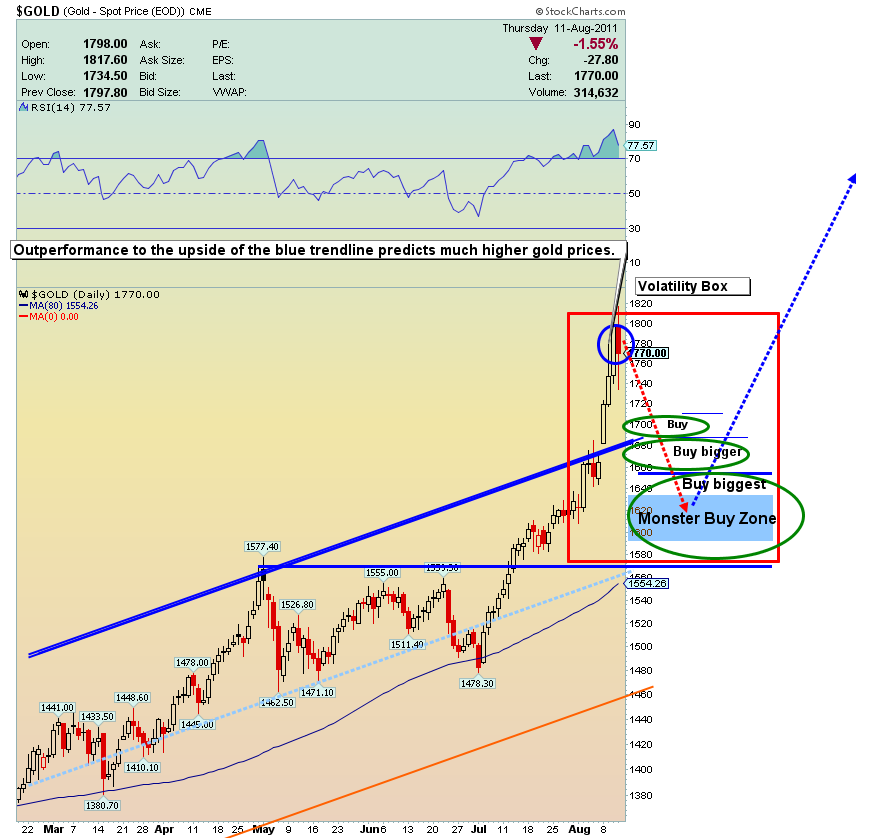
A Closer Look At The Gold Super Highway Chart
- Note the buy areas on the above chart. I’m expecting this timeframe (now) to be a corrective area (red box on the chart) that will likely be taken out to the upside after a few weeks of corrective action. Remember that I told you that would likely correct “around Mid August.” We are entering that exact timeframe now.
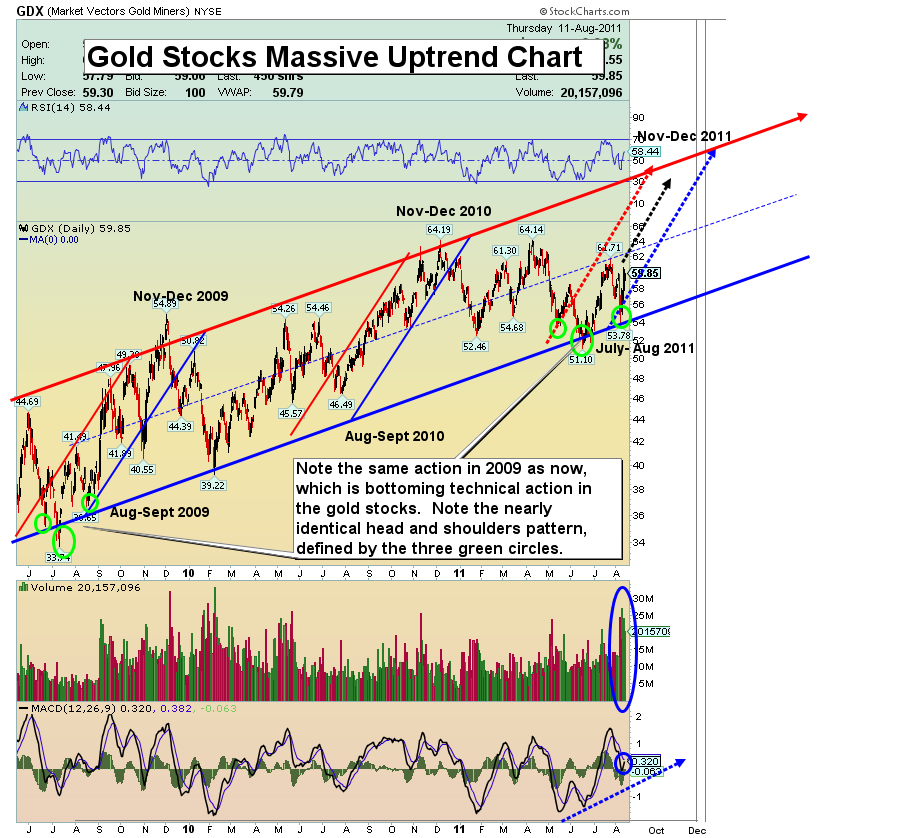
GDX Massive Uptrend Chart
- You don’t have to be able to see the stitches on a fastball to know that eventually there will not be enough gold to satisfy demand. With the US debt now officially downgraded, gold stands head and shoulders above every asset on the globe. The steeper up channel is caused by new money flows from investors who were unnerved by the debt downgrade. Shorting gold stocks now is like playing Russian roulette, with the chamber full of bullets.
- Note the huge price appreciation I am forecasting for GDX on the above chart. I expect the head and shoulder bottom I’ve highlighted on the chart to act as a “rocket launcher” and propel gold stocks to the top of the huge up channel. The gold community has put in a lot of time waiting for this kind of action and I think you are about to get rewarded for your dedication.
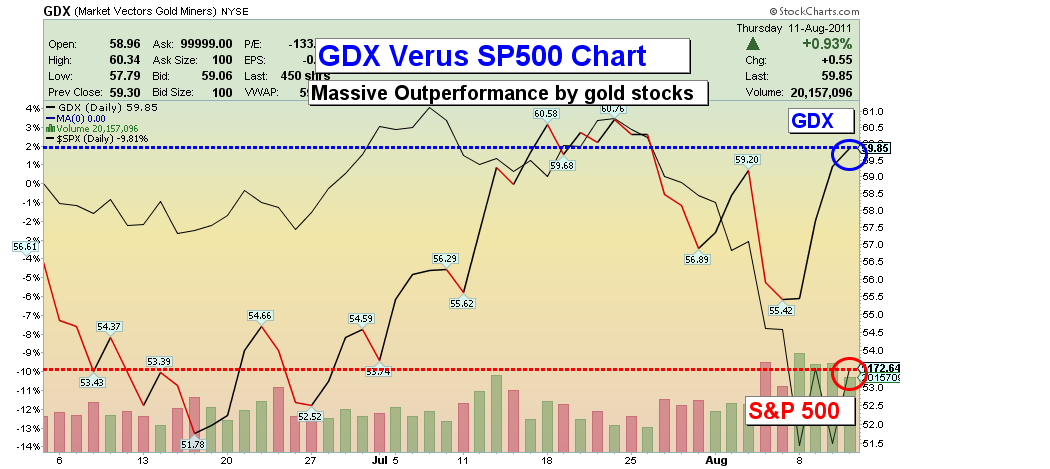
- Outperformance is starting to take place in gold stocks versus the S&P 500, demonstrated in the chart below.
GDX VS S&P 500 Chart
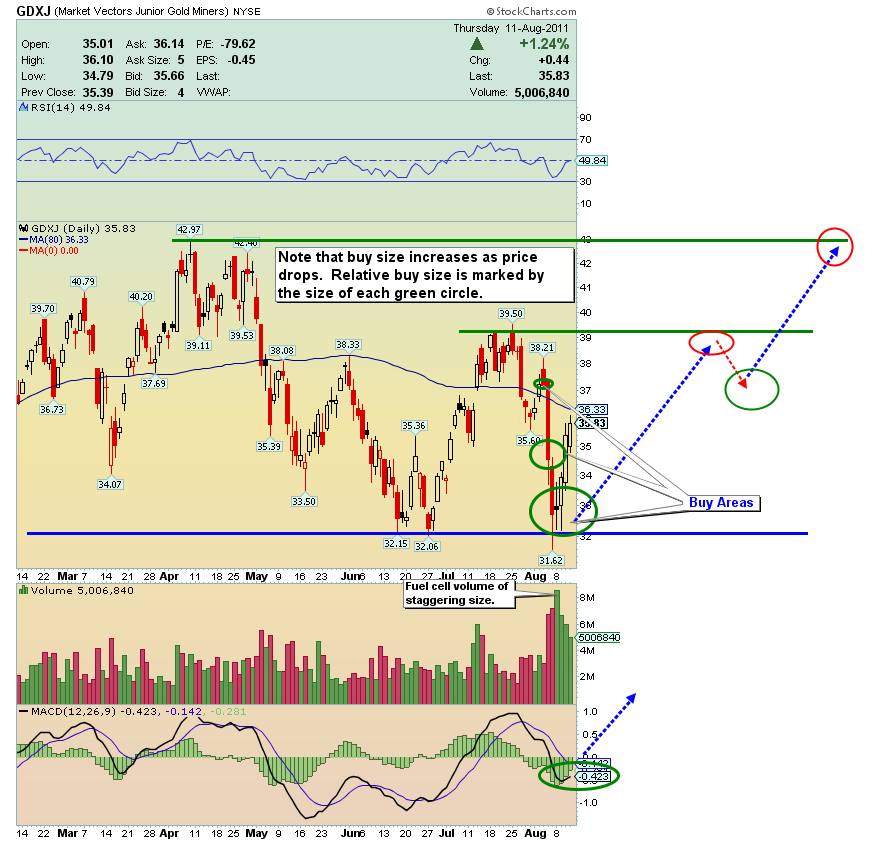
GDXJ Chart
- Volatility is going to continue to be the “new normal” of market life. The best thing you can do to prepare for this incredible action is to shave off positions into strength, while holding a much larger core position.
- On Wednesday this week, as general equities got hammered, the natural resource sectors, including gold stocks, had a positive day. The vibe of the market is changing for gold stocks.
- While junior gold stocks could trail the seniors initially in the move up the channel, I think they will surpass the GDX in terms of total performance, once the move gets more advanced. Study the annotations on this chart carefully.
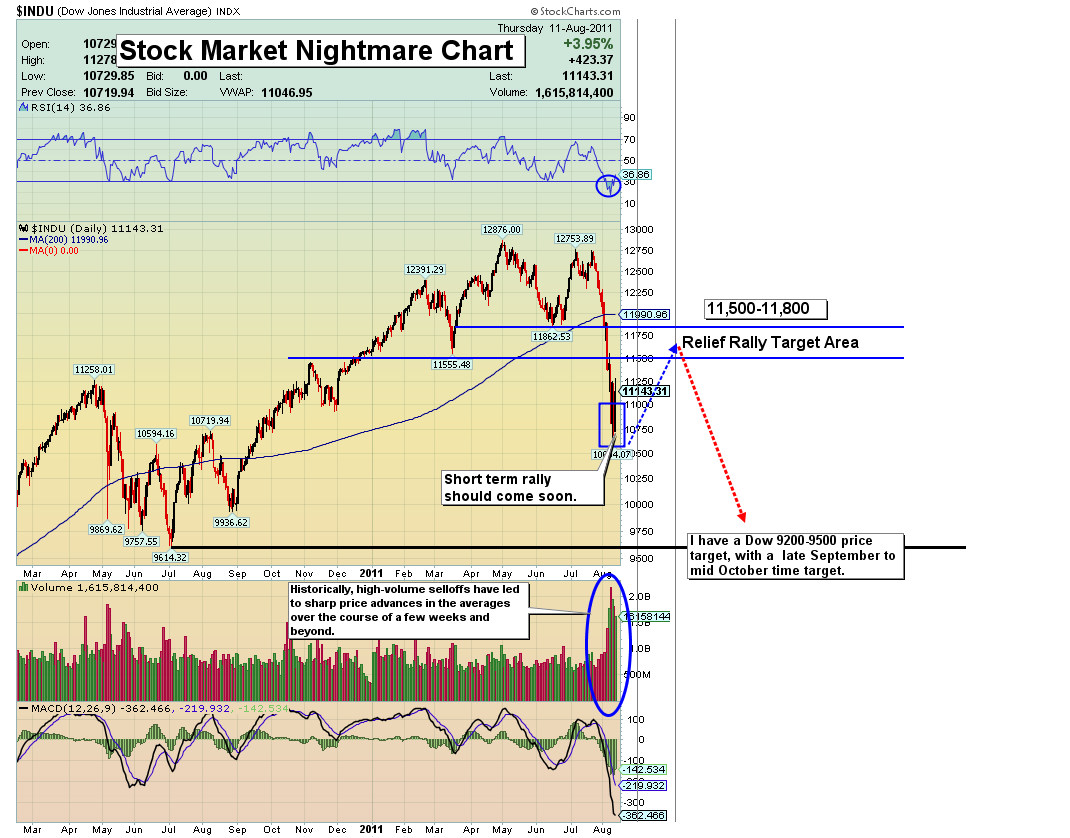
Dow Jones Industrial Average Chart
- The stock market has been brutal since it topped in late July. One positive to keep in mind, at least for a rally, is that history shows that high-volume, waterfall-type selloffs have led to sharp price advances in the averages over the course of a few weeks and beyond.
- In the short term, I’m convinced a relief rally will come. Note the target area on the Dow chart. I don’t advocate you “back up the truck,” buying this market. Instead, position yourself to take advantage of the bounce and then work hard to prepare for a steeper decline into the fall. Beyond this rally, I see a clear and horrible break that will likely take out the 2010 lows.
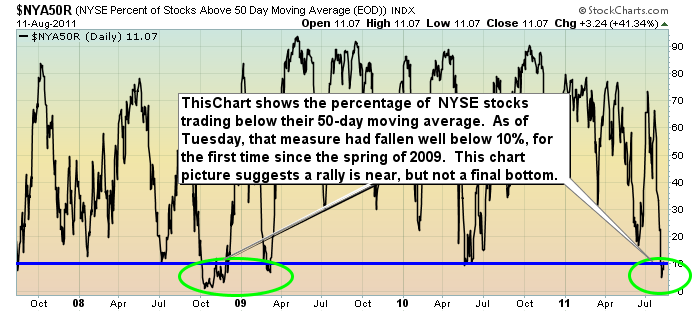
Stock Market Oversold Indicator Chart
- I do see opportunities in the short term trade in the general equities market, but I prefer to play gold and oil stocks that have been hurt as result of the stock market mayhem. With the actions and policies of the US government, natural resource plays will be the preferred investments into the future.
Friday, Jul 10, 2026 Super Force Signals Unique Introduction For 321Gold Readers:
Send me an email to admin@supergoldsignals.com and I’ll send you my free “Inflation Thunder Now!” gold and silver stocks video report. I’ll also include 3 of my next Super Force Surge Signals free of charge, as I send them to paid subscribers. Thank you!
|
Stay alert for our Super Gold alerts, sent by email to subscribers,
for both the daily charts on Super Force Signals at www.supergoldsignals.com and for the 60 minute
charts at www.supergoldsignals.com
About Super
Gold Signals:
Our Surge Gold Signals are created thru our proprietary blend
of the highest quality technical analysis and many years of successful
business building. We are two business owners with excellent synergy.
We understand risk and reward. Our subscribers are generally successfully
business owners, people like yourself with speculative funds,
looking for serious management of your risk and reward in the
market.
Frank Johnson:
Executive Editor, Macro Risk Manager.
Morris Hubbartt: Chief Market Analyst, Trading Risk Specialist.
website: www.supergoldsignals.com
email:
admin@supergoldsignals.com
email: admin@supergold60.com
Mail:
1276 Lakeview Drive
Oakville, Ontario, L6H 2M8
Canada
###
Aug 12, 2011
Morris Hubbartt
321gold
Ltd
|
