Super Force Signals - A Leading
Market Timing Service
We Take Every Trade Ourselves
Go Dogs Go
Morris Hubbartt
Weekly Market Update Excerpt
posted Aug 10, 2012
US Dollar Top Hat Chart
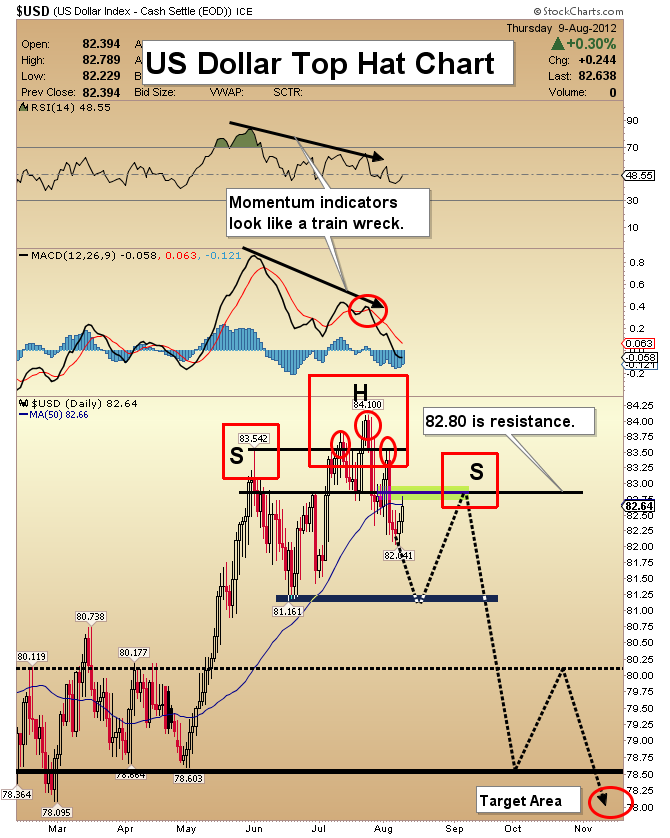
- It is conservatively estimated that an additional $50 trillion of debt will be “accumulated” by the Federal government over the next 25 years. Mainstream investors are under the impression that the US currency is a safe place to store wealth for the long term. Unfortunately, because of enormous debt and unfunded liabilities, the dollar is losing creditability.
- I call this chart the “Top Hat Chart”, because it looks like the dollar is wearing a top hat. That hat is a small head & shoulders top pattern. I believe it is now becoming the head of a bigger and more ominous formation.
- I’m predicting a decline to around 81.16, and then a rally to about 82.80. From there, I am projecting a severe meltdown in the dollar.
- The technical condition of MACD and RSI can be described as a “train wreck”.
- My intermediate term target is the 78 area. If it is acquired, gold should be trading at $1850 or better.
Gold Target Chart
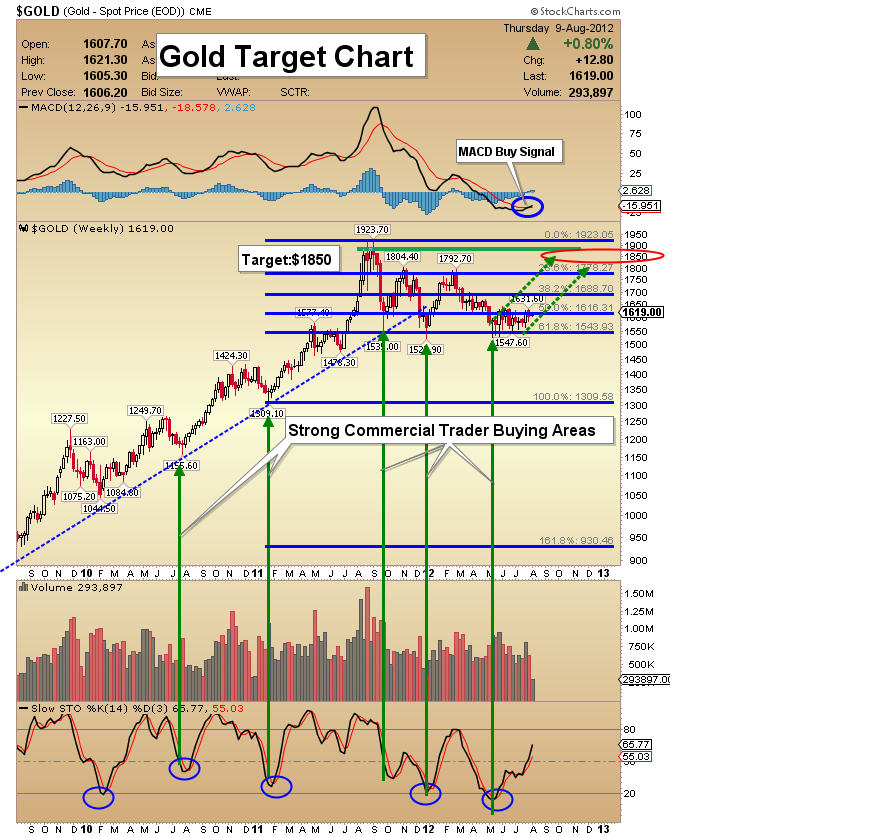
- Historically, institutional money managers held as much as 10% of their assets in gold, but the new generation of risk takers allocate only about 1% of their assets to it.
- Gold has recently been re-classified as a risk-free asset, and as such banks may seek to boost their holdings. Higher demand for gold produces higher prices.
- My suggested strategy is to hold your core bullion positions, but sell trading positions very lightly into strength.
- Note the significant MACD buy signal that just occurred. I have also delineated what appears to be a new uptrend price channel, using two green dotted lines.
- The slow stokes (Stochastics) look very good as well. I expect gold to reach $1850 before there is another significant correction.
GDX Budding Uptrend Chart
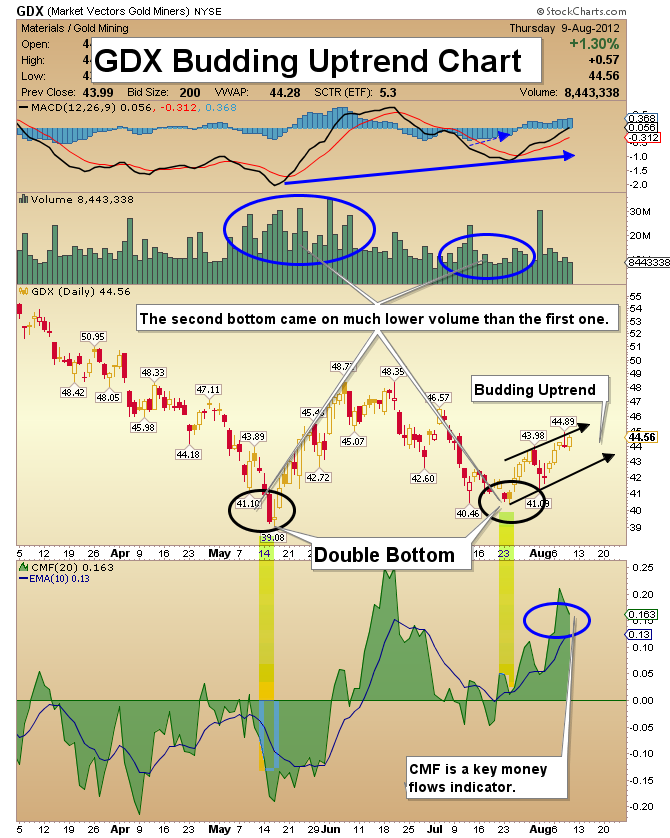
- A very encouraging double bottom pattern has developed on many charts in the precious metals sector, and GDX provides a shining example.
- There was very light volume on the second decline in this formation, making the rebound a successful test of the first low.
- The money flow and volume indicators are demonstrating that strong buying is in play. Note the bullish action of the MACD and CMF indicators.
- Use the weakness in senior gold stocks to add to your positions.
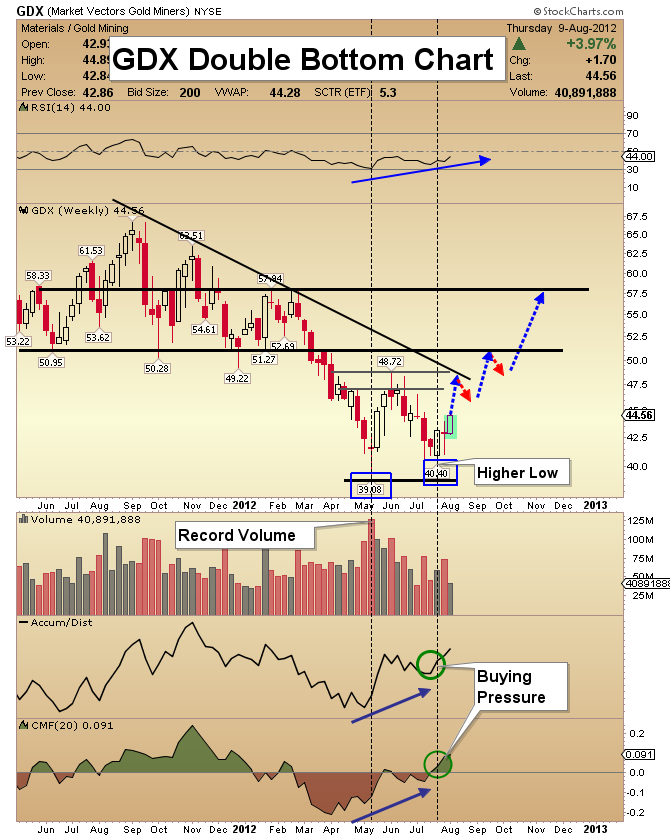
GDX Big Bottom Chart
- The weekly chart provides a bird’s eye view of the sector. The A/C (accumulation/distribution) indicator is surging higher, suggesting that GDX could soon rise above the downtrend line and surpass the highs at $48.72.
- RSI and CMF are bullish. I expect the $58 area to be acquired before year-end.
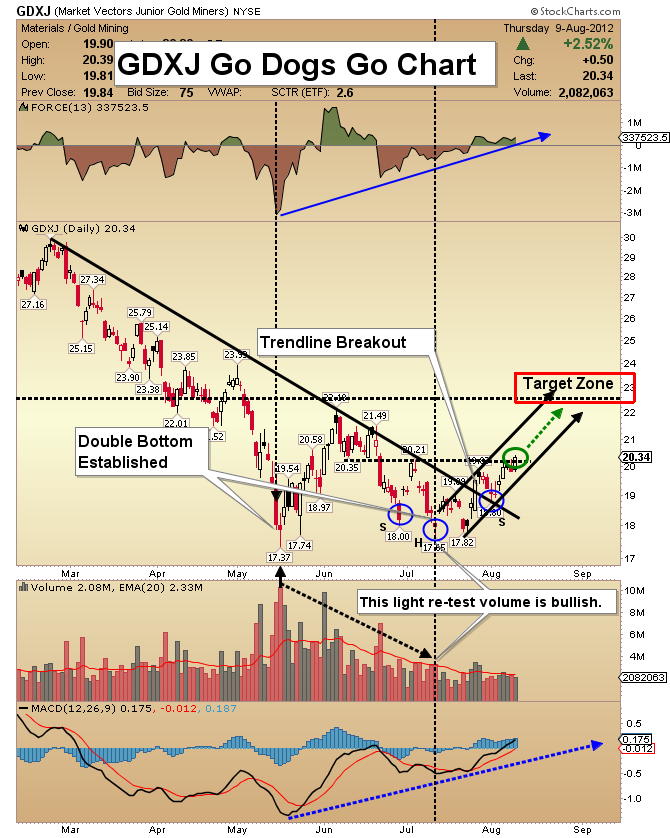
GDXJ Go Dogs Go Chart
- Phil Eastman wrote the 1961 classic, “Go, Dog. Go”. The book describes the adventures of a group of highly mobile dogs in cars, on their way to a party.
- One of the highlights is all the dogs roaring forwards when a traffic light turns green.
- I believe that junior gold stocks have performed as dogs for long enough, and the current chart seems to mimic a very green traffic light. Are the junior gold stock dogs finally “off to the races”? I think they are.
- Let’s review the GDXJ technicals. First, there is a significant double bottom in play. The first bottom came on record volume. A re-test of the lows showed very light volume. The second bottom became a small head & shoulders bottom.
- Yesterday was a significant day, as GDXJ penetrated resistance at $20.35. I’ve highlighted that with a green circle and a dotted black line.
- There is a new up channel in place, and I have set a short term target of about $22.50.
- The action of both MACD and the FORCE indicator suggest that this target will be acquired. Book light profits between $20-22.
- Because of the extremely oversold nature of GDXJ and individual junior stocks, I am recommending that about 80% of your position should be classified as “buy and hold”.
- I am projecting some volatility in the $22 area, and then a powerful move to $27 or higher. The light for junior gold stocks is green, and getting greener. The bottom line is, “Go Dogs Go!”.
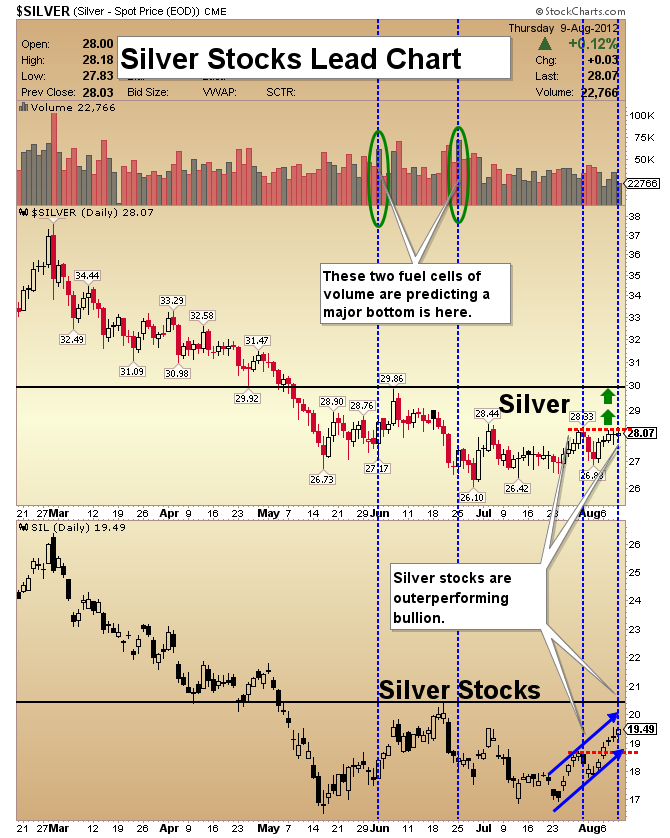
Silver Stocks Outperformance Chart
- The most impressive part of the silver market right now is the silver equity sector. SIL-nyse is a silver equities ETF. Please note the strong uptrend that is taking shape, while silver bullion has been trading sideways.
- This is exactly the type of trading I want to see, coming off the lows of this classic double bottom pattern. It’s impressive to see silver stocks lead silver bullion, just as gold stocks have been leading gold!
- I believe this is just the beginning of an extended period of outperformance by precious metals equities, and the silver sector is the most attractive of them all!
Friday, Jul 3, 2026 Super Force Signals Unique Introduction For 321Gold Readers:
Send me an email to admin@supergoldsignals.com and I’ll send you my free “Inflation Thunder Now!” gold and silver stocks video report. I’ll also include 3 of my next Super Force Surge Signals free of charge, as I send them to paid subscribers. Thank you!
|
Stay alert for our Super Gold alerts, sent by email to subscribers,
for both the daily charts on Super Force Signals at www.supergoldsignals.com and for the 60 minute
charts at www.supergoldsignals.com
About Super
Gold Signals:
Our Surge Gold Signals are created thru our proprietary blend
of the highest quality technical analysis and many years of successful
business building. We are two business owners with excellent synergy.
We understand risk and reward. Our subscribers are generally successfully
business owners, people like yourself with speculative funds,
looking for serious management of your risk and reward in the
market.
Frank Johnson:
Executive Editor, Macro Risk Manager.
Morris Hubbartt: Chief Market Analyst, Trading Risk Specialist.
website: www.supergoldsignals.com
email:
admin@supergoldsignals.com
email: admin@supergold60.com
Mail:
1276 Lakeview Drive
Oakville, Ontario, L6H 2M8
Canada
###
Aug 10, 2012
Morris Hubbartt
321gold
Ltd

|
