Super Force Signals - A Leading
Market Timing Service
We Take Every Trade Ourselves
Gold Tactics In The Smackdown Zone
Morris Hubbartt
Weekly Market Update Excerpt
posted Aug 5, 2011
US Dollar Chart
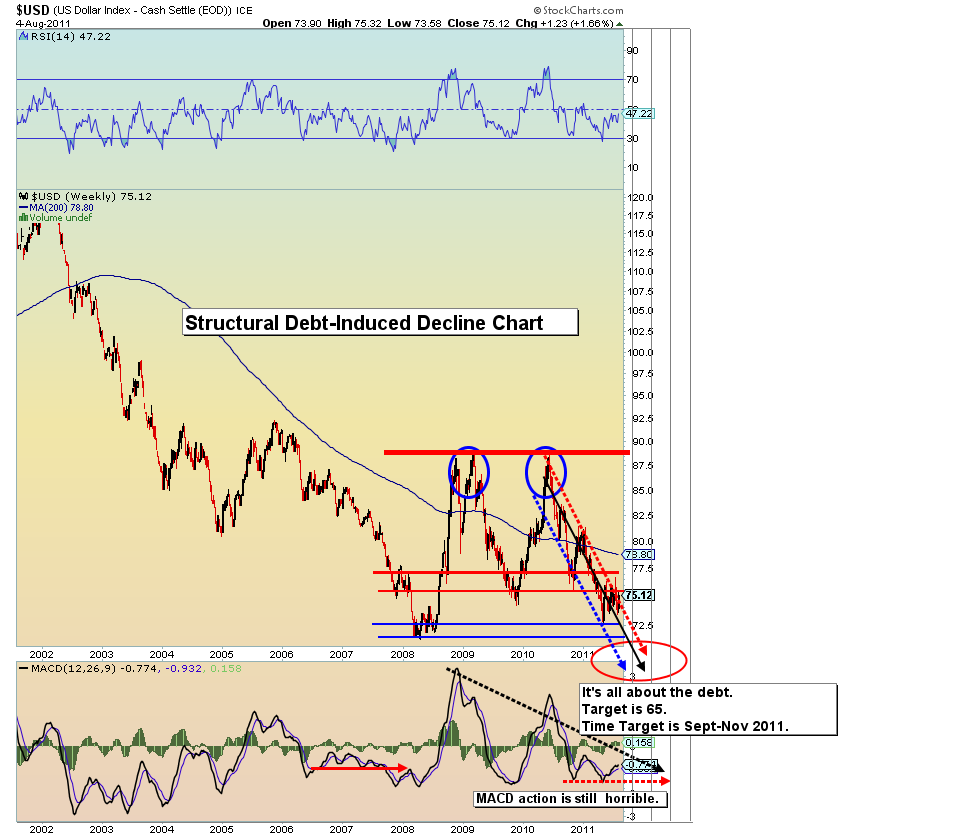
Dollar Commentary
- My theme for the entire year has been the declining dollar. The debt in the US will likely overwhelm the economy. The public is now waking up to the danger, because of the recent wrangling in Washington over the debt ceiling. It’s not hard to imagine a $20 trillion dollar debt in the next five years.
- My dollar charts show the dollar as an asset in meltdown mode. All rallies in the dollar should be sold fairly hard. The structural debt-based decline in the dollar continues with only blips of rally. My price target for the dollar remains $65, with a timeline of late September-November 2011.
- Longer term, unless the debt is brought under control (unlikely), the dollar will go much lower than 65. My advice is for you to keep 25% or more of total assets in gold and silver outside of the banking system.
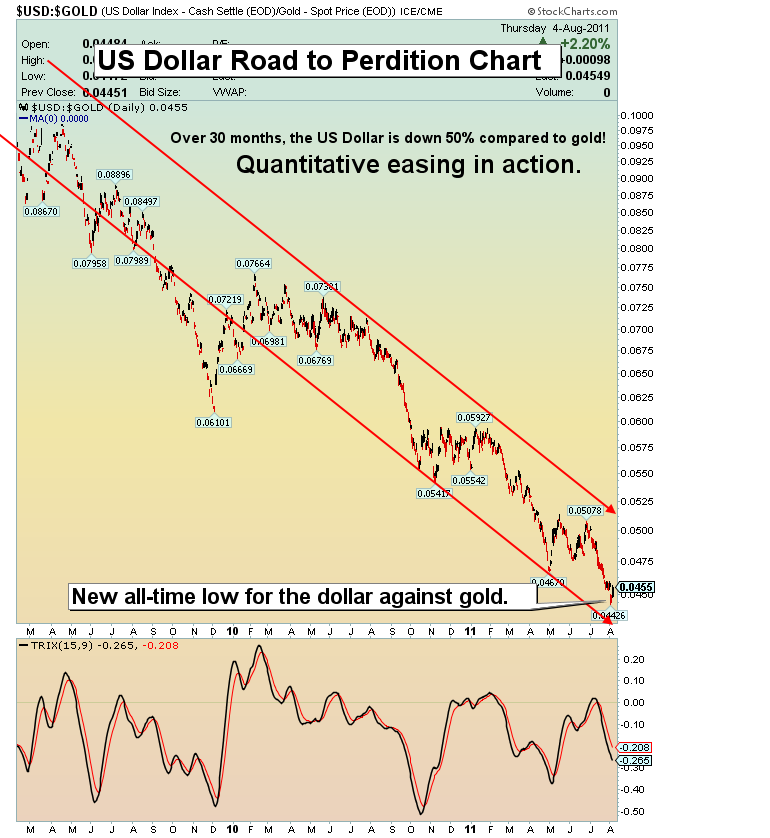
US Dollar Road To Perdition Chart
- The above chart shows the terrible condition of the dollar over about 30 months. This ratio chart identifies how much stronger gold has been in comparison to the US dollar. Economically, the United States could be heading off of a cliff, and a look at this chart demonstrates we are probably near the edge.
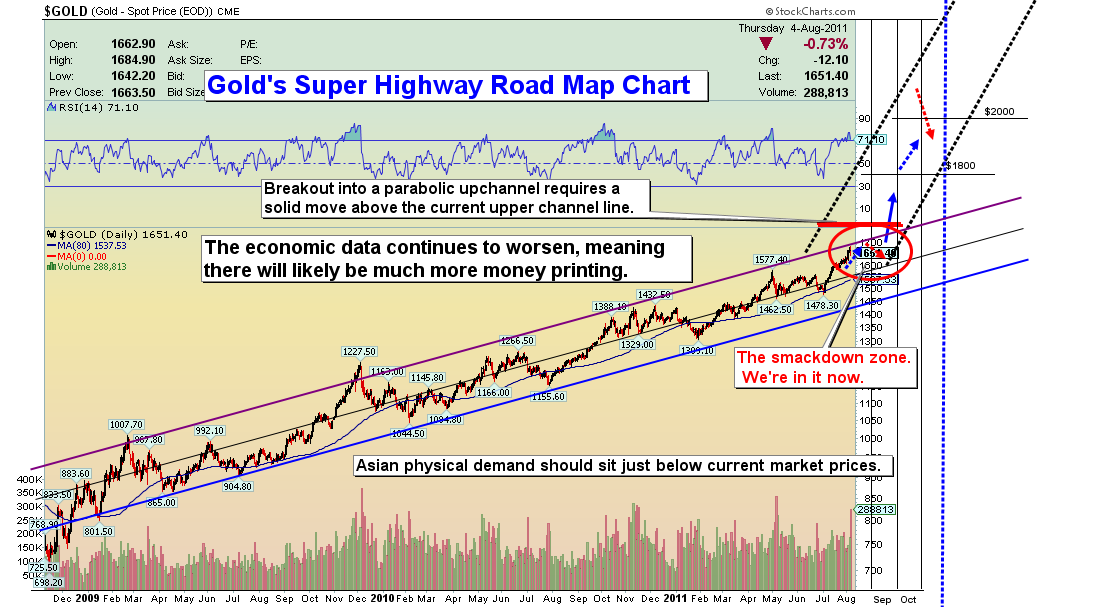
Gold Super Highway Chart
Gold Analysis
- At this point it is estimated that only 1 to 2% of institutional funds are invested in gold. Current price action suggests that a lot of big money on the sidelines may want to be in. If they move in, and it seems likely that many will, that entry could have a profound impact on gold, and possibly silver as well.
- If the debt is un-payable, gold could move much higher. I believe many institutions will ultimately hold close to 10% of their assets in gold, which is a significant flow of liquidity into the metal.
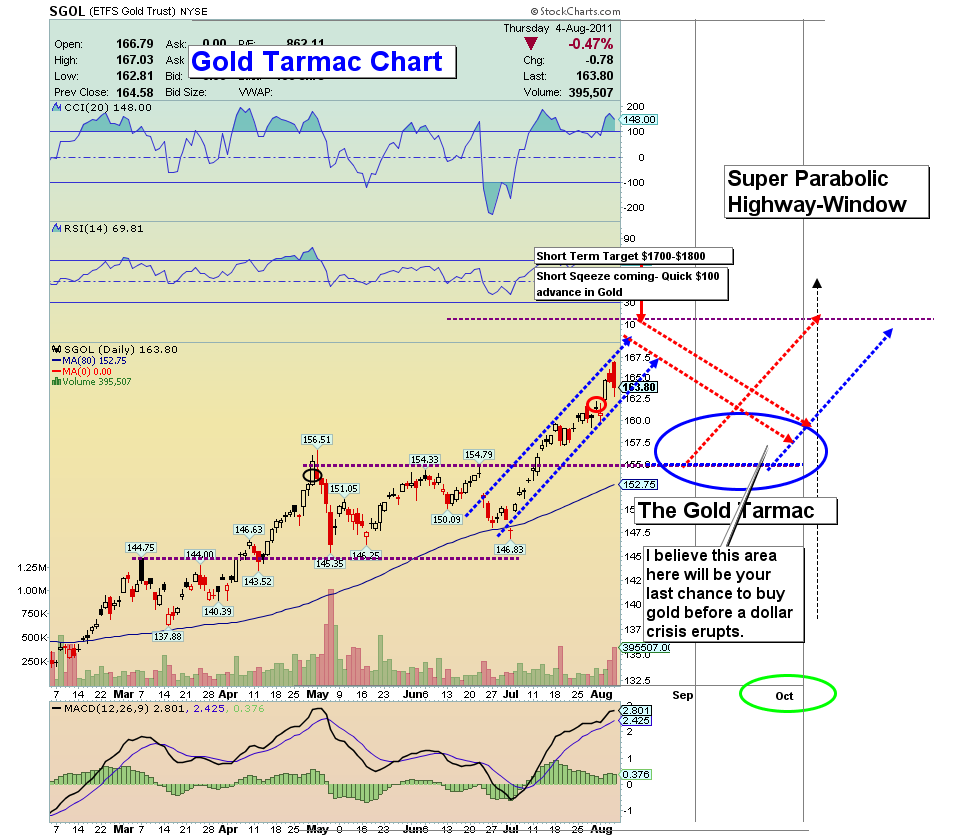
SGOL (Gold Bullion Proxy) Tarmac Chart
- There is a strong possibility of a strong short term blast to the upside now, fuelled by short covering. I am projecting that the rally could take price to around $1700-1800. From there, I think a substantial sell-off occurs, and I mean something much more painful than you experienced yesterday. Most investors have been caught flat footed on this rally. The metals rally is a solid month ahead of “seasonal schedule”.
- Yesterday’s hit has likely ushered in a lot of shorting by hedge funds. The fuel is now there for a huge short covering blast higher, one that could get us to $1750 in the short term.
- That price would slightly exceed my original short term $1700 target. Bull price target overshoots are always a possibility in the greatest bull markets. From there I see a smack down, and then the real deal rally you have all been waiting on for ten years should unfold into the fall.
- There is a saying that people who try to outsmart the bull often get the horn. In this market I think that holding 65% of your gold positions as a core holding is your best approach.
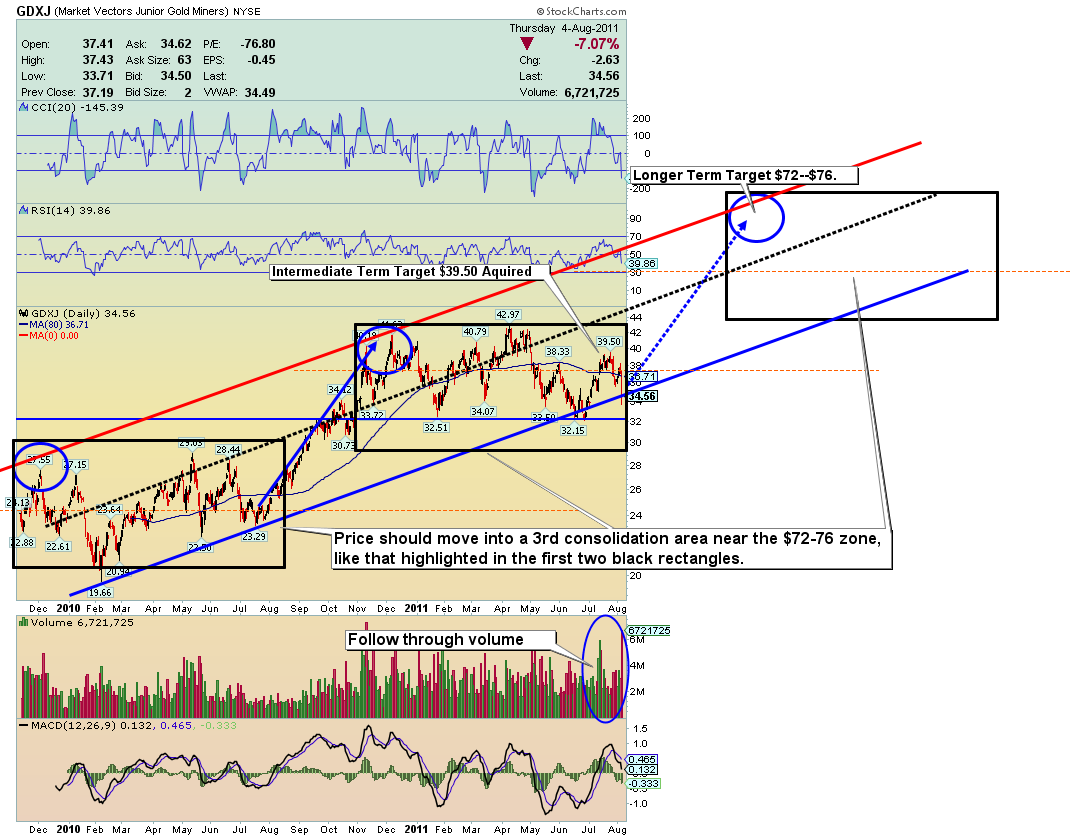
GDXJ Chart
- I am looking for this market to take out the highs of two weeks ago very quickly. From there it may make an assault on all-time highs. The best advice I can give you is to hold your positions.
- While it may seem impossible, my technical indicators are now predicting a trend change in favour of gold stocks over gold bullion, starting almost immediately, for at least an intermediate trend move, and perhaps a primary trend move.
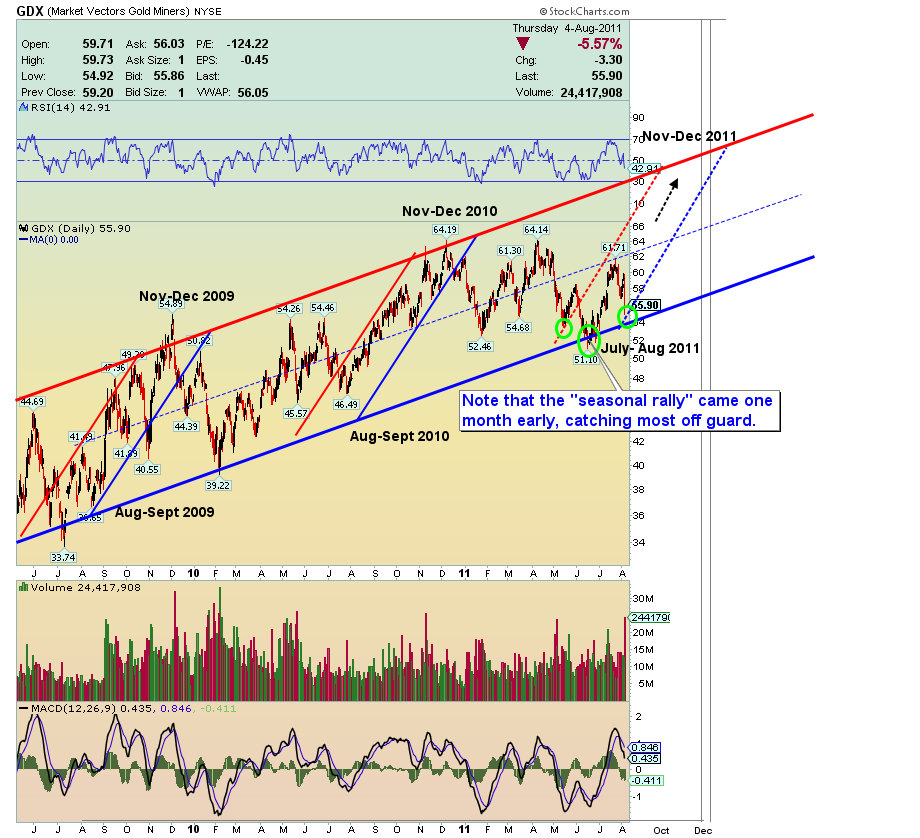
GDX Chart
- Many are still in denial about the strength of this sector. Note the powerful uptrend channels that occurred in 2009 and 2010. I believe we are on the verge on another one!
- Notice that the first two uptrends started in the August to September timeframe. I have mentioned gold stock investors getting caught flat footed this year, because they are waiting for their “traditional” time to buy. In a financial crisis, a lot that happens is not “traditional”. It is erratic and often horrible.
- One danger is that investors could rush in on my projected short covering rally to buy, fearing they are missing out, only to experience a vicious smack down, at the very time that gold and gold stocks “should rally”.
- The early start to the rally is an indication that this year’s upside move could be much stronger than the action of the past two years.
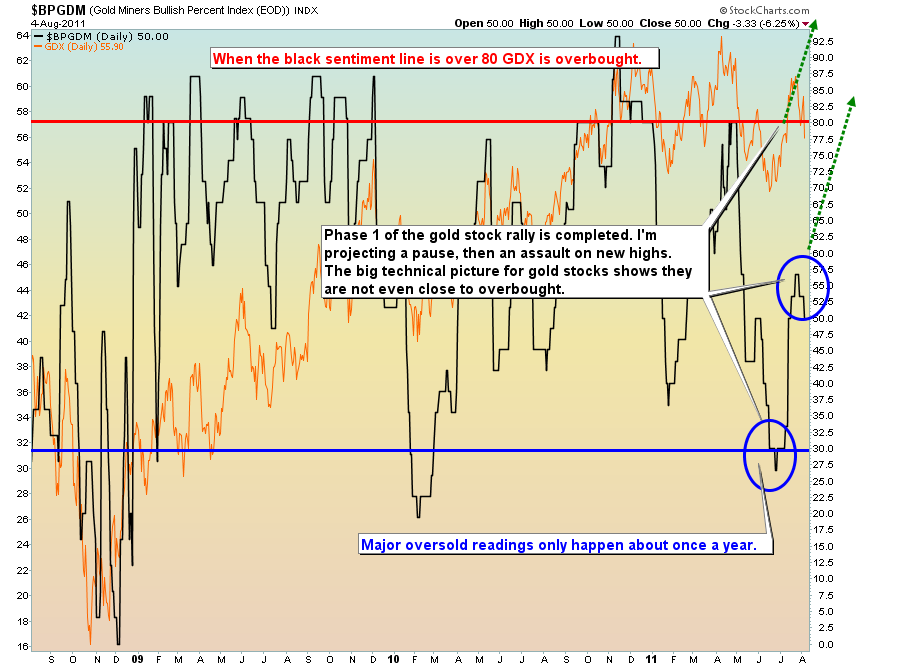
GDX Sentiment Chart
- The pullback in gold stocks is classic bull market action. After a rally of nearly 22%, we have now pulled back. The above overbought/oversold indicator is not even half way to overbought. Gold started the bull season one month “early”, and appears to be headed for a major bull move into late 2011. Stay strong!
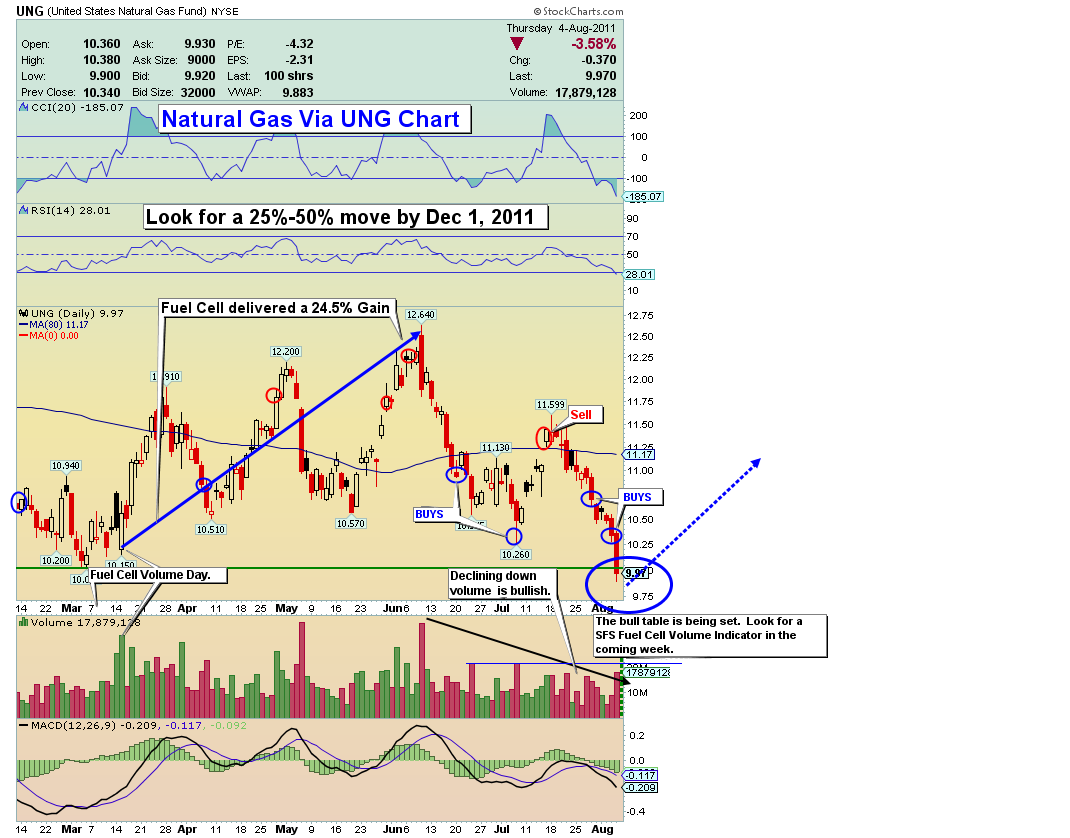
UNG (Natural Gas Proxy) Chart
- I believe the “bullish” table is set for a SFS Fuel Cell Indicator inside the next week on natural gas. My intermediate term indicators are projecting a 25% move upside, and possibly up to 50%, over the next three months. Natural gas is down a whopping 70% from 2008 highs, so this commodity is capable of running a long ways with the right technical set-up.
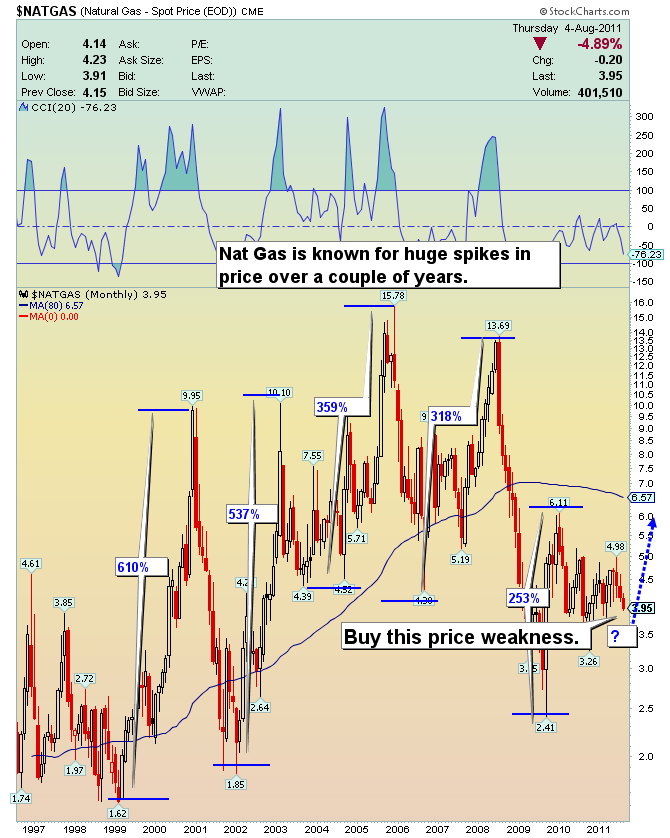
Natural Gas Long Term Chart
- This chart is a long term look at gas, demonstrating why it is wise to be building a solid position in this commodity. Seasonally, this is a time of the year when the trade in gas begins to firm, so buying some now is the smart play. This commodity can spike up as much as 400%-500% in as little as two years!
Friday, Jul 3, 2026 Super Force Signals Unique Introduction For 321Gold Readers:
Send me an email to admin@supergoldsignals.com and I’ll send you my free “Inflation Thunder Now!” gold and silver stocks video report. I’ll also include 3 of my next Super Force Surge Signals free of charge, as I send them to paid subscribers. Thank you!
|
Stay alert for our Super Gold alerts, sent by email to subscribers,
for both the daily charts on Super Force Signals at www.supergoldsignals.com and for the 60 minute
charts at www.supergoldsignals.com
About Super
Gold Signals:
Our Surge Gold Signals are created thru our proprietary blend
of the highest quality technical analysis and many years of successful
business building. We are two business owners with excellent synergy.
We understand risk and reward. Our subscribers are generally successfully
business owners, people like yourself with speculative funds,
looking for serious management of your risk and reward in the
market.
Frank Johnson:
Executive Editor, Macro Risk Manager.
Morris Hubbartt: Chief Market Analyst, Trading Risk Specialist.
website: www.supergoldsignals.com
email:
admin@supergoldsignals.com
email: admin@supergold60.com
Mail:
1276 Lakeview Drive
Oakville, Ontario, L6H 2M8
Canada
###
Aug 5, 2011
Morris Hubbartt
321gold
Ltd
|
