Super Force Signals - A Leading
Market Timing Service
We Take Every Trade Ourselves
Gold Juniors Stress Test
Morris Hubbartt
Weekly Market Update Excerpt
posted Aug 3, 2012
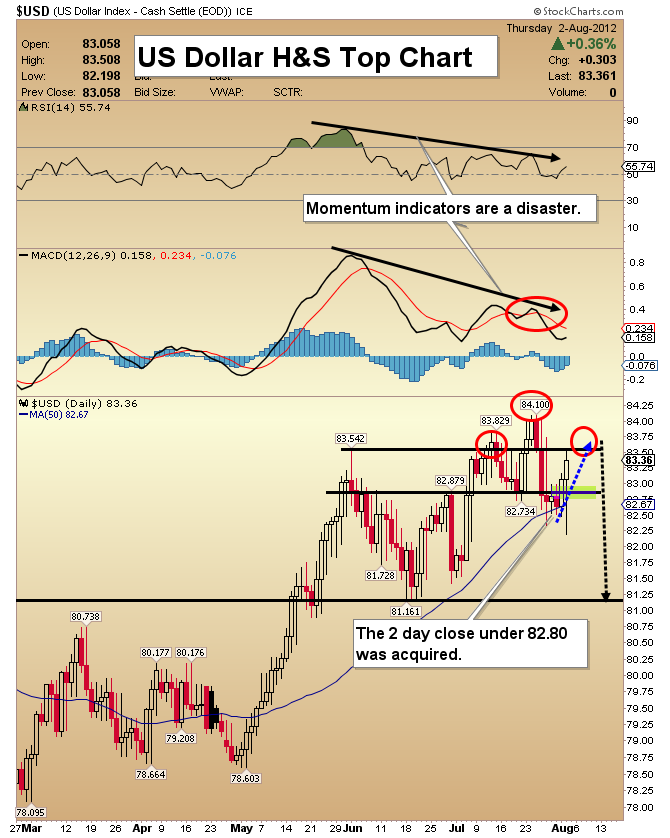
US Dollar Head & Shoulders Top Chart
- The US dollar is trading near a critical point, the 82.80 level. I had projected that once the dollar closed under that key level for two consecutive days, the trend would become bearish.
- That happened this week, and now a complex head and shoulders top pattern has appeared.
- A right shoulder is forming now, and I believe the next move will be a decline to about 81.16.
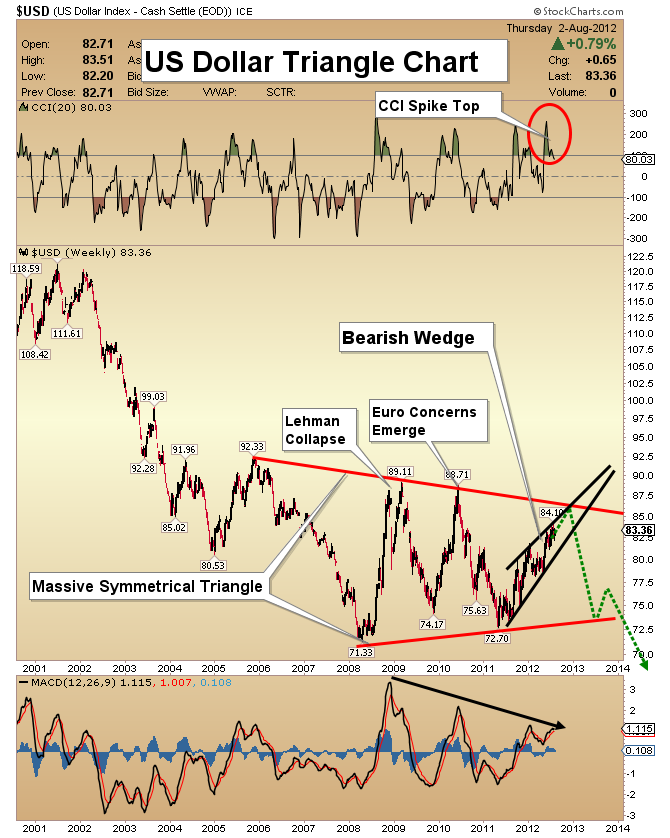
US Dollar Triangle Chart
- For many months, as gold has gone through what seems be a frustratingly slow bottoming process, I have used COT report analysis to shrink my dollar position, and enlarge my gold position.
- There’s a huge spike top on the CCI indicator on this weekly chart of the dollar, and a bearish wedge.
USD Sentiment Chart
- As you can see, the public is extremely bullish on the dollar. As a group, the public is almost always wrong. Being part of a herd might make an investor feel good, but is it profitable?
- The weight of the evidence suggests that while it may feel good to be long the dollar now, that trade is not going to work out very well for its participants.
- Sell the dollar. Buy gold.
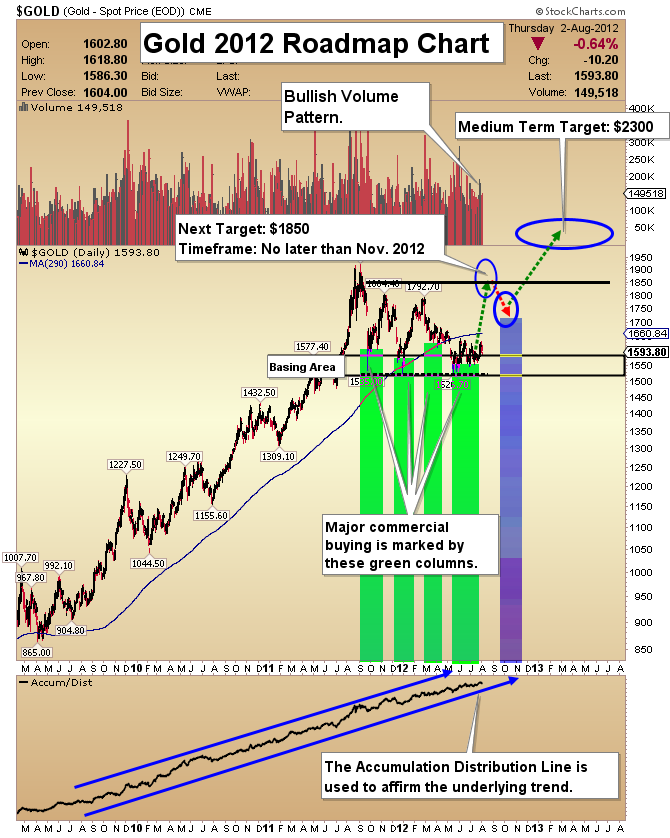
Gold 2012 Roadmap Chart
- Gold is likely completing a major basing process, which has taken nearly a year. Generally speaking, the bigger a base is, the bigger the next phase of the bull market will be. “Smart money” commercial traders continue to buy most of this price weakness.
- One of my favorite money flow indicators is the Accumulation Distribution (A/D) indicator.
- I use the A/D to confirm an investment vehicle’s underlying trend, and to anticipate reversals, when it diverges from the price.
- The action of the A/D indicator suggests that major buying has intensified since the correction began. This powerful indicator is predicting all-time highs for gold.
Gold Sentiment Chart
- The most sophisticated gold investors are buying gold, while the public has been selling. This powerful combination of money flows should lead to much higher gold prices.
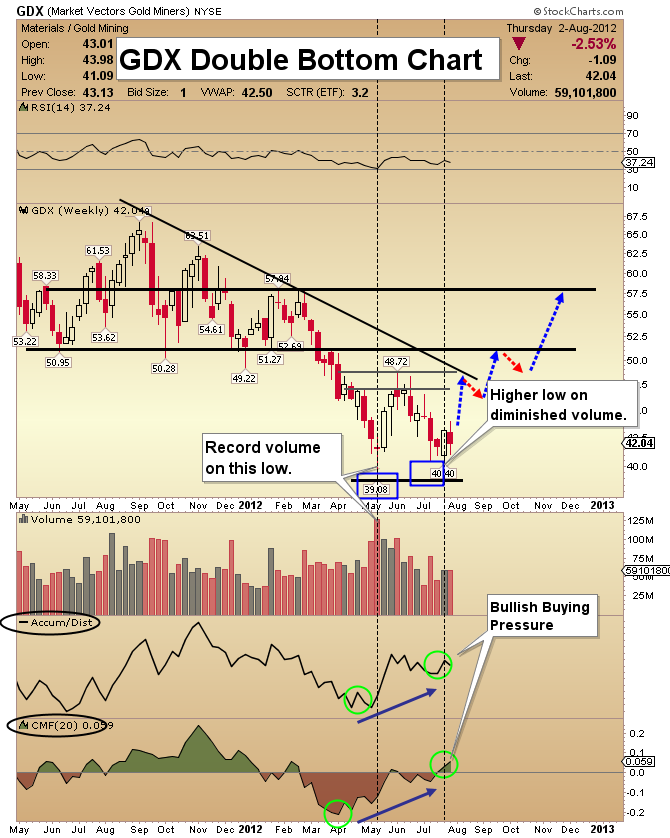
GDX Double Bottom Chart
- The greatest opportunity for investors is probably in gold stocks. Consider the ounces in the ground held by your company, and what those ounces could be worth in the future.
- Technically, gold stocks are making solid progress on a daily and weekly basis. There is a “showcase” double bottom pattern on this weekly chart, with money flow indicators and volume indicating that much higher prices are coming.
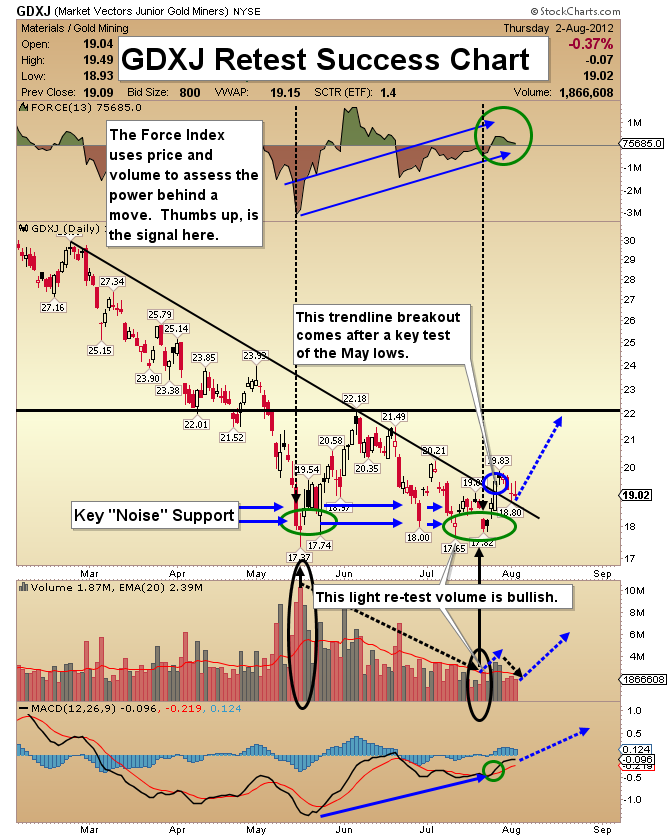
GDXJ Retest Success Chart
- Price and volume patterns continue to point to a change in GDXJ trading, from basing to price advancement.
- On the above chart I’m using the Force Index (FI) oscillator on top of the chart. The FI is a volume-based money flow indicator, and it is pointing to higher prices for junior gold stocks.
- After breaking above a key downtrend line on rising volume last week, GDXJ has drifted lower on falling volume, which is very bullish.
- MACD is now in a rising mode, which is price-supportive. Yesterday’s price action was particularly outstanding; the Dow fell very hard, as did gold, yet GDXJ had a relatively good day.
- Double bottoms are really a technical stress test. The mettle of investors, and the stocks they hold, is tested severely. In the case of GDXJ, the stress test appears to have been passed with flying colors!
- The juniors are beginning to show they can hold their own, and outperform.
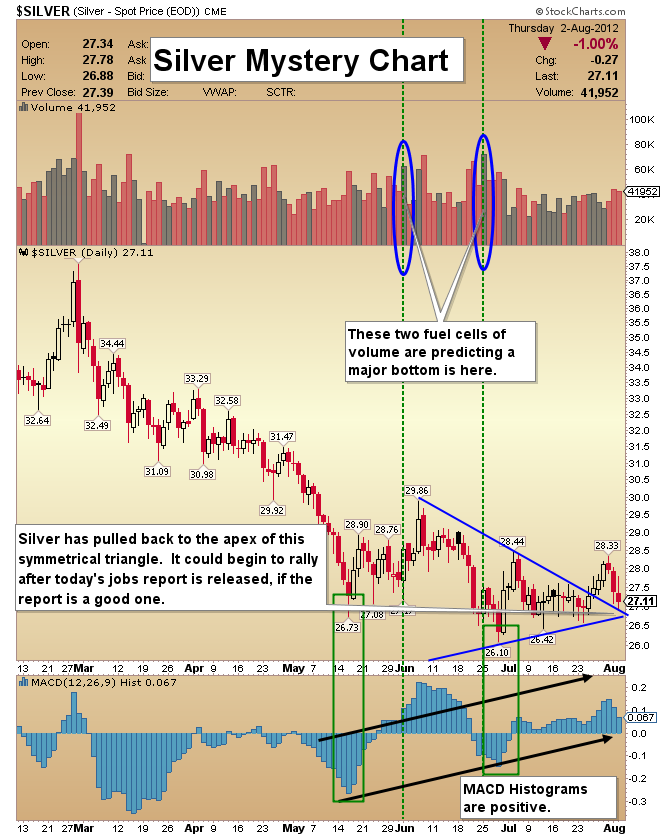
Silver Mystery Chart
- Silver should be a solid holding for all precious metals investors. Twin FCV (fuel cell volume) indicators have laid the ground work for higher prices.
- MACD histograms are in a steady uptrend, yet the price went to a new low. The refusal of MACD to confirm the move from $26.73 to $26.10 is significant.
- There is also a very interesting pullback to the apex of a symmetrical triangle. It came after a bullish breakout to the upside.
- The mystery of where the silver price is going next could be solved by today’s jobs report “detective”. Silver sold off slightly this week, on news that China’s economy is struggling. A strong American jobs report today could cause silver to trade lower initially, due to worries that QE3 isn’t required.
- Institutional money managers know that if the economy is strengthening on its own, it means more demand for silver.
Friday, Jul 10, 2026 Super Force Signals Unique Introduction For 321Gold Readers:
Send me an email to admin@supergoldsignals.com and I’ll send you my free “Inflation Thunder Now!” gold and silver stocks video report. I’ll also include 3 of my next Super Force Surge Signals free of charge, as I send them to paid subscribers. Thank you!
|
Stay alert for our Super Gold alerts, sent by email to subscribers,
for both the daily charts on Super Force Signals at www.supergoldsignals.com and for the 60 minute
charts at www.supergoldsignals.com
About Super
Gold Signals:
Our Surge Gold Signals are created thru our proprietary blend
of the highest quality technical analysis and many years of successful
business building. We are two business owners with excellent synergy.
We understand risk and reward. Our subscribers are generally successfully
business owners, people like yourself with speculative funds,
looking for serious management of your risk and reward in the
market.
Frank Johnson:
Executive Editor, Macro Risk Manager.
Morris Hubbartt: Chief Market Analyst, Trading Risk Specialist.
website: www.supergoldsignals.com
email:
admin@supergoldsignals.com
email: admin@supergold60.com
Mail:
1276 Lakeview Drive
Oakville, Ontario, L6H 2M8
Canada
###
Aug 3, 2012
Morris Hubbartt
321gold
Ltd

|
