Super Force Signals - A Leading
Market Timing Service
We Take Every Trade Ourselves
Gold & Silver Pullback: Textbook Bullish
Morris Hubbartt
Weekly Market Update Excerpt
posted Jul 29, 2011
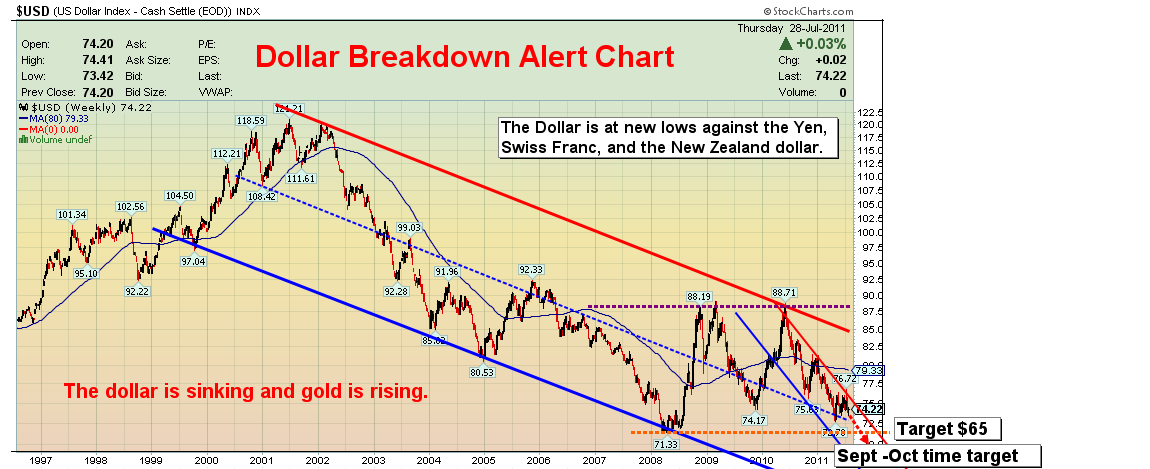
US Dollar Breakdown Alert Chart
Dollar Commentary
- Technically, the dollar is not acting well. The situation is very serious. When a market should be going up and it can’t, that action is a warning of imminent danger. The United States government is flat broke, and its debt beyond honest repayment. That is the fundamental story told technically, on the above price chart.
- The dollar often has a respectable move higher in the summer months, but not this time. The US economy and the US dollar are approaching a breaking point. My time target is unchanged as Sept -Oct for the $USD price to fall to 65. At the same time, I believe gold is setting up for a sharper trajectory.
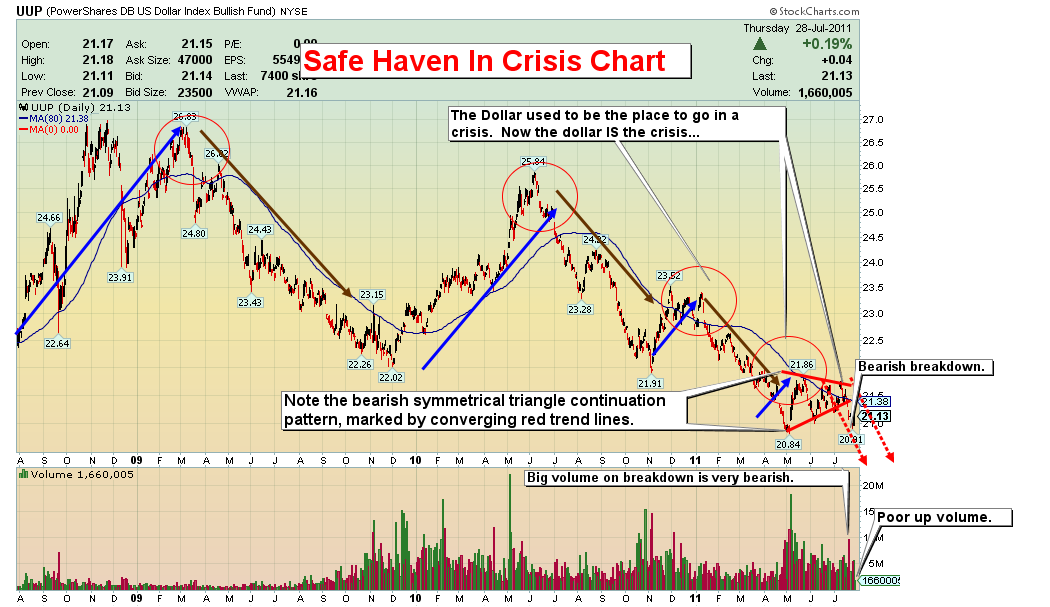
UUP (US Dollar Proxy) Chart
- The above chart of this US dollar proxy clearly indicates that with each new financial crisis, the dollar becomes less and less of a safe haven for global investors.
- Notice the breakdown on the bottom right on the chart. The triangle delivered a bear break, on volume. That action indicated more selling was coming and that is what we’ve got so far. My internal indicators show this move has more to go to the downside in the short term. That downside move should be followed by a slight bounce, then look out below as we get into my Sept-Oct 2011 timeline.
- I think the dollar is now entering the eye of the crisis hurricane storm. I have encouraged you to hold gold and silver outside of the banking system and I think it is now critical that you get it done to at least some minimum level.
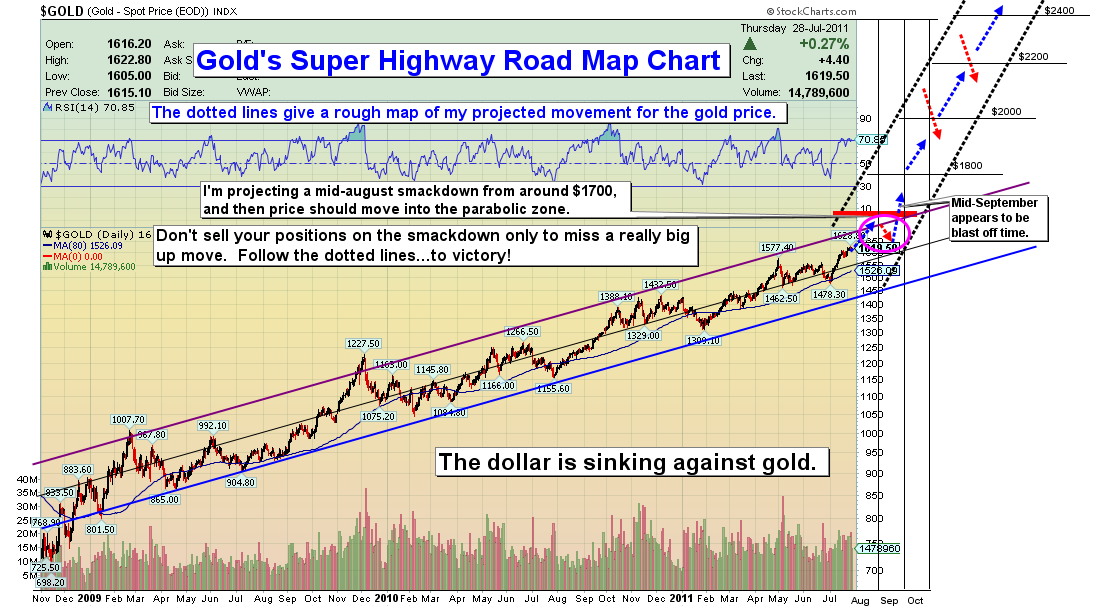
Gold Super Highway Chart
Gold Analysis
- The gold market caught the vast majority of sceptics flat footed, and continues to astound naysayers. The action this summer is an early indication of what I see coming into the fall of 2011 and beyond. I see gold moving higher to $1700, followed by a vicious smack-down from that price area.
- The gold market appears technically to be preparing to shatter the “upper window” and move on to what I term the parabolic superhighway.
- This “gold superhighway” is not going to be the pot at the end of the rainbow/free ride that many think it is. What I see is a great likelihood that this superhighway trend action will be accompanied by the type of volatility that we have never seen before, not even in the silver market recently, where silver lost over 30% in five trading days.
- This type of unprecedented volatility can be used to your advantage, or it can destroy you. I’ll be doing my very best to calibrate the timing and possible size of the declines, to keep you in the game. I’m personally positioned with 65% core positions, and 35% trading positions. The core positions form the bedrock of my strategy for dealing with extreme volatility.
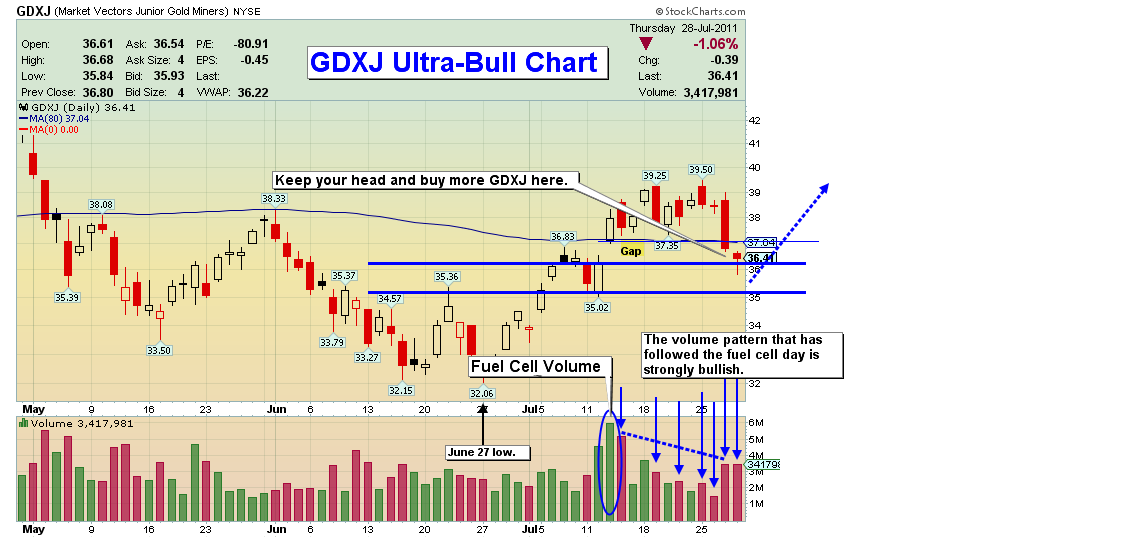
GDXJ Pullback Chart
- One of the greatest mistakes an investor can make is to allow bad market memories of a few years ago to keep them from making rational decisions today. Yes, gold stocks got hit in 2008. While gold is up 75% in three years and gold stocks are up only half of that number, that in itself doesn’t mean gold stocks are headed for “imminent meltdown”.
- My largest assets are gold, silver, and precious metals shares. I do advocate using my proprietary trading system for your risk and reward management, in the shares. Look at the phenomenal technical action displayed by gold juniors on this GDXJ chart! The repeated confirmation of almost all price action by volume is extremely bullish.
- I absolutely believe you are looking at classic “textbook” pullback action, at the start of a major uptrend.
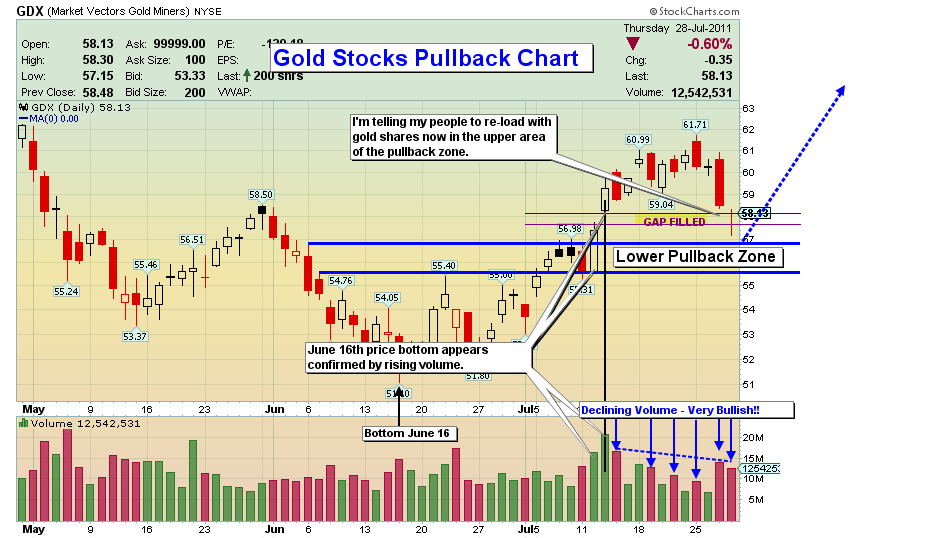
Morris GDX Pullback Chart
- I am impressed with the trade in gold stocks. What I term, “fuel cell” volume, is being followed by soft volume pullback action. That’s as good as it gets with technical analysis! These shares are acting very well after the hard pull down this week. Don’t let short term market “noise” shake you out of your earned positions.
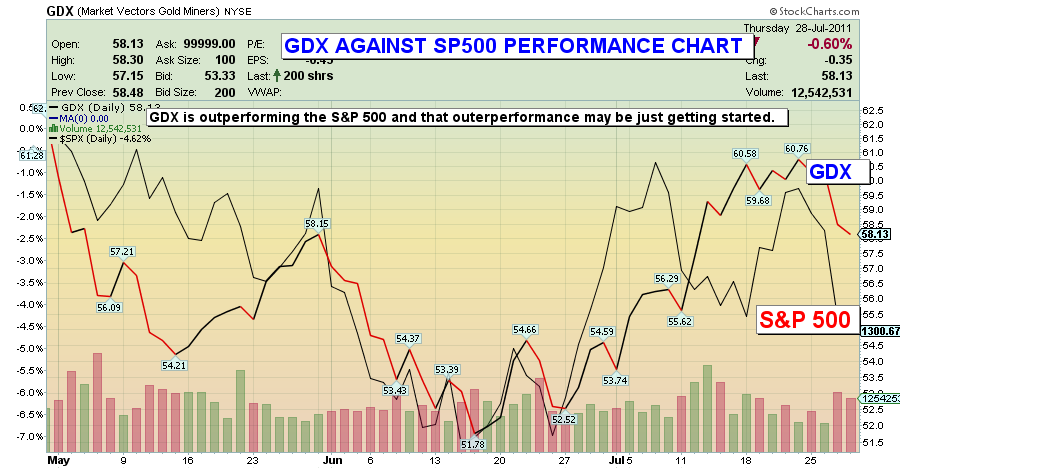
GDX Vs S&P 500 Chart
- I think gold stocks are going to be one of Wall Street’s favourite investments, eventually. GDX appears to be in the early stages of outperformance against the S&P 500. Notice how GDX is now outperforming the S&P over the last three months, but in particular since mid June. This action is another bullish development for your gold shares.
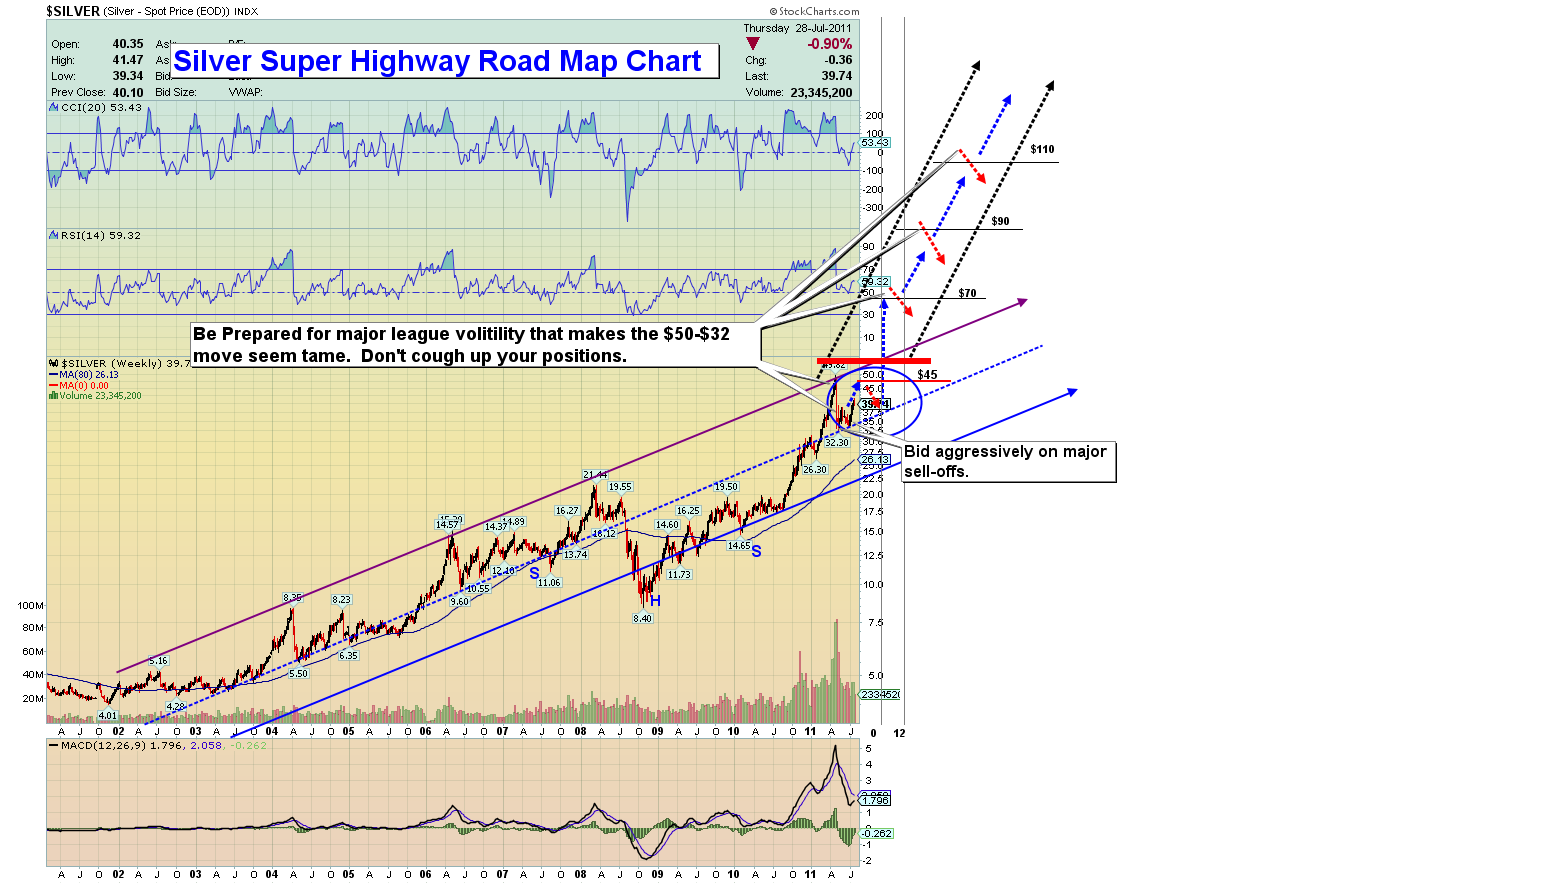
Silver Super Volatility Chart
- Silver appears set to become one of hottest and most volatile markets around in the near future. It too has shown a touch of what is coming recently. I see the upper window of the “parabolic runway” being taken out, and it likely happens shortly after the gold move.
- I was a buyer recently in the $35.00 range, before its latest charge higher. Silver may act more erratically than gold, much more so, in the “parabolic runway” zone. I expect it to disconnect from gold for brief periods of time and exhibit unprecedented violent price action, both on the upside and downside. Owning the physical metal is the only way to handle that kind of wild price movement.
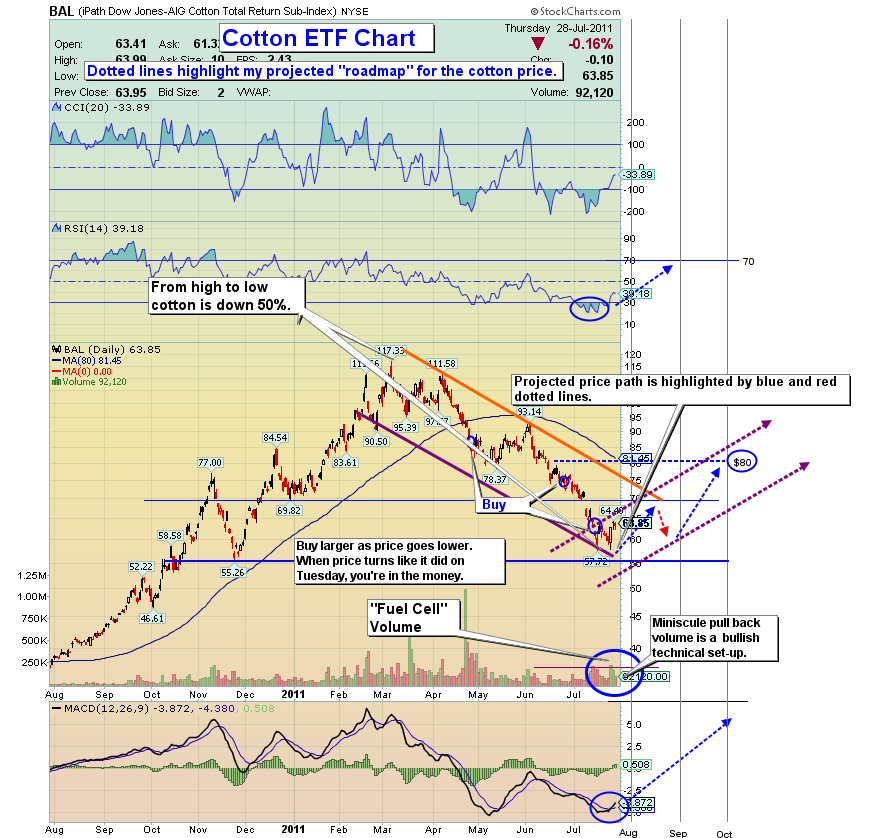
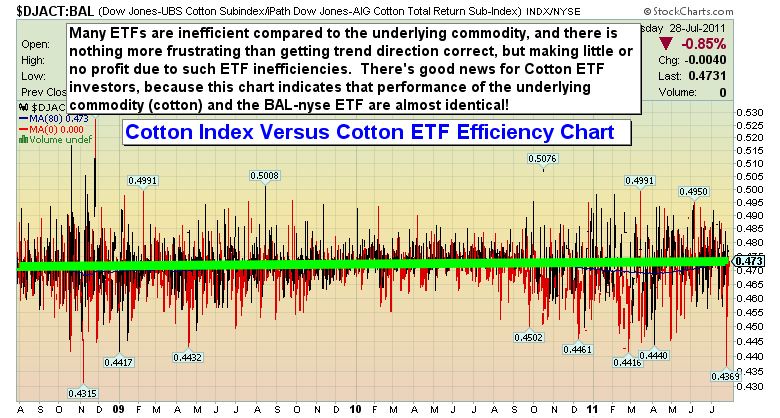
BAL (Cotton Proxy) Chart
- When an individual commodity is down 50% in a few months, I get interested. I brought you the sugar trade recently, and it soared way beyond my targets. I’m hoping the same thing happens with cotton. It’s real and its on sale! I’m recommending 5-10% of the portfolio be allocated for cotton investment. My chart work projects a 35%-50% rally into the end of the year.
Cotton Index Versus Bal ETF Chart
- The above chart gives you a three year picture of how cotton has performed, compared against BAL, the exchange-traded fund. The good news for investors is that BAL is a solid performer! Investing in BAL could be almost as good as investing directly in raw cotton, and because you can buy in small increments, it might even be better!
Friday, Jun 5, 2026 Super Force Signals Unique Introduction For 321Gold Readers:
Send me an email to admin@supergoldsignals.com and I’ll send you my free “Inflation Thunder Now!” gold and silver stocks video report. I’ll also include 3 of my next Super Force Surge Signals free of charge, as I send them to paid subscribers. Thank you!
|
Stay alert for our Super Gold alerts, sent by email to subscribers,
for both the daily charts on Super Force Signals at www.supergoldsignals.com and for the 60 minute
charts at www.supergoldsignals.com
About Super
Gold Signals:
Our Surge Gold Signals are created thru our proprietary blend
of the highest quality technical analysis and many years of successful
business building. We are two business owners with excellent synergy.
We understand risk and reward. Our subscribers are generally successfully
business owners, people like yourself with speculative funds,
looking for serious management of your risk and reward in the
market.
Frank Johnson:
Executive Editor, Macro Risk Manager.
Morris Hubbartt: Chief Market Analyst, Trading Risk Specialist.
website: www.supergoldsignals.com
email:
admin@supergoldsignals.com
email: admin@supergold60.com
Mail:
1276 Lakeview Drive
Oakville, Ontario, L6H 2M8
Canada
###
Jul 29, 2011
Morris Hubbartt
321gold
Ltd
|
