Super Force Signals - A Leading
Market Timing Service
We Take Every Trade Ourselves
Gold Sheds It's Bearish Skin
Morris Hubbartt
Weekly Market Update Excerpt
posted Jul 27, 2012
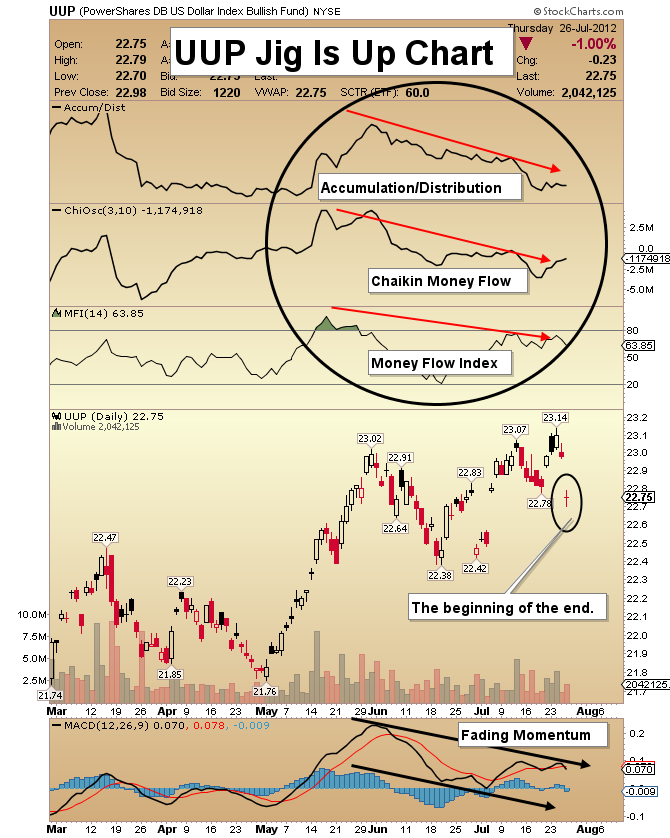
UUP (US Dollar Proxy) Jig Is Up Chart
- I have a variety of money flow indicators that indicate buying & selling pressure, using both price and volume. For the US dollar, they all indicate that the bullish jig is almost up.
- Negative candle formations are also warning that a top is forming. Black candles occur after a long advance, and are very bearish.
- A long shadow candlestick has also appeared. This formation with long upper shadows shows that buyers dominated during the first part of the session, but then heavy selling overwhelmed them.
- MACD indicates that momentum is fading.
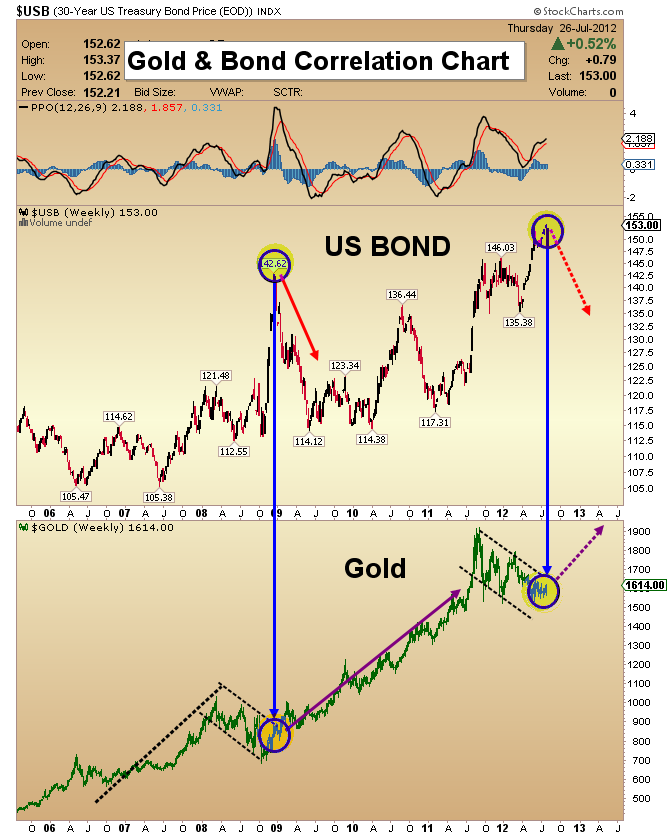
Gold and Bond Correlation Chart
- A moment of truth is approaching for two key markets; the US bond market and gold. The US bond market is overbought. It is perhaps the most over-owned investment, since the tech bubble of 1999.
- People tend to use the bond as a safe harbor investment, but US government spending is out control, and that debt is probably un-payable. Gold, on the other hand, is oversold and under-respected. My current recommendation is to sell bonds and buy gold.
- From a technical standpoint, bonds are massively overbought on the weekly chart, just as gold is oversold. In the past, when bonds peaked, gold often started a major new leg upwards. That is exactly what I see coming in the next few weeks.
- The MACD is now as low as it was in 2008. Note how it is on the verge of turning up on this key weekly chart.
- My central theme is that a major bottom is being formed, one that will usher in a multi-year price advance. Continue to hold & build positions, for maximum performance.
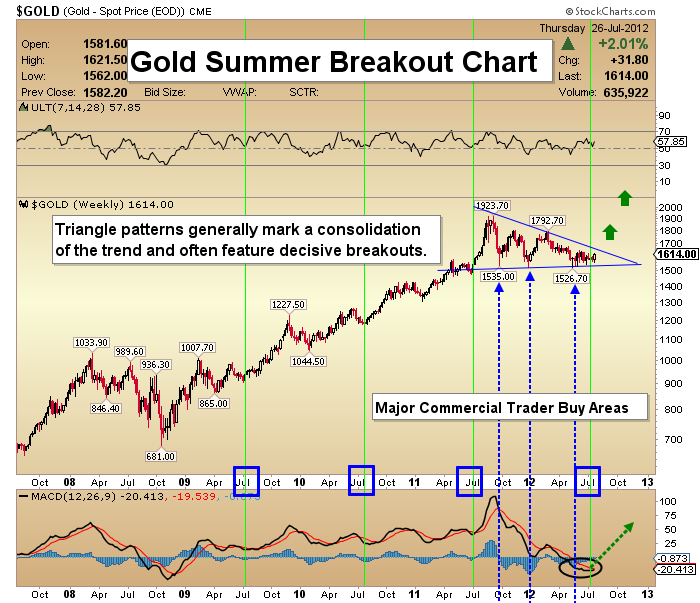
Gold Summer Breakout Chart
- Positive divergences on the technical indicators have been growing for a number of weeks now, and that is an early indicator of a coming price breakout.
- RSI is marching higher, and MACD is extremely close to flashing a huge crossover buy signal.
- Technically, gold is shedding its bearish skin, revealing a glowing bull!
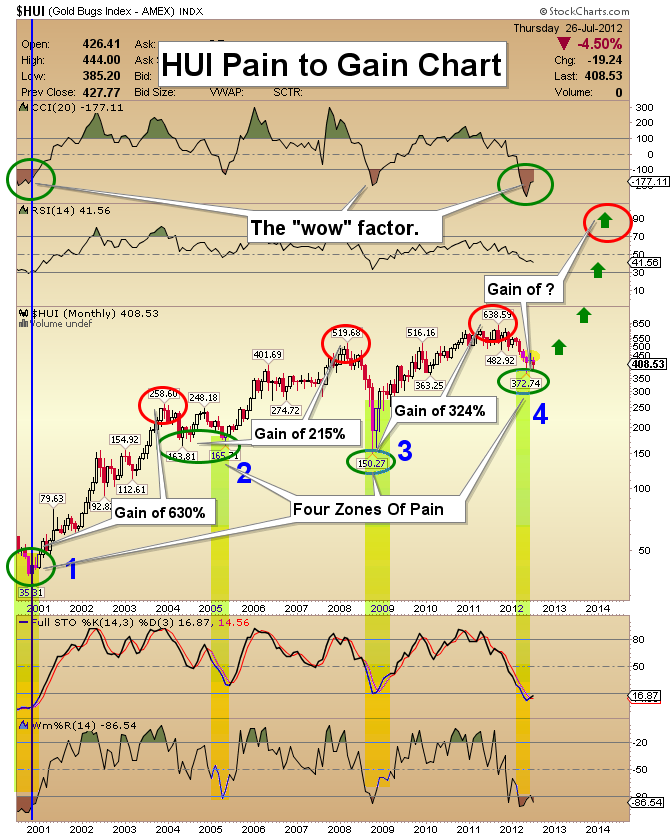
HUI Pain To Gain Chart
- I have put a lot of focus on gold stocks because they offer investors compelling opportunity.
- You have to endure the greatest pain, to get the greatest gain. In this bull market, four “zones of pain” have been followed by four zones of tremendous gain.
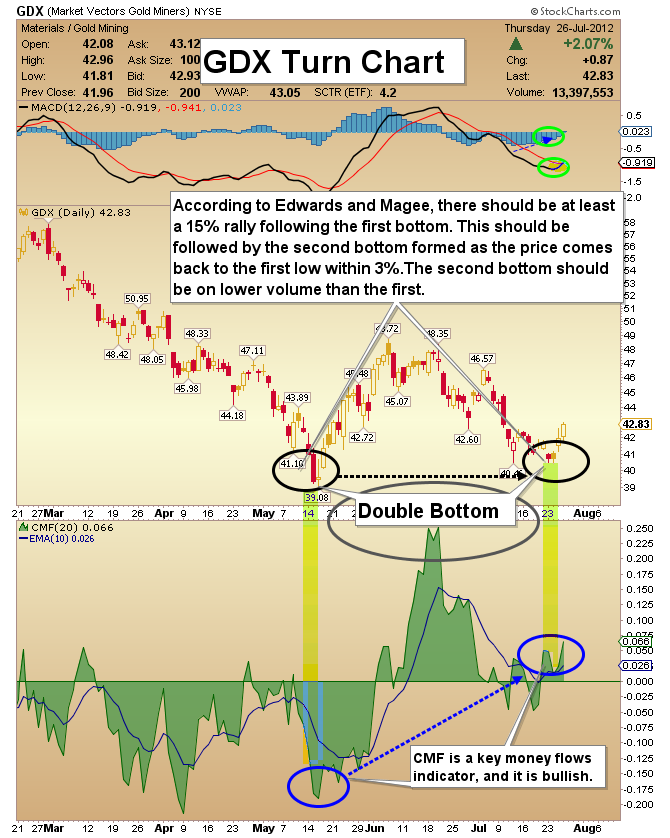
GDX Turn Chart
- I use a number of real-time money flow indicators, and they are showing evidence of heavy buying in the senior gold stocks. The action of the CMF indicator adds weight to my view that GDX has bottomed.
- Money is flowing into the sector faster than it is flowing out. Most of the sellers are exhausted, and the strongest hands are moving in.
- A classic double bottom is apparent on this chart. According to Edwards and Magee (authors of the superb “Technical Analysis of Stock Trends” handbook), there should be at least a 15% rally following the first bottom.
- Then there is a second bottom that returns the price back to the previous low (plus or minus 3%). This second bottom should be on lower volume than the first one. I believe this pattern would fit nicely in the Edwards and Magee handbook. It meets all of their technical criteria for a textbook double bottom formation.
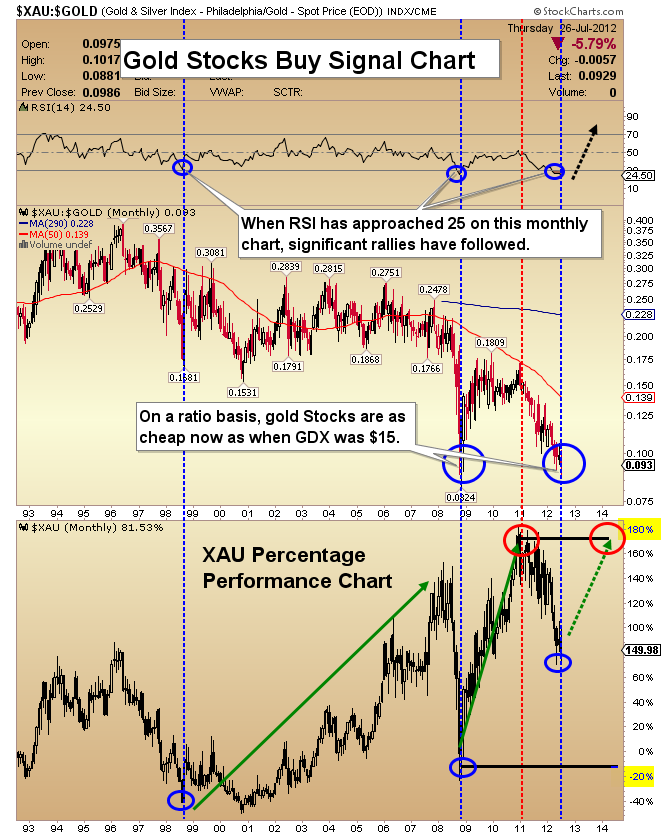
Gold Stocks Buy Signal Chart
- I believe the greatest way to measure the value of gold stocks is to compare them to gold bullion on a ratio chart.
- The above chart demonstrates how undervalued gold equities are in comparison to gold right now.
- As the gold bull market has progressed, gold stocks have fallen further behind bullion. Compared to gold, GDX is now as cheap as it was during the 2008 panic lows, when it traded at just $15 per share.
- Gold stocks could literally go up four-fold from here while gold bullion remains unchanged, and gold stocks would still not be overpriced against gold!
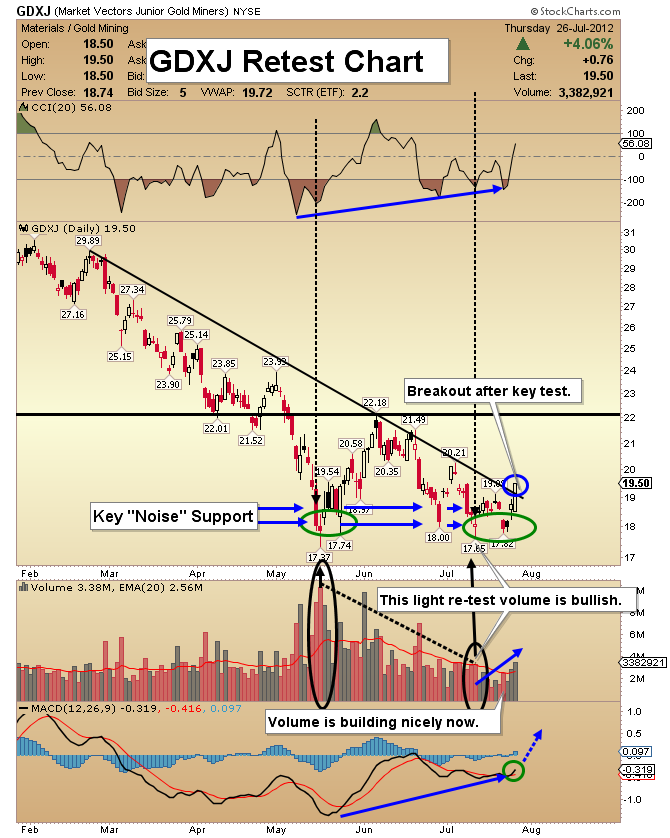
GDXJ Retest Chart
- Junior gold stocks are a compelling bargain at current prices. When GDXJ dipped under $18 earlier this week, I took that opportunity to add to my position. In the longer term, these shares should appreciate substantially.
- The GDXJ ETF is a superb vehicle for investors who don’t have the time or risk appetite for individual issues.
- If institutional money managers invest in GDXJ, some of the component stocks that you own should vastly outperform the ETF.
- Note the beautiful breakout above the downtrend line that comes after a key test of the May lows. Junior gold stocks are set to get an “A” grade on their next report card!
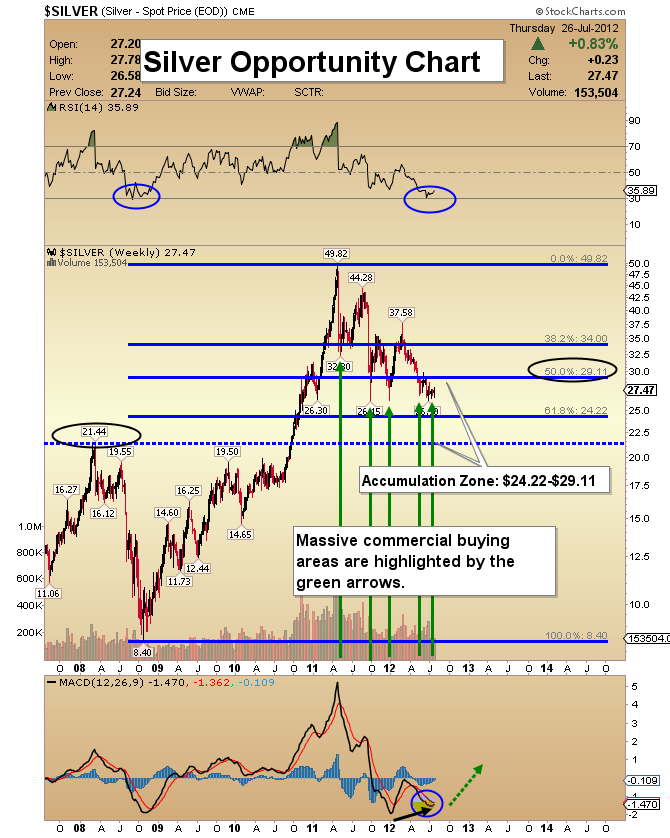
Silver Opportunity Chart
- Silver is my favorite asset to hold for the long term.
- Seasonally, this an excellent time of the year to add to your positions, especially so at these price levels.
- Commercial investors have bought this market heavily five times since the correction started. They clearly have incredible confidence that the price of silver is going higher.
- A stand-out feature on the weekly silver chart is the MACD indicator, which is very close to turning up and starting a new uptrend.
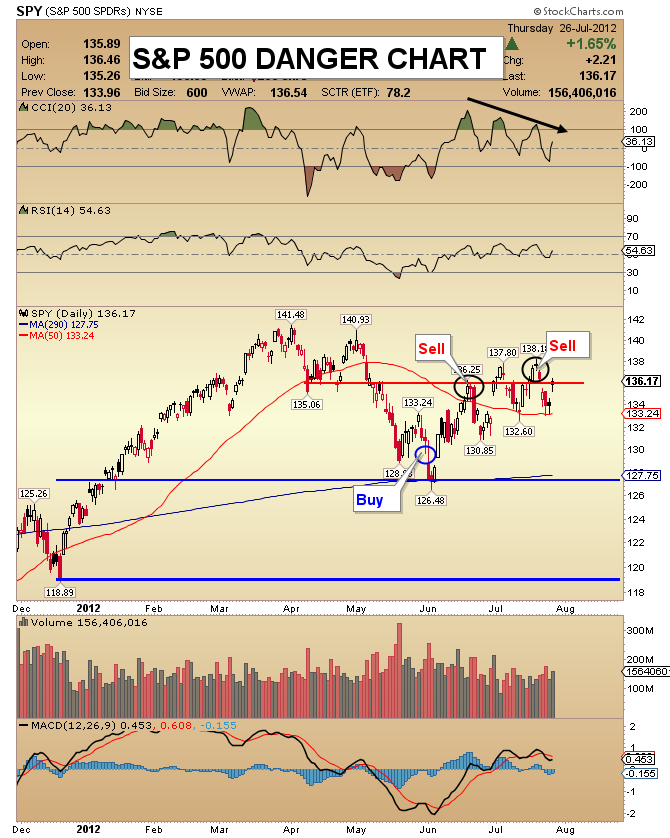
SPY (S&P 500 Proxy) Danger Chart
- What I see now is the possibility for more short term weakness, with a real chance of much deeper losses coming in the next few weeks. Keep your stock market powder dry!
- While the general stock market is loaded with risk right now, I believe we are close to a “watershed moment” for gold stocks, where they totally disconnect from the action of the general stock market, and quickly become the world’s top performing asset!
Friday, Jul 17, 2026 Super Force Signals Unique Introduction For 321Gold Readers:
Send me an email to admin@supergoldsignals.com and I’ll send you my free “Inflation Thunder Now!” gold and silver stocks video report. I’ll also include 3 of my next Super Force Surge Signals free of charge, as I send them to paid subscribers. Thank you!
|
Stay alert for our Super Gold alerts, sent by email to subscribers,
for both the daily charts on Super Force Signals at www.supergoldsignals.com and for the 60 minute
charts at www.supergoldsignals.com
About Super
Gold Signals:
Our Surge Gold Signals are created thru our proprietary blend
of the highest quality technical analysis and many years of successful
business building. We are two business owners with excellent synergy.
We understand risk and reward. Our subscribers are generally successfully
business owners, people like yourself with speculative funds,
looking for serious management of your risk and reward in the
market.
Frank Johnson:
Executive Editor, Macro Risk Manager.
Morris Hubbartt: Chief Market Analyst, Trading Risk Specialist.
website: www.supergoldsignals.com
email:
admin@supergoldsignals.com
email: admin@supergold60.com
Mail:
1276 Lakeview Drive
Oakville, Ontario, L6H 2M8
Canada
###
Jul 27, 2012
Morris Hubbartt
321gold
Ltd

|
