Super Force Signals - A Leading
Market Timing Service
We Take Every Trade Ourselves
Gold: Accerated Rate Of Rise Tactics
Morris Hubbartt
Weekly Market Update Excerpt
posted Jul 22, 2011
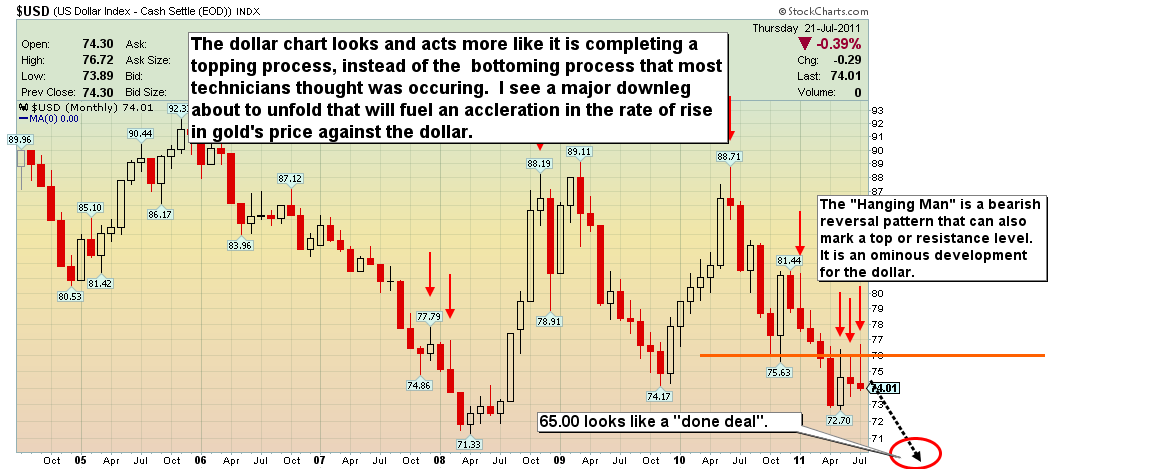
US Dollar Chart
Dollar Commentary
- The new “Gang Of Six” proposal brewing in the US Senate could bring a substantial increase in taxation. This debt crisis has its roots in too much government, spending too much money. The actions of the politicians in the debt negotiations are intensifying the gold bull market.
- Additional taxes could severely damage the real economy and money printing would almost certainly follow. The economy is moving at the speed of a stagnating pond. Liquidity (money printing) is going to be coming from all corners of the globe as economies begin to weaken. Look at the above dollar chart.
- The widely predicted “imminent dollar rally” has failed, and that is just against other paper currencies. The dollar bulls have gone silent, and still don’t seem to understand the terrible technical situation of the dollar on the chart.
- Against gold, the dollar is being ripped to pieces. I have argued that the dollar will begin a major down leg by the fall, and I believe gold is on the cusp of the most powerful leg of the bull market.
- As an investor, what action do you take? The answer is to hold a large core position in physical metal. My recommendations have not waivered; 65% core positioning in precious metals. This gold market could be heading into an untradeable phase, and in such situations you must hold substantial core positions regardless of what the charts indicate could happen.
- Gold is making new highs against all currencies. The events in Europe have been unfolding like a nightmare, yet the dollar remains a dog against the Euro, and is being ground into hamburger meat by gold.
- On the charts against gold, both the dollar and the Euro are acting like junk bond currencies with debts that are un-payable. There is a growing awakening amongst reputable money managers that precious metals are the only true safe haven from this madness.
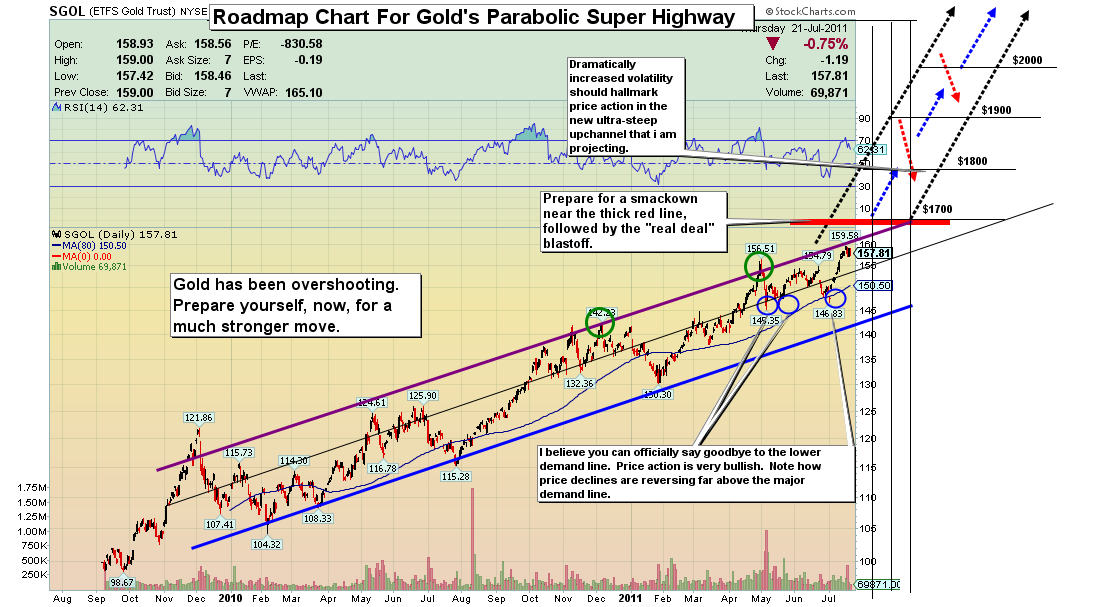
SGOL (Gold Bullion Proxy) Super Highway Chart
Gold Analysis
- I believe the time is drawing near for gold to enter the long-awaited and now-doubted parabolic phase. Everything technical that I’m seeing on my charts indicates this is the case.
- My call for many weeks was to see gold break out on the upside in late June- early July, which has clearly happened. What is next for gold from here? Well, the action in gold and silver so far this summer indicates to me that this is the beginning of a trend breaking rise in price. This literally will be the move to take the parabolic window out, and set the metals in a much steeper yet more volatile price path.
- Look carefully at my “parabolic superhighway chart”. I want you to remain calm. In the past, many analysts have called for a parabolic move and investors surged in, crazily buying anything and everything at any price. They were disappointed quickly, and sold at losses. I see great volatility in this coming move, and the price swings will cause great fear amongst investors. This is not a “back up the truck and buy” call. I want to walk you through the tactics a professional technician uses to handle themselves when such a move presents itself as a possible or likely event.
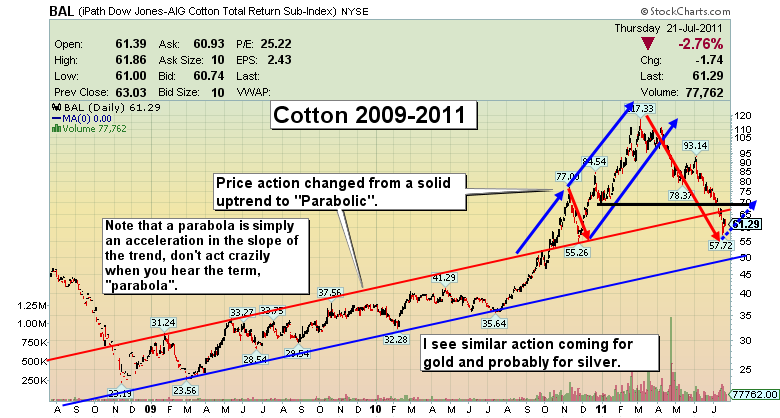
- I have included a chart of cotton (via BAL-nyse), to demonstrate something similar to what I see unfolding in gold, and possibly in silver too, over the next few months. It is not just “buckle your seat belts, it's blast off time!”, but, price appears set to push above the upper supply trend line and begin an accelerated rate of rise.
- If you just charge in and buy as price surges higher, I can almost guarantee you will suffer far more pain than you felt in May. The term “parabola” should probably be toned down to “accelerated rate of rise”, if you are going to keep yourself from losing your head in this market.
- I would be happy just to see the current uptrend in gold continue at the current rate of rise, but the fundamentals of the western world economies are demanding a much higher gold and silver price, much sooner than this uptrend is providing, and my charts are telling me the same thing as the fundamentals; gold is setting up to go parabolic (accelerate its rate of rise), against the dollar.
- An accelerated rise in gold is highly likely to take most or even all other commodities into a similar type of move, and the standard of living in America may rapidly deteriorate. This is all happening because of an addiction to debt.
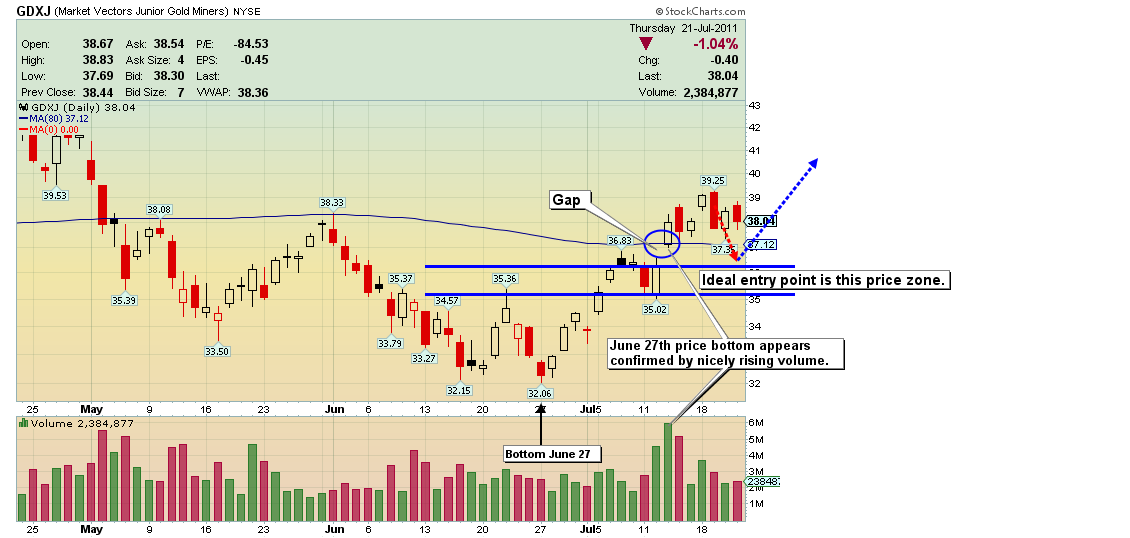
GDXJ (Gold Juniors ETF) Volume Chart
- As mentioned above, a 65% core should be held in precious metals investments, and GDXJ plays a key role in my current recommended portfolio. I issued a modest profit taking alert for GDXJ on the trading portion of your GDXJ position on Monday. I asked you to buy with size into the recent lows, and many of you have reported you did so.
- Further weakness on soft volume could send price into the buying area I have highlighted on the chart. So far, the volume is indeed soft, which is a positive sign.
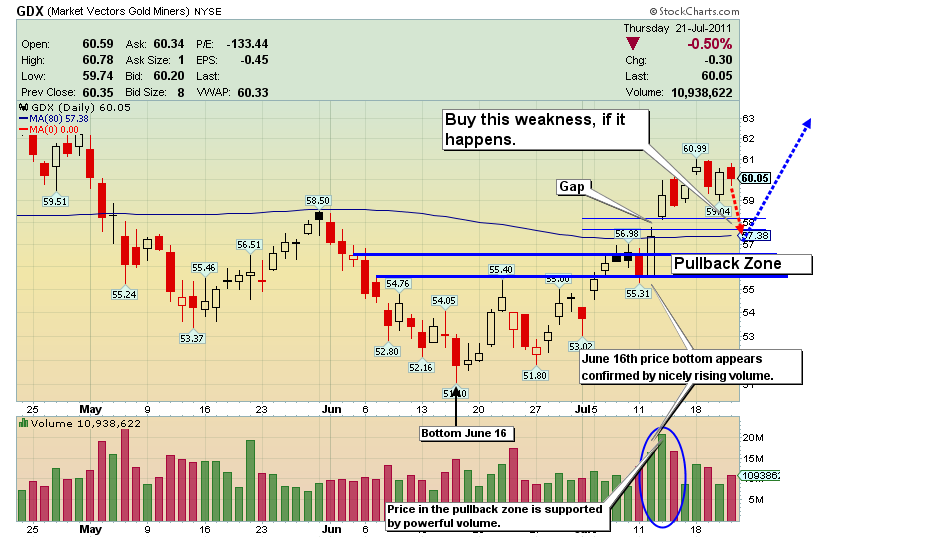
GDX Volume Chart
- Like GDXJ, price on this chart appears headed towards VBS (volume-based support) in what I’ve labelled the pullback zone, and I believe it is an ideal point of entry for you. Volume on the pullback has been very mild, and that is exactly what I want to see.
- It is also important to note the identified gap area on both the GDX and GDXJ charts. The street adage “all gaps are filled” tends to go awry in the strongest of bull markets, which is what I believe we are dealing with here. There is no guarantee that we will see the market get back to the pullback zone.
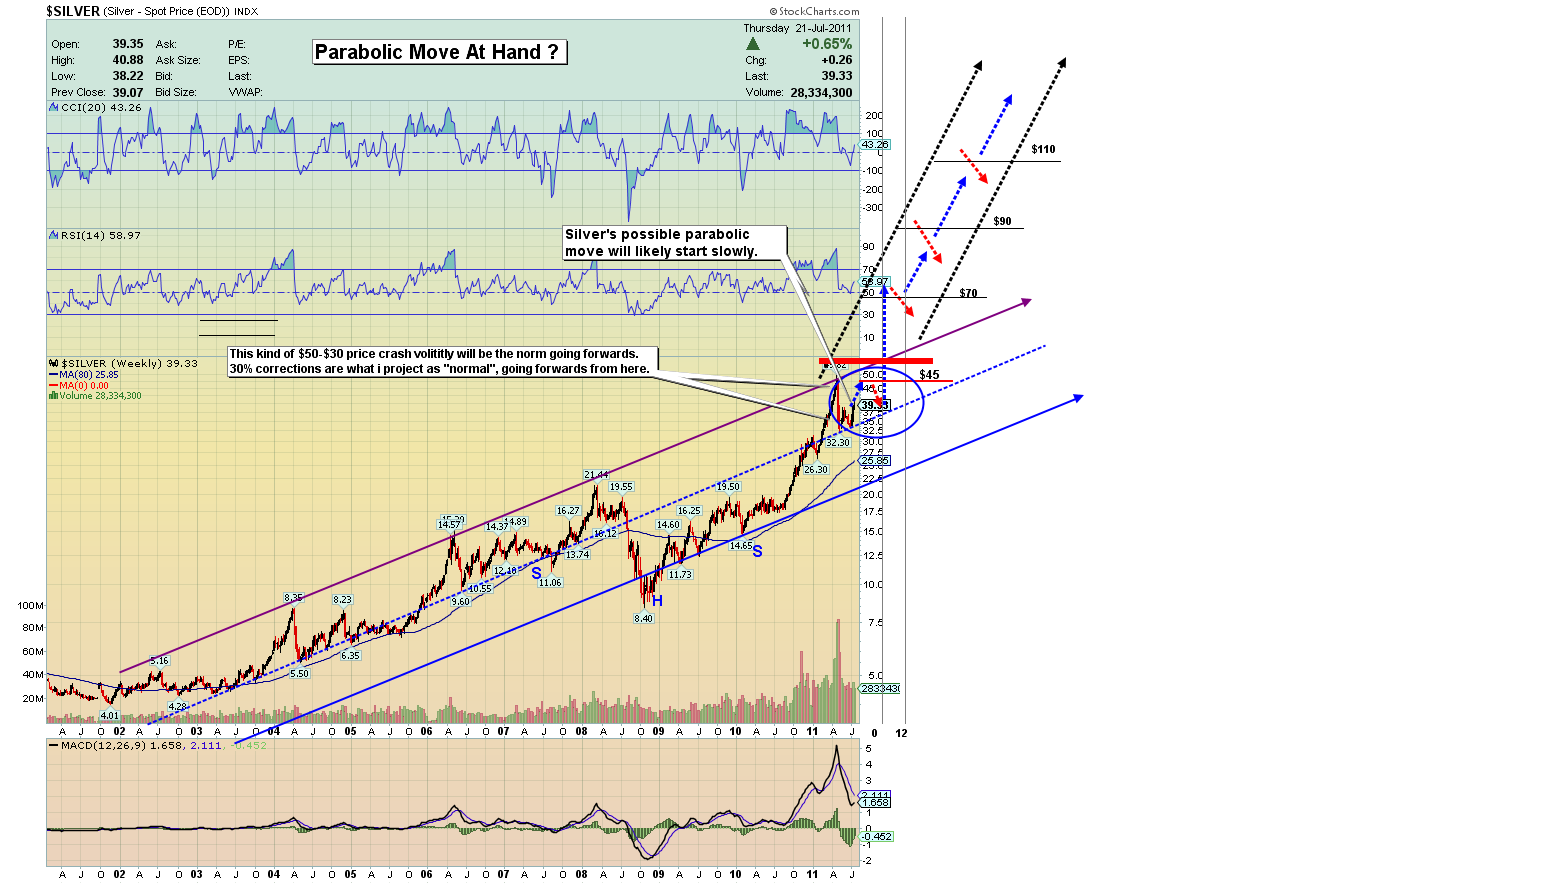
Silver Chart
- This is the weekly chart for silver. Price rode along the top half of the channel, until the crash of 2008, when it fell hard to the lower level of the uptrend. Silver spent the next two years marching higher, but along the lower part of the channel, until it made a stronger move higher late last year. Silver has reclaimed the upper band, and I believe price is preparing for a much greater move higher.
- The likely path for silver is to break out of the “parabolic window”, and begin an extended rise in price that could see silver move towards $80 or higher.
- Jim Rogers has noted that price can move hundreds of percent higher in a parabolic movement of price, so even trying to label a top target is probably pre-mature at this point in time. In a worst case scenario, if price were to collapse back into the $20 area before bursting out of the top of the current channel, I would buy a tremendous amount of silver, but I think such a move into that $20 price zone is now unlikely.
- Everything from sentiment, to tight physical supply, to enormous industrial demand (needed for solar energy) is indicating silver is going higher, but it is the horrific condition of the US dollar that is working to create a parabolic event in gold, one that has a solid chance of being replicated by silver.
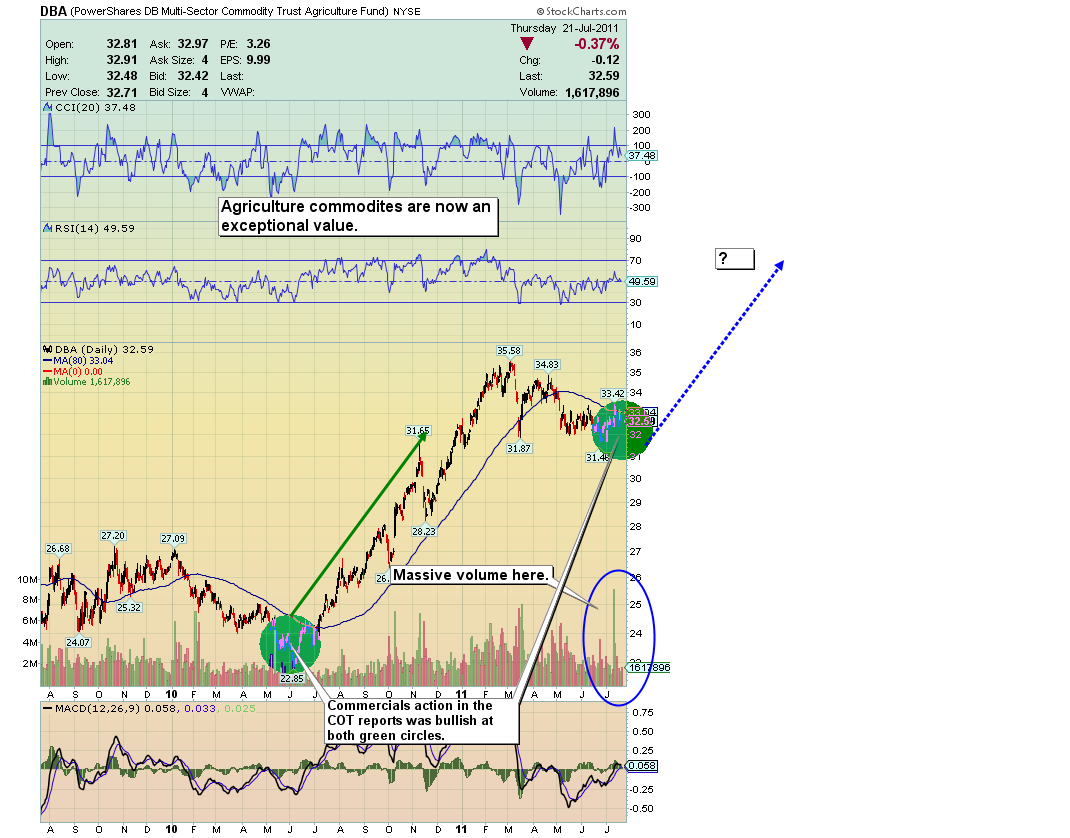
DBA Agriculture Chart
- My technical work shows the agriculture sector is one worth allocating capital to, at current levels. My technical trading system is producing key buy signals right now.
- I have been advocating that investors move from stock sectors like the Dow or SP500 to agricultural commodity investments like DBA. Based on the above chart, I believe prices of agriculture investments are near the end of a consolidation that will be followed by a substantial move higher for the intermediate term.
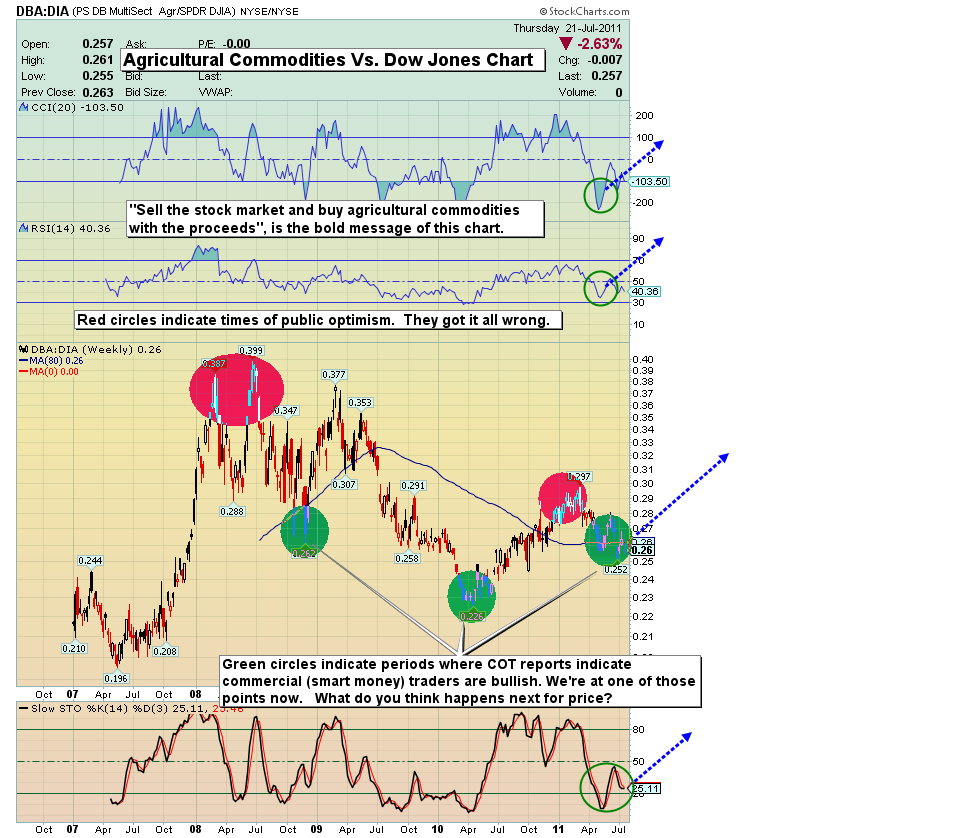
DBA (Agriculture) vs DIA (Dow Proxy) Chart
- This chart's green circles indicate times where commodities have moved to outperform equities substantially, and each of those periods in time have seen bullish commercial money flows into agricultural investments.
Friday, Jul 3, 2026 Super Force Signals Unique Introduction For 321Gold Readers:
Send me an email to admin@supergoldsignals.com and I’ll send you my free “Inflation Thunder Now!” gold and silver stocks video report. I’ll also include 3 of my next Super Force Surge Signals free of charge, as I send them to paid subscribers. Thank you!
|
Stay alert for our Super Gold alerts, sent by email to subscribers,
for both the daily charts on Super Force Signals at www.supergoldsignals.com and for the 60 minute
charts at www.supergoldsignals.com
About Super
Gold Signals:
Our Surge Gold Signals are created thru our proprietary blend
of the highest quality technical analysis and many years of successful
business building. We are two business owners with excellent synergy.
We understand risk and reward. Our subscribers are generally successfully
business owners, people like yourself with speculative funds,
looking for serious management of your risk and reward in the
market.
Frank Johnson:
Executive Editor, Macro Risk Manager.
Morris Hubbartt: Chief Market Analyst, Trading Risk Specialist.
website: www.supergoldsignals.com
email:
admin@supergoldsignals.com
email: admin@supergold60.com
Mail:
1276 Lakeview Drive
Oakville, Ontario, L6H 2M8
Canada
###
Jul 22, 2011
Morris Hubbartt
321gold
Ltd
|
