Super Force Signals - A Leading
Market Timing Service
We Take Every Trade Ourselves
US Dollar Momentum Catastrophe
Morris Hubbartt
Weekly Market Update Excerpt
posted Jul 20, 2012
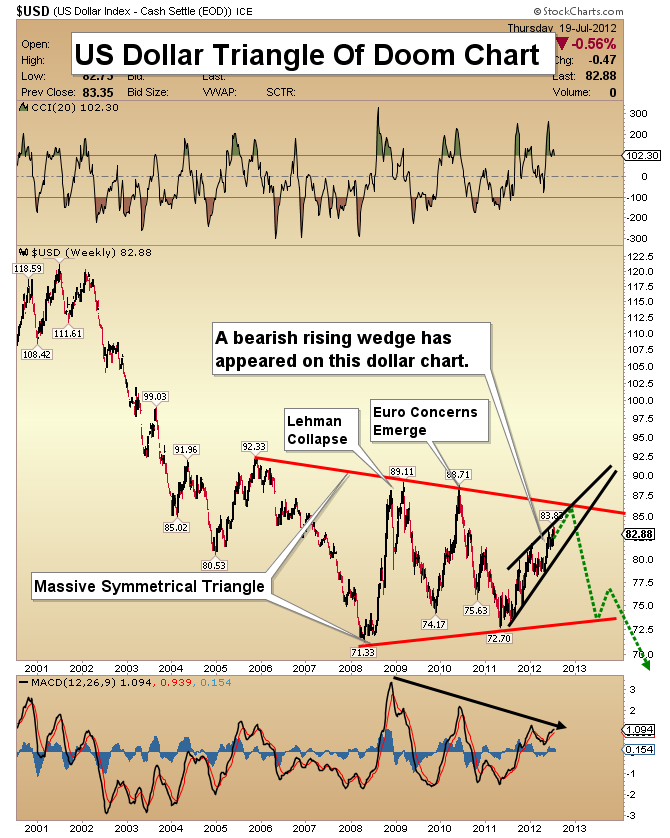
US Dollar Triangle Of Doom Chart
- The dollar is showing negative divergences and a price that has lost most of its momentum. On this chart, I doubt that further disruptions in the Euro zone could carry the dollar any higher than about 85.
- Note the bearish rising wedge pattern within the large symmetrical triangle. A symmetrical triangle is a consolidation pattern in most instances, and I think that is the case here. The rising wedge indicates that a downside break could be coming soon.
- As an American citizen and resident, I’m ashamed of what our dollar has become. The fundamentals are terrible. Un-payable debt and bloated social programs threaten to break the central bank. Currently, the tax revenues collected don’t even cover half of our government’s expenditures.
- At the end of the day, there is probably only one way to settle this debt, and that is via currency dilution.
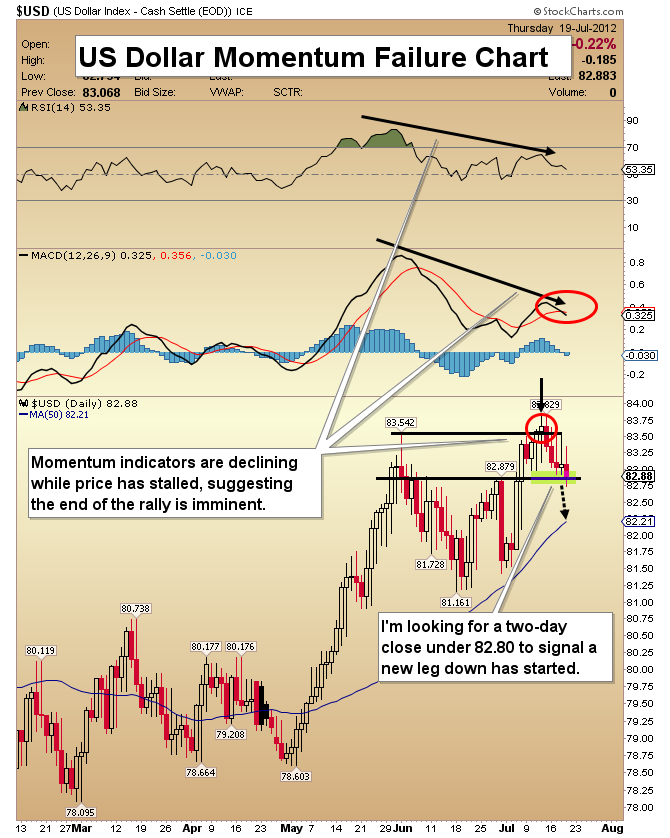
US Dollar Momentum Failure Chart
- This key chart continues to warn that the dollar is poised to show some seriously bearish price action. If it closes under 82.80 for two consecutive days, it would confirm that a new leg down is underway.
- A MACD sell signal occurred yesterday, and the recent new high in the dollar was not accompanied by new highs in either MACD or RSI. Technically, the dollar’s momentum catastrophe could have ominous price implications.
- From current price levels, the potential reward of a rally to 85 is vastly overshadowed by the potential risk of a decline to the symmetrical triangle target price of about 55.
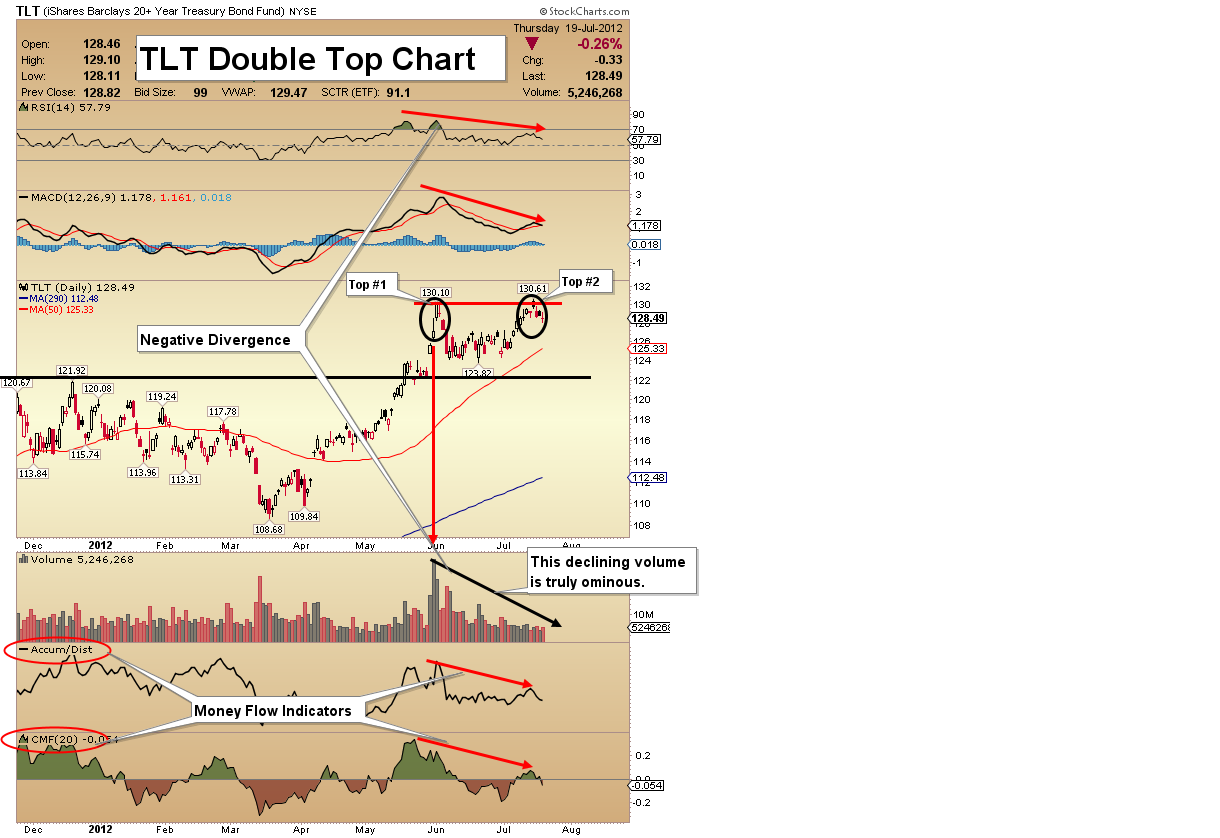
TLT (T-Bond Proxy) Double Top Chart
- There is a double top pattern in play. Beware of this investment.
- Note the key divergences shown by RSI and MACD at the top of the chart.
- The two money flow indicators at the bottom of the chart are also showing significant divergences with the price.
- Bond prices tend to fall as inflation rises. The bond market seems to be indicating that substantial inflation could be coming.
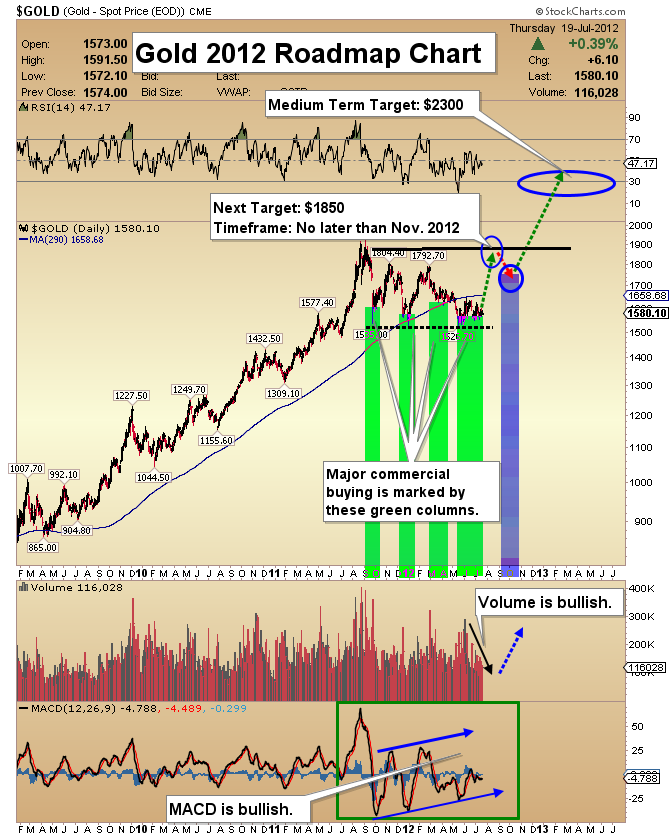
Gold 2012 RoadMap Chart
- When enduring corrective action in an ongoing bull market, it pays to keep your eye on the big picture, and that’s the purpose of this roadmap chart.
- Each gold price correction has seen strong commercial buying occur. My next upside target for gold is $1850, with a rough time target of between August and November.
- From there, I see a mild pullback, followed by a strong move towards my longer term target at $2300, which should be hit by March, 2013.
- The MACD indicator is showing a gently rising trend. Volume has declined with the gold price, and that is solidly bullish.
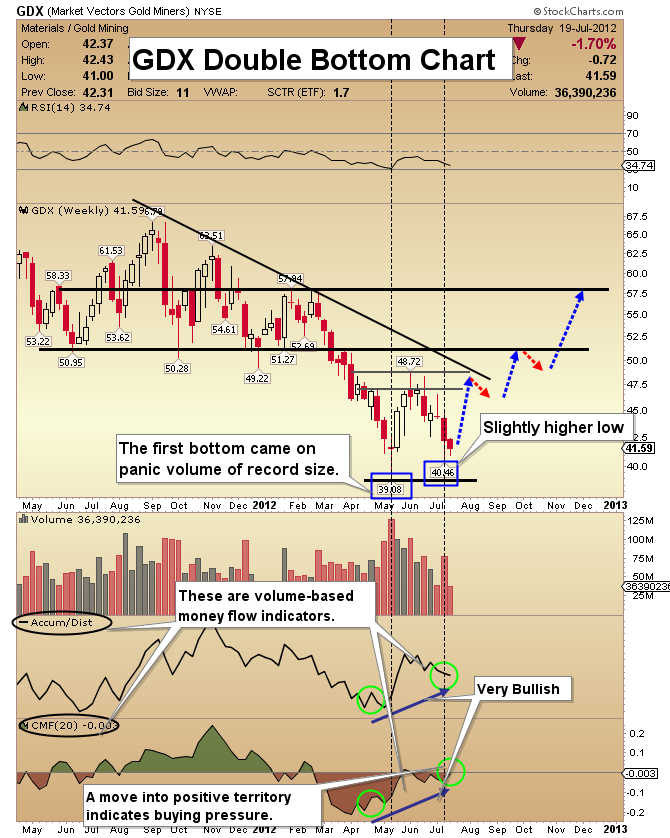
GDX Double Bottom Chart
- The double bottom that is apparent on the daily chart is now also very clear on the weekly chart, which carries more significance.
- The volume-based indicators at the bottom of the chart are rising nicely. They indicate that strong hands are buying this market.
- I am projecting a three-step recovery to the $58 price level, with “pit stops” around $48 and $51. The red and blue dotted lines highlight the price movement I am expecting in the coming weeks.
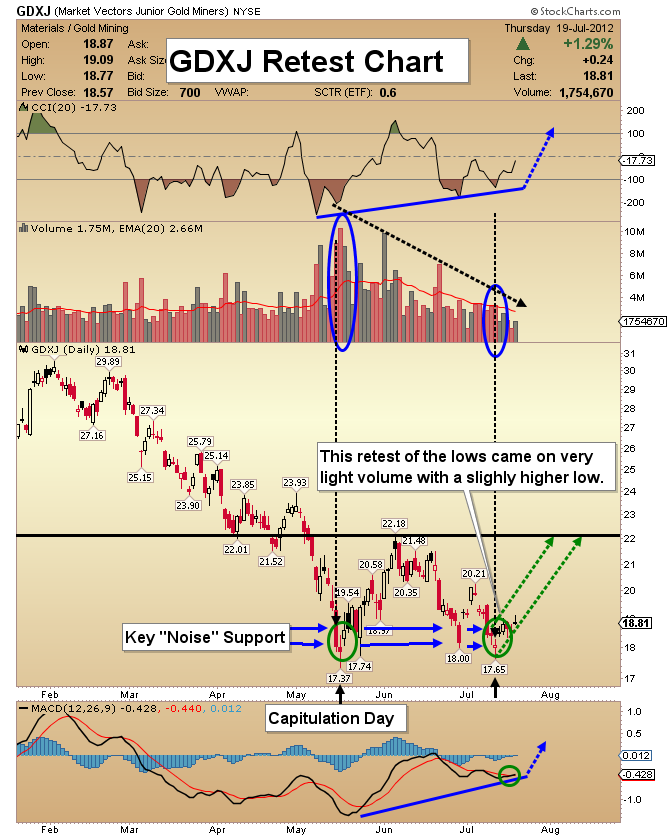
GDXJ Retest Chart
- Junior gold equities, like the seniors, are working on an important retest of the lows that occurred two months ago. Volume continues to soften along with the GDXJ price.
- Positive divergences are clearly evident. At the top of the chart, you can see CCI displaying a pattern of rising lows.
- The MACD indicator is far above the low it made during May.
- Overall, the technicals are “textbook bullish” for GDXJ!
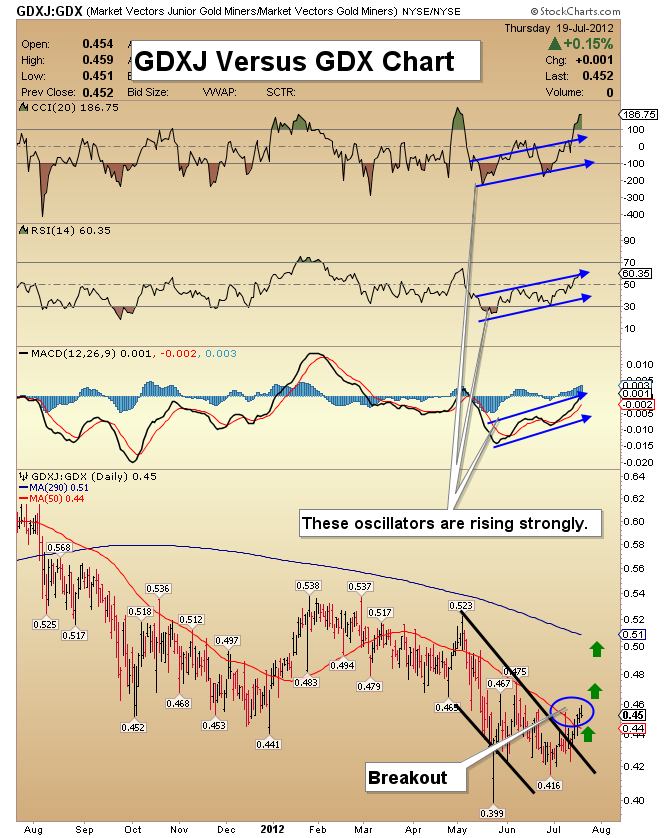
GDXJ Versus GDX Chart
- The gold juniors were hardest hit on the price correction, and now it appears that they will be the hardest hitters, on the upside.
- Note the breakout from the downtrend line. Juniors are outperforming the seniors on many trading days now, and I expect that trend to accelerate.
- The CCI indicator at the top of the chart is overbought, but in a bull trend, I want to see CCI moving rapidly up and down, while other indicators are in a steadily rising mode.
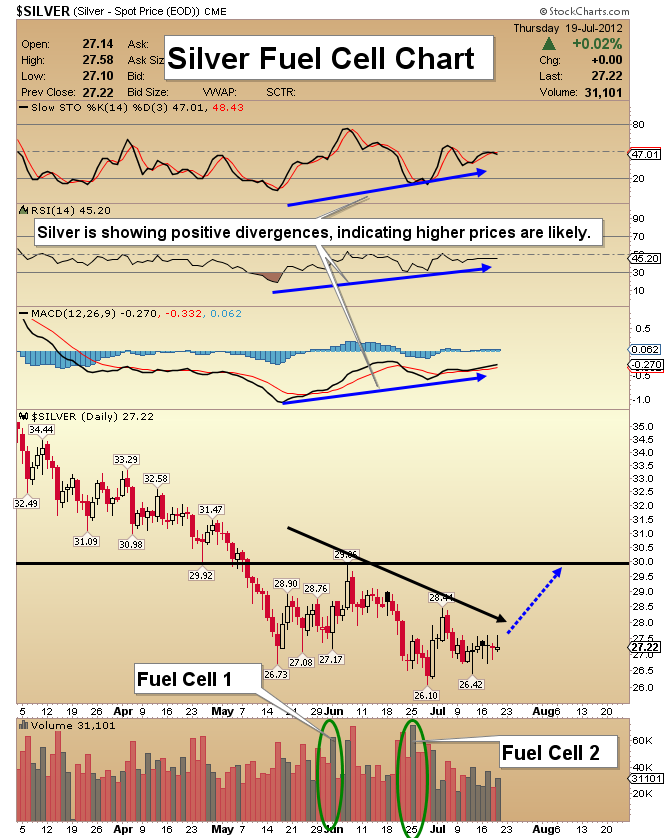
Silver Fuel Cell Chart
- Silver offers you outstanding value at current prices. Volume is bullish. Silver has drifted in July, and volume has been mild. That’s a bullish situation. Note the two FCV (fuel cell volume) indicators on the chart.
- There are growing positive divergences being displayed by Slow Stochastics, RSI, and MACD. These divergences ultimately should lead the silver price strongly higher, with the first target being $30!
Friday, Jul 3, 2026 Super Force Signals Unique Introduction For 321Gold Readers:
Send me an email to admin@supergoldsignals.com and I’ll send you my free “Inflation Thunder Now!” gold and silver stocks video report. I’ll also include 3 of my next Super Force Surge Signals free of charge, as I send them to paid subscribers. Thank you!
|
Stay alert for our Super Gold alerts, sent by email to subscribers,
for both the daily charts on Super Force Signals at www.supergoldsignals.com and for the 60 minute
charts at www.supergoldsignals.com
About Super
Gold Signals:
Our Surge Gold Signals are created thru our proprietary blend
of the highest quality technical analysis and many years of successful
business building. We are two business owners with excellent synergy.
We understand risk and reward. Our subscribers are generally successfully
business owners, people like yourself with speculative funds,
looking for serious management of your risk and reward in the
market.
Frank Johnson:
Executive Editor, Macro Risk Manager.
Morris Hubbartt: Chief Market Analyst, Trading Risk Specialist.
website: www.supergoldsignals.com
email:
admin@supergoldsignals.com
email: admin@supergold60.com
Mail:
1276 Lakeview Drive
Oakville, Ontario, L6H 2M8
Canada
###
Jul 20, 2012
Morris Hubbartt
321gold
Ltd

|
