Super Force Signals - A Leading
Market Timing Service
We Take Every Trade Ourselves
Gold, Silver, Sugar, Cotton
Morris Hubbartt
Weekly Market Update Excerpt
posted Jul 15, 2011
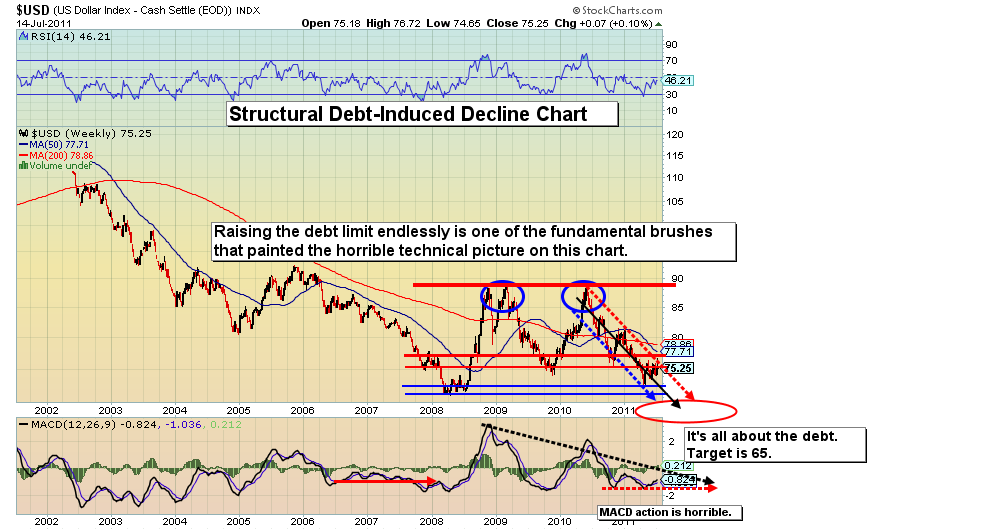
US Dollar Chart
Dollar Commentary
- The US government is now borrowing $40 for every $100 it spends. Raising the debt ceiling is a problem, not a solution. The cuts to government spending required to actually fix the debt problem could produce chaos.
- Moody’s Investors Service just put the U.S. under review for a credit rating downgrade. The August debt ceiling deadline approaches, and there is no deal between congressional leaders and the administration. The bottom line is the dollar is in enormous trouble, and technical analysis of the price chart shows just horrible the situation is.
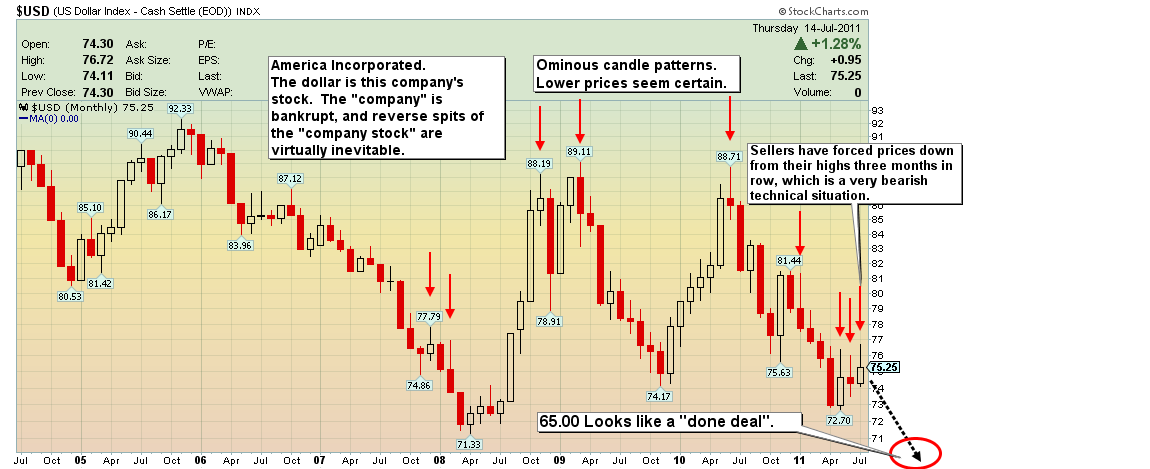
US Monthly Dollar Chart
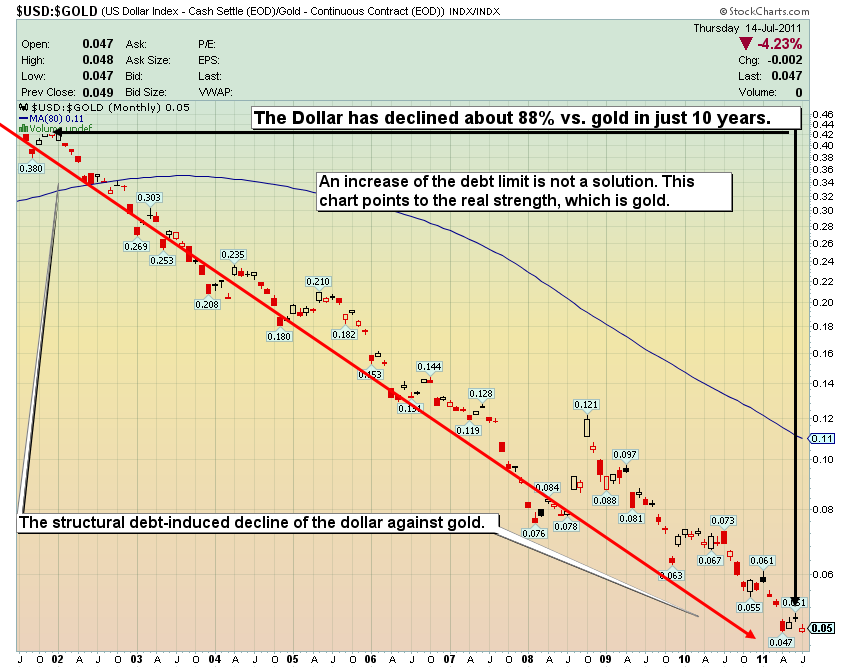
- The dollar is in trouble against gold, silver, crude oil, corn, natural gas, and the list goes on and on. I also project the dollar lower against other fiat currencies. Note my dollar versus gold chart below. My timeline for a new major down leg in the dollar continues to look like fall 2011.
US Dollar Versus Gold Chart
Gold Analysis
- With such strong performance in the last few days, it may be hard to believe that the metals are still undervalued. My favourite sectors now are silver, but only on price weakness, and gold equities, in the form of diversified ETFs like GDX and GDXJ.
- Long term fundamentals are the cornerstone of sound personal finance and portfolio management. To succeed one needs the tools and insight to look beyond the next week or two. I believe that a precious metals mania is coming, and that will push precious metals much higher against the dollar, but it will be a mania of fear caused by the ongoing implosion of the debt bubble.
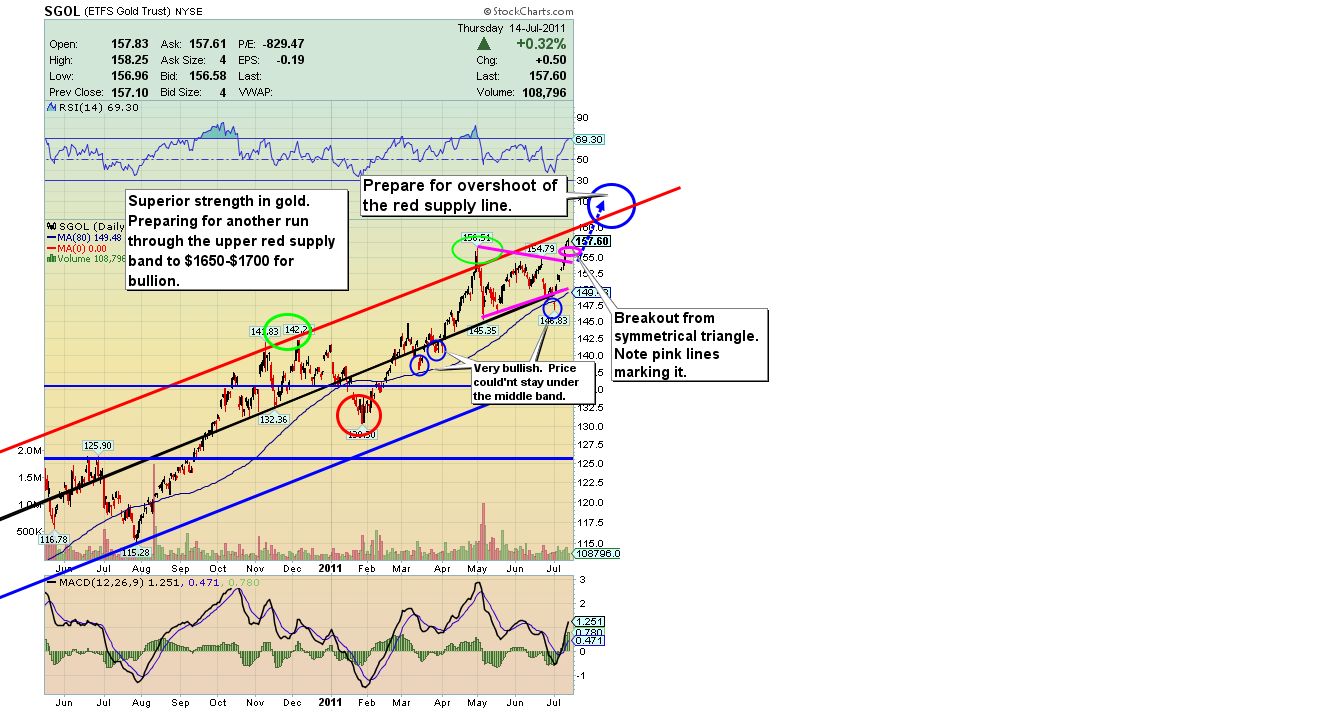
SGOL (Gold Bullion Proxy) Chart
- The above gold chart demonstrates the ultra-strength of gold, and the overshoot I project to $1650-$1700 could occur by August.
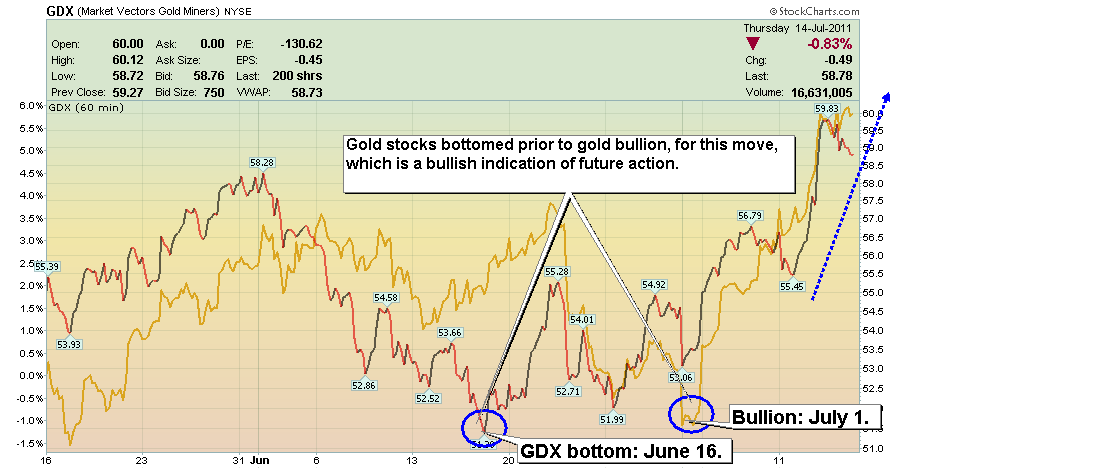
GDX vs Gold Chart
- The above chart showcases classic gold sector technical action at an intermediate bottom. One of the most important events in precious metals trading happened between June 16th and July 1st. Note that the above chart shows gold stocks bottomed prior to gold bullion. This is very bullish, and is exactly the way the gold sector bottomed in January. Then the market advanced smartly, as it is now.
- The main difference between the current situation and the one in January is the current 2 year low in market sentiment. The negative sentiment projects that this intermediate up trend could dwarf the 20% move that occurred in January.
- A leading indicator that helped me identify the bottom in the sector is the gold:silver ratio spike. Since the signal alerted me that a bottom could be in for silver, gold has resumed its leadership.
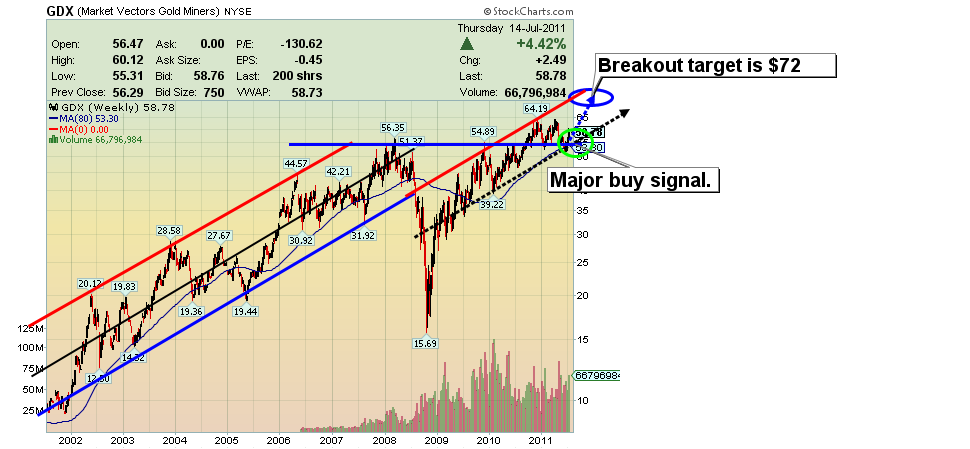
GDX Weekly Chart
- If you are under-invested in gold stocks, look at the above chart. It’s not too late to get involved in gold stocks by any means.
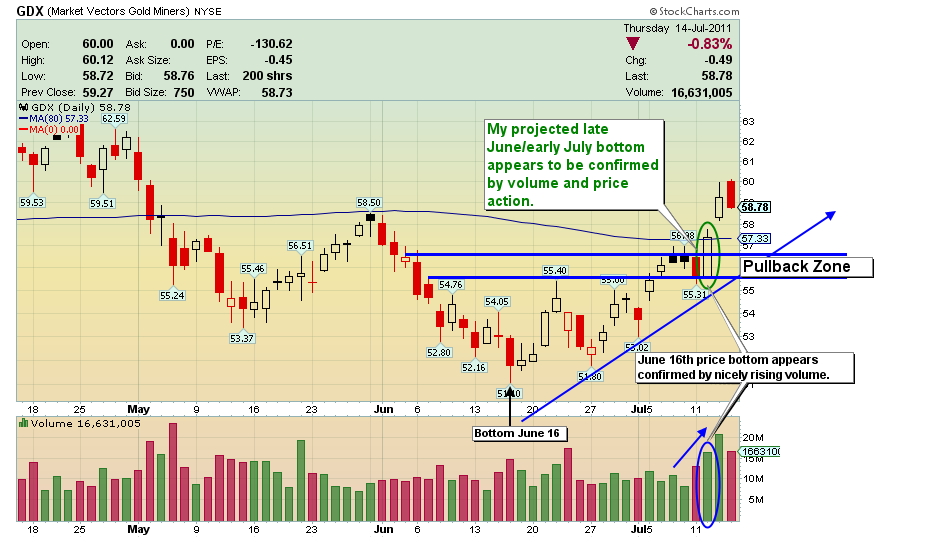
- Gold stocks performed like champions on Tuesday and particularly on Wednesday, as US general equites were down that day. Gold stocks were up in excess of 6% in two trading days, another sign that this rally could be very powerful in both time and price.
- I am forecasting that this uptrend will last 2-4 months for gold stocks, and we are already off to a great start. I urged you to buy into the late June/early July lows and that buying is paying off handsomely now. Impressive volume accompanied the move on Wednesday, as you can see on the chart.
GDX Volume Confirmation Chart
- Another very bullish feature of the current gold stocks price action is that no pullback has occurred. Normally you will see up to 60% of the rally given back, in the early stages of a move. This usually happens because of nervousness and disbelief. This pullback could still come, and I am targeting the $55-$56 area for a pullback target, while holding December as the timeframe for the upper price target to be acquired.
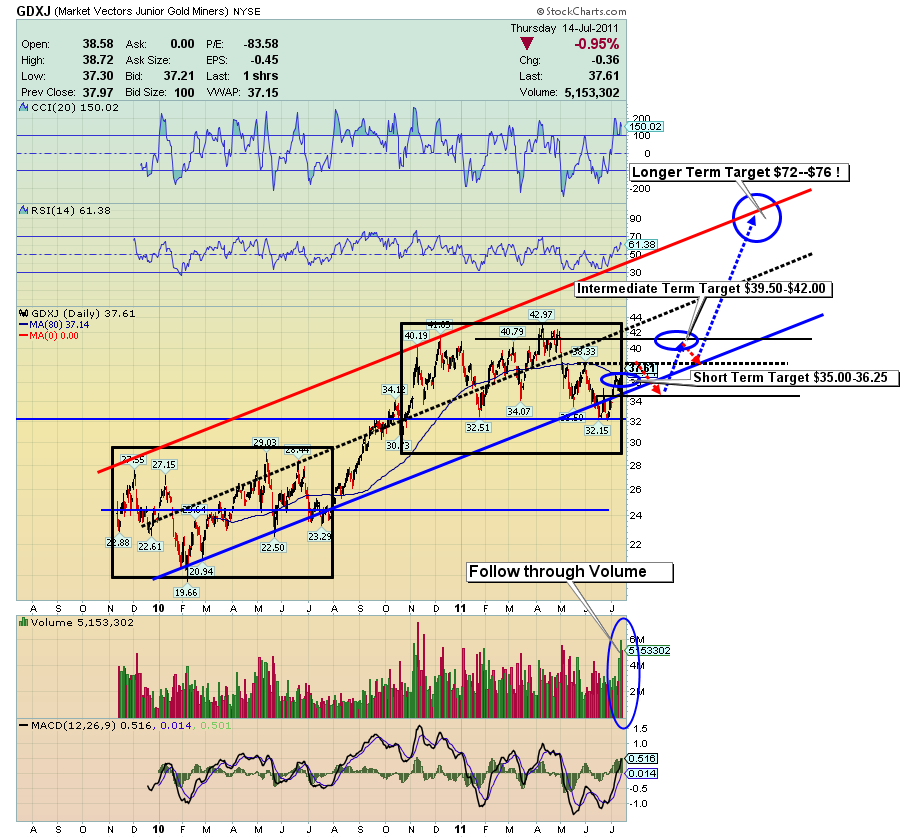
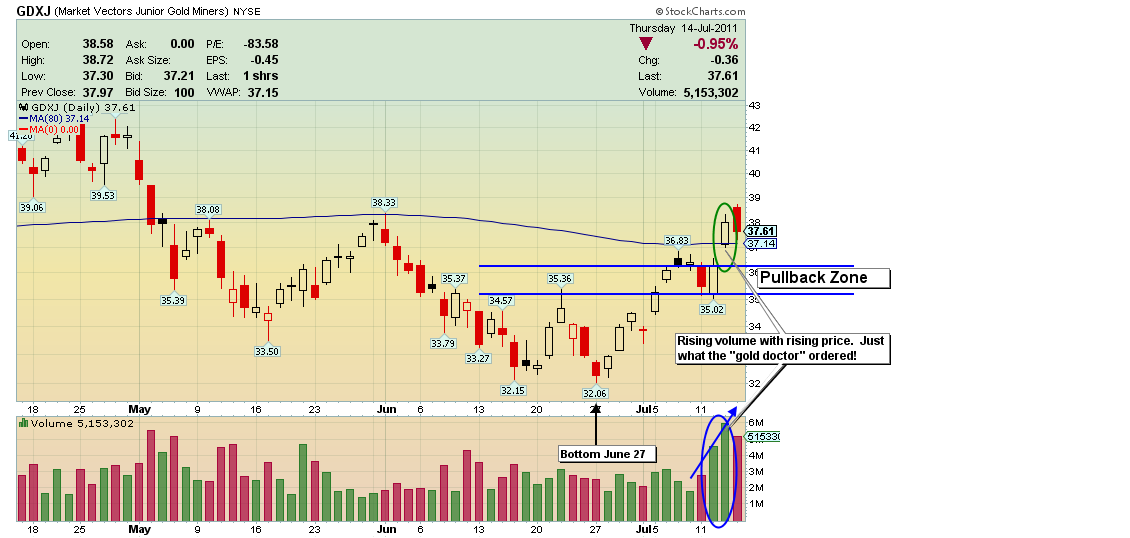
GDXJ Bull Set-Up Chart
- I’ve included short and intermediate term price targets, and I believe the upper band will likely be tagged by late 2011. My work continues to point to $1650 -$1700 gold as the intermediate term target. Pullbacks are shallow which indicates price overshoot is a great likelihood. The $72-$76 price targets look solid for December 2011.
GDXJ Volume Confirmation Chart
- Follow through moves can be one of the most important technical features of a rally. The move with volume highlighted above is a standout example, and it sets the table for an above average move higher.
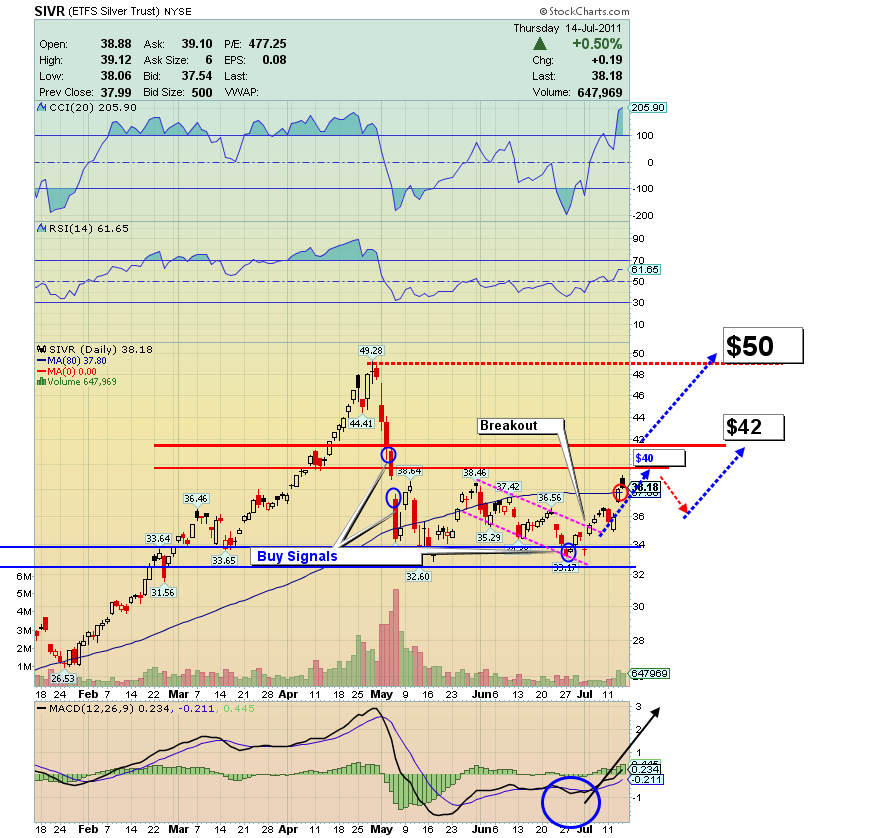
SIVR (Silver Bullion Proxy) Chart
- Be professional in your market actions. Silver could correct a fair bit here before resuming the up move. In the bigger picture, I was recently in a metals shop talking with a regular buyer of scrap silver. According to him, the public is now in the process of liquidating granny’s silverware sets. Huge volume is coming in his door and silver is being sold for cash, not bought. That’s a very bullish fundamental, longer term. The dealer proceeded to tell me that this type of selling had been going on for over a year. People are hurting financially, and selling silver to pay the bills. This is not the action that occurs at a silver market long term top, in my opinion.
- I’m projecting a drop from about $40 to $36, and that could be enough scare you out, if you are buying now. Be patient, please!
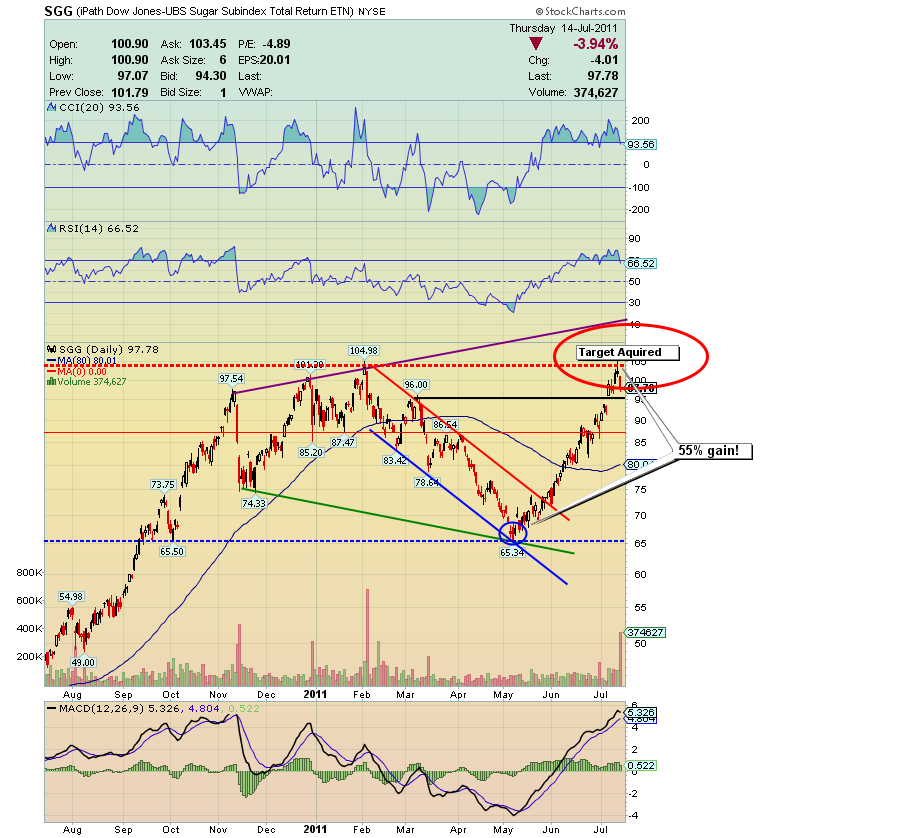
SGG (Sugar Proxy) Chart
- This commodity is red hot and will not pullback. Be stingy in the amount you are selling, as it may just keep going. Now is a time to hold a core position, and patiently wait for renewed weakness before adding new positions. If you don’t own this commodity now (but I hope you already do) don’t buy here, as at this point I prefer cotton as the next commodity that could go from correction to red-hot on the upside! Thank-you, MH.
Friday, Jul 10, 2026 Super Force Signals Unique Introduction For 321Gold Readers:
Send me an email to admin@supergoldsignals.com and I’ll send you my free “Inflation Thunder Now!” gold and silver stocks video report. I’ll also include 3 of my next Super Force Surge Signals free of charge, as I send them to paid subscribers. Thank you!
|
Stay alert for our Super Gold alerts, sent by email to subscribers,
for both the daily charts on Super Force Signals at www.supergoldsignals.com and for the 60 minute
charts at www.supergoldsignals.com
About Super
Gold Signals:
Our Surge Gold Signals are created thru our proprietary blend
of the highest quality technical analysis and many years of successful
business building. We are two business owners with excellent synergy.
We understand risk and reward. Our subscribers are generally successfully
business owners, people like yourself with speculative funds,
looking for serious management of your risk and reward in the
market.
Frank Johnson:
Executive Editor, Macro Risk Manager.
Morris Hubbartt: Chief Market Analyst, Trading Risk Specialist.
website: www.supergoldsignals.com
email:
admin@supergoldsignals.com
email: admin@supergold60.com
Mail:
1276 Lakeview Drive
Oakville, Ontario, L6H 2M8
Canada
###
Jul 15, 2011
Morris Hubbartt
321gold
Ltd
|
