Super Force Signals - A Leading
Market Timing Service
We Take Every Trade Ourselves
USD & Gold Momentum Shift
Morris Hubbartt
Weekly Market Update Excerpt
posted Jul 13, 2012
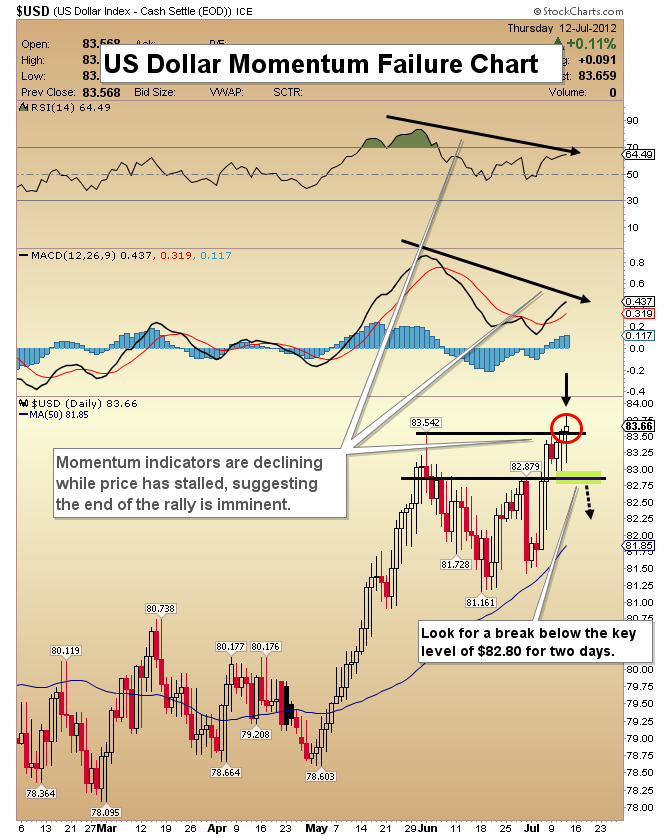
US Dollar Momentum Failure Chart
- Since gold topped out last August, the dollar and bonds have ruled the major markets. The trend in the dollar and the US bond markets has remained positive, but there are quite a number of technical divergences beginning to appear.
- Momentum indicators are declining, and price has stalled. Confirmation of a trend change will happen when the dollar closes below the key 82.80 mark for two consecutive days.
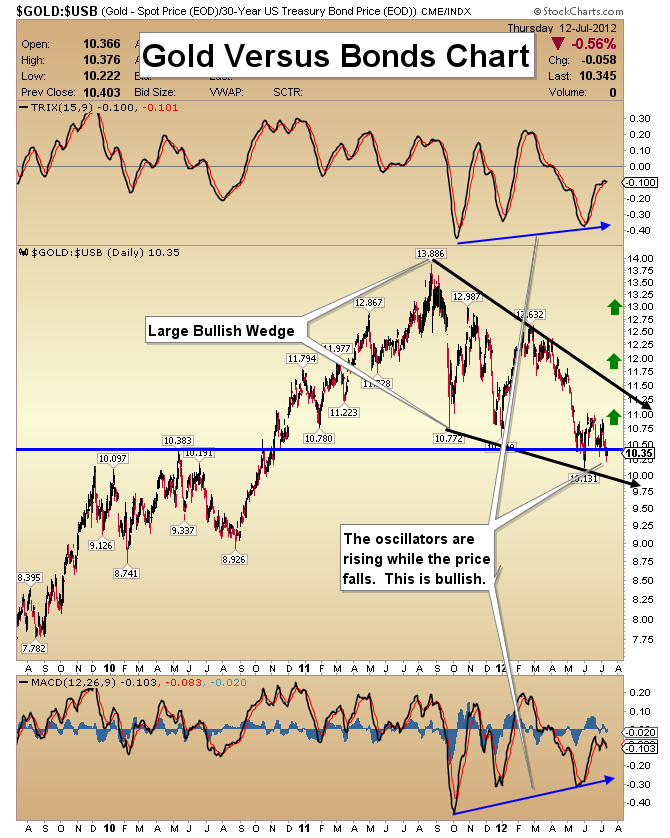
Gold Versus Bonds Chart
- This chart highlights the recent outperformance of bonds against gold. Is the US bond market nothing more than a dry hole? Due to the devaluation of the dollar, bond investors could suffer negative returns over time.
- I believe the bond and the dollar are both becoming “hot money trades”, rather than high quality investments held for the long term. Money flows into ultra-low yielding bonds to sidestep a crisis, or to gain from a price run-up in bonds.
- The dollar and the bond are beginning to show characteristics that are somewhat similar to the NASDAQ, before it collapsed.
- A very large bullish wedge has formed on this ratio chart, suggesting that gold may soon begin rising aggressively against bonds.
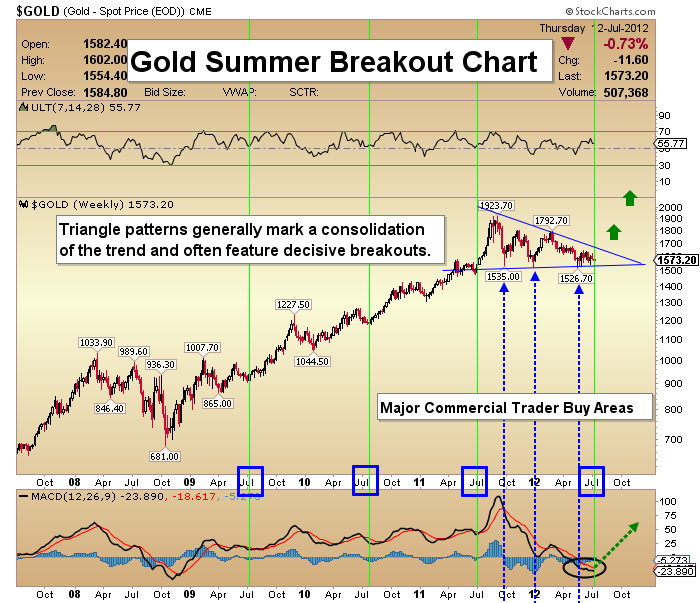
Gold Summer Breakout Chart
- Divergences move ahead of price action and that is happening across the major markets board. Now is the time to position yourself in gold.
- My next major target for gold is $1850. Progress continues to be made, as MACD is very close to turning up on this weekly chart.
- Please note the four blue boxes that I have highlighted on the timescale of the chart. Over the last three years, gold has put on its strongest rally in the summer, and the market appears to be setting up to put on a “showstopper move” this time.
- The triangle formation is enormous, and gold is sitting at the ideal point for a textbook-style breakout to occur.
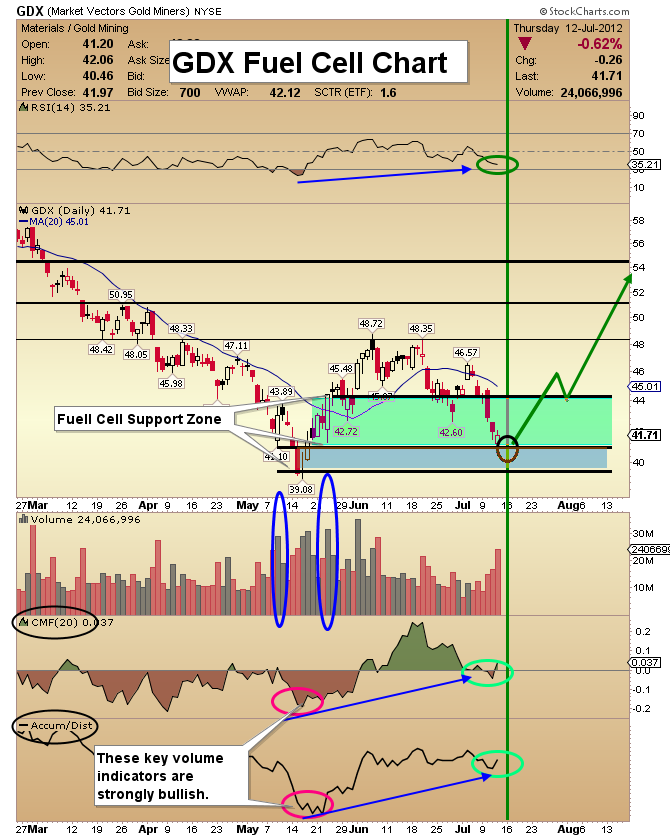
GDX Fuel Cell Chart
- I am focusing on my fuel cell volume indicator (FCV). Initially, gold stocks began forming an inverse head & shoulders pattern. Two weeks ago I suggested the possibility of that changing into a double bottom formation.
- The price action this week has created that double bottom.
- A textbook double bottom needs to adhere to the following criteria: First, the second leg down should take place about two months after the initial low, which is the case here.
- Secondly, volume needs to be considerably less around the 2nd low than the first low, and it is.
- The bottom line is that gold stocks are probably putting in a major bottom, one that will deliver substantial returns for several years to come. Hold your positions, and buy any additional weakness if you have available capital.
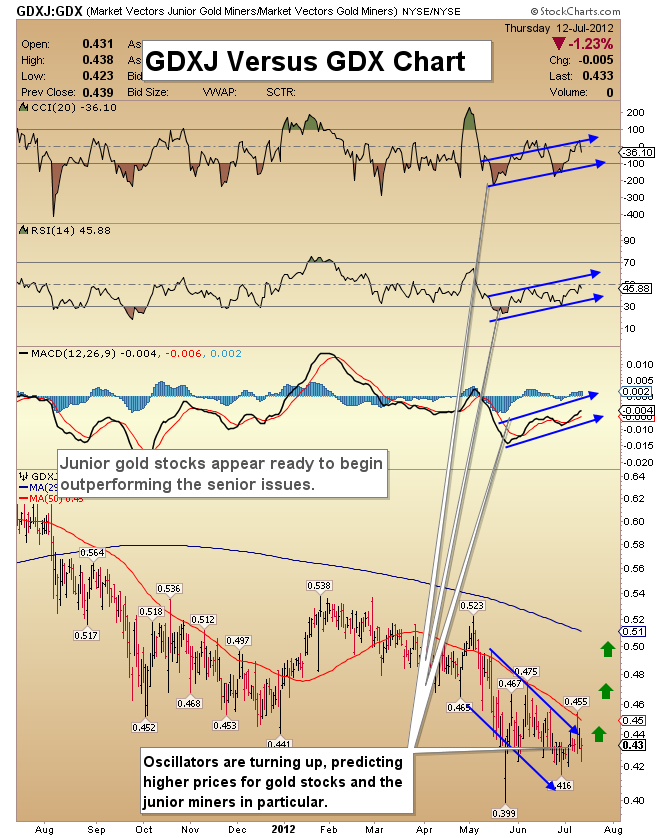
GDXJ Versus GDX Chart
- Typically, when there is outperformance by the junior mining companies, this is a positive sign for the sector as a whole.
- It’s becoming clear to me that senior mining companies will struggle to provide the physical metal needed in today’s ongoing gold bull market. Goldcorp, Kinross, and Agnico Eagle are three examples of senior gold stocks that have recently faced big production line challenges.
- One way for the senior companies to get more reserves, is to buy up the junior companies, and that will eventually put a strong bid under the whole sector.
- My favorite tool to own the junior sector is GDXJ. Note the bullish action of CCI, RSI, and MACD.
- As the seniors purchase more and more junior entities, I expect GDX to begin rising very strongly, because the senior gold companies have the deep pockets and experience required to start gold production quickly.
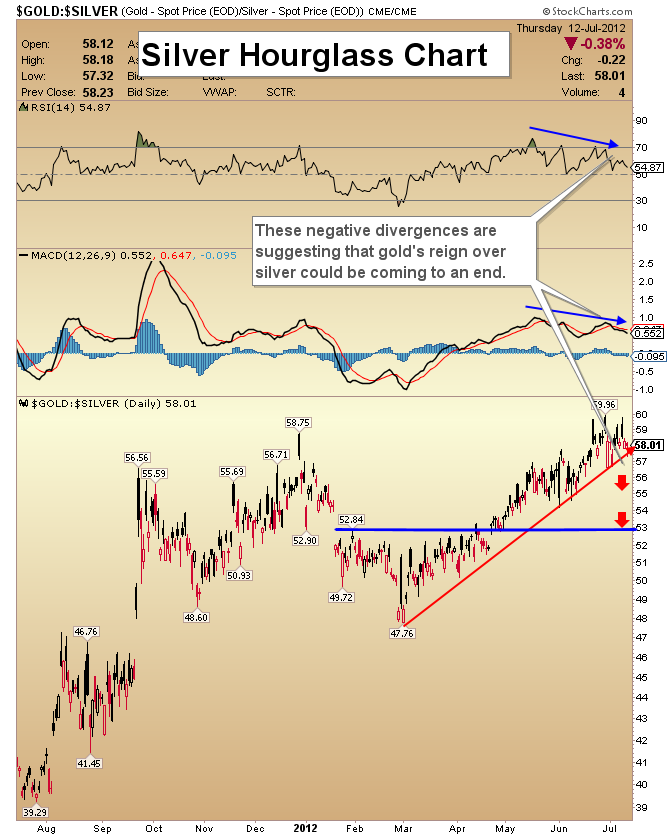
Silver Hourglass Chart
- Silver has consistently underperformed gold throughout the corrective process in precious metals. Growing technical divergences suggest that very little sand remains in gold’s “outperformance hourglass”.
- Note the action of the RSI oscillator and the MACD indicator. Both are sliding lower, while the gold ratio continues to rise. My first target is 53.
- From there, I am expecting a pullback to the red uptrend line, and then a more extended decline down to about 47. At that point, it would take 47 ounces of silver to buy 1 ounce of gold, versus the approximately 58 ounces that it takes now.
- The gold:silver ratio chart suggests that silver is a very strong buy at current prices!
Friday, Jul 3, 2026 Super Force Signals Unique Introduction For 321Gold Readers:
Send me an email to admin@supergoldsignals.com and I’ll send you my free “Inflation Thunder Now!” gold and silver stocks video report. I’ll also include 3 of my next Super Force Surge Signals free of charge, as I send them to paid subscribers. Thank you!
|
Stay alert for our Super Gold alerts, sent by email to subscribers,
for both the daily charts on Super Force Signals at www.supergoldsignals.com and for the 60 minute
charts at www.supergoldsignals.com
About Super
Gold Signals:
Our Surge Gold Signals are created thru our proprietary blend
of the highest quality technical analysis and many years of successful
business building. We are two business owners with excellent synergy.
We understand risk and reward. Our subscribers are generally successfully
business owners, people like yourself with speculative funds,
looking for serious management of your risk and reward in the
market.
Frank Johnson:
Executive Editor, Macro Risk Manager.
Morris Hubbartt: Chief Market Analyst, Trading Risk Specialist.
website: www.supergoldsignals.com
email:
admin@supergoldsignals.com
email: admin@supergold60.com
Mail:
1276 Lakeview Drive
Oakville, Ontario, L6H 2M8
Canada
###
Jul 13, 2012
Morris Hubbartt
321gold
Ltd

|
