Super Force Signals - A Leading
Market Timing Service
We Take Every Trade Ourselves
The Great Gold & Silver Summer Is Technically Here!
Morris Hubbartt
Weekly Market Update Excerpt
posted Jul 8, 2011
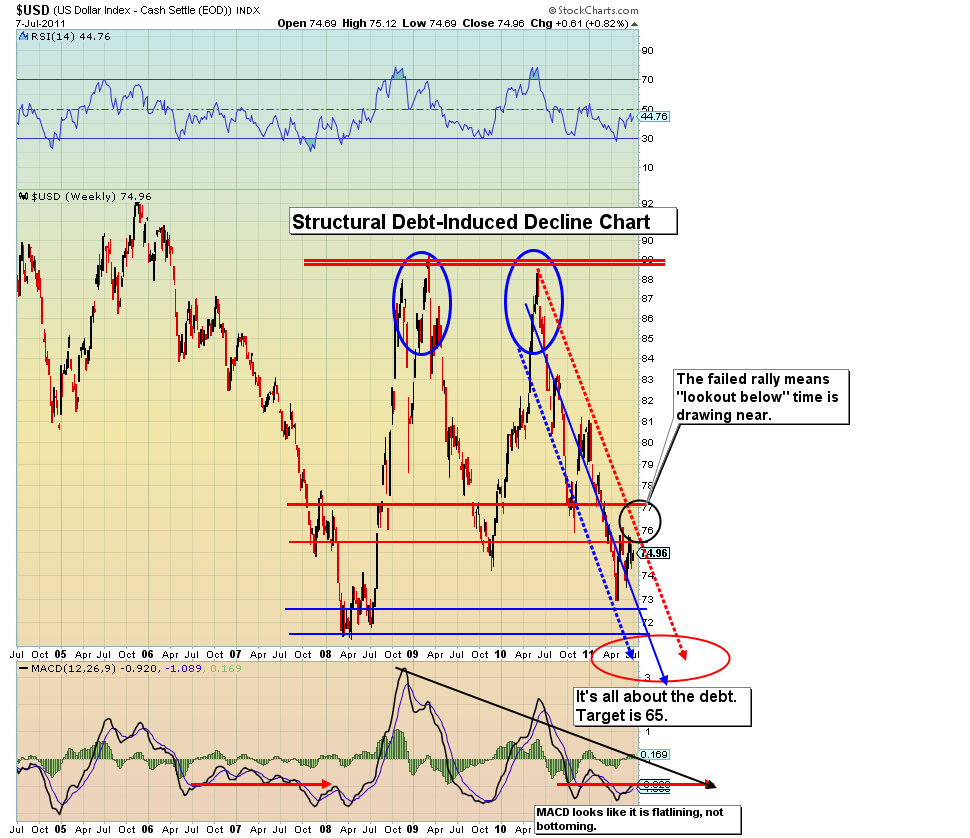
US Dollar Chart
Dollar Commentary
- I warned you about getting obsessed with a US dollar rally. When a market should go up and it can’t, it spells problems in the very near future.
- The Greece mess has probably been postponed for another day. The entire western world is using the same financial playbook, which is to pretend that somehow the ballooning debts can be paid, when in reality they never will be, at least not with honest currency.
- Gold is called honest currency because a gold currency debtor must repay the gold currency creditor exactly what he is owed. With an electronic printing press, a dollar debtor can cheat the creditor, and that is what is going on now with the world’s reserve currency, on an unprecedented scale.
- My technical work projects new lows for the dollar are coming, and I expect the next leg of the decline to begin in the fall of 2011, with a price target of 65 on the $USD index chart. The key level to watch is $72.50.
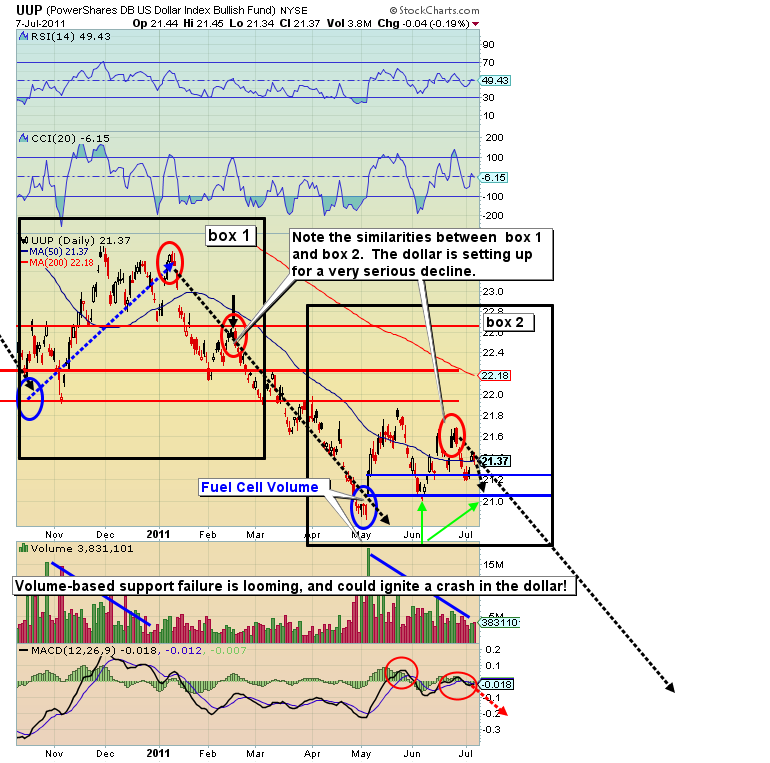
UUP Chart (US Dollar Proxy)
- This chart demonstrates the major risk the dollar has of violating volume-based support. This action is technically unhealthy, and warns of a serious selloff down the road. This key area was nearly violated soon after my fuel cell buy signal occurred. Now failure of that price looks likely again.
- The more that an area of support is tested, the more likely it will be to fail. The bigger the volume in that area, the bigger the decline that could follow failure of that support. I don’t think that most investors realized how perilous the position of the dollar is right now, technically, and what that means on the upside for your gold investments!
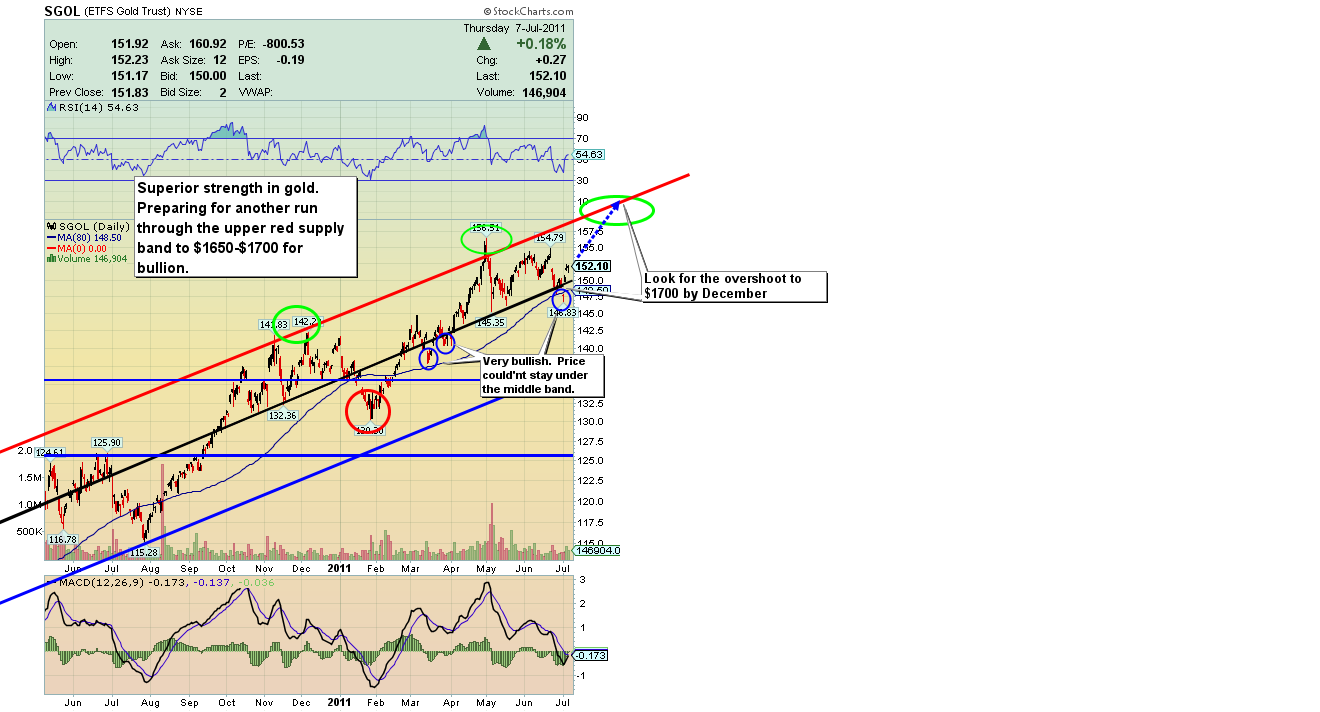
SGOL (Gold Proxy) Chart
- Two weeks ago I said, “I continue to call for a breakout in precious metals in the late June to early July timeframe, with new highs projected at around $1650 for gold bullion. My internal indicators are pointing to new highs in the August timeframe for gold.”
- The powerful upside action in the gold market over the past week is just a small (but juicy) taste of what likely lies ahead for your gold stocks. Volatility will increase and devour most trading systems that wait for some kind of breakout, and then try to climb aboard and ride to higher prices. That may have worked in the past, but it is not likely to work in this stage of the gold bull market.
- Gold bulls should beware of thinking you can outsmart the bull market itself. The vast majority of traders cannot succeed and the history books are filled with examples of those who tried and failed. After many months of consolidation and correction, the gold sector is preparing for takeoff!
- I think your game plan should be to trade up to 35% of your gold assets, and use some of the profits to add to your core position. My recommendation is to hold a 65% core position in gold. That is put in the vault for years, and sold only when prices are multiple times higher than they are now. Do not be in a hurry to “need” higher gold prices. Instead, be in a hurry to vault your core positions.
- Very little chart damage has been done to gold, yet sentiment is terrible, with “2008 again” calls everywhere. I’m expecting my forward targets to be achieved relatively soon, because of the level of this negativity. This is not a normal bull market. Normal money flows into a bull market are normally based on greed. I expect gold to accelerate on the upside when the public panics as they finally understand the magnitude of the debt problem.
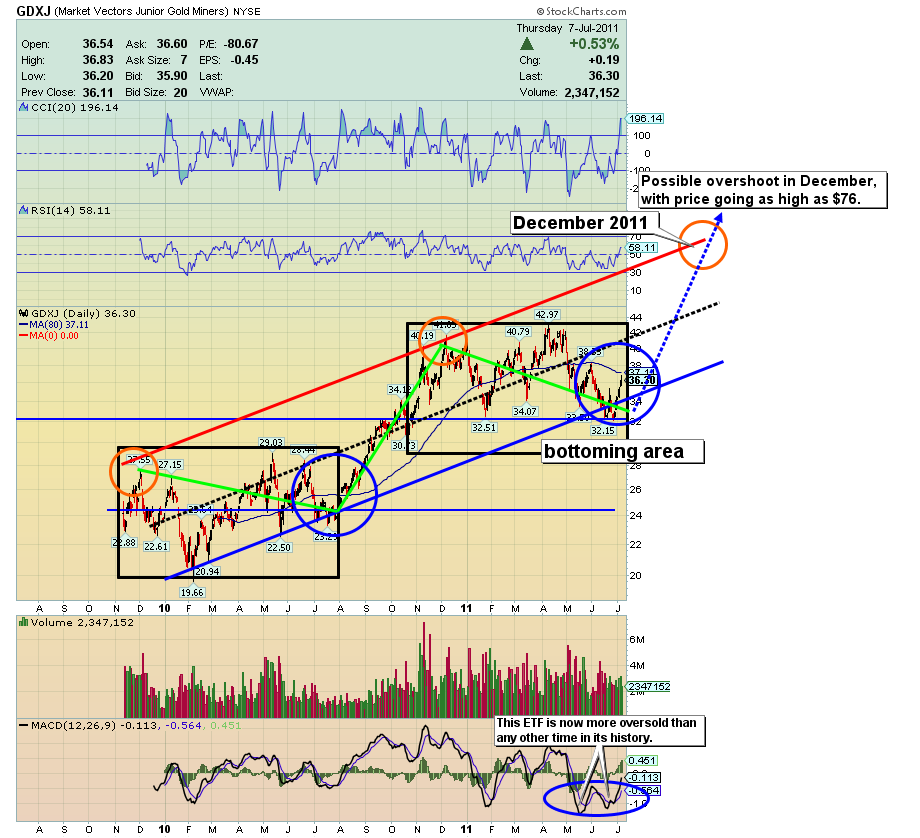
GDXJ Bull Set-Up Chart
- I have been speaking of a late June/early July bottom and ensuing rally in the gold stocks, and that is exactly what is happening now. While I have issued some profit-taking signals over the past couple of days, if you are not in gold stocks it is not too late to buy, as I think the sector is going higher. The technical set-up on the GDXJ is phenomenal!
- A look at the GDXJ chart without a doubt shows the action of a bull market; huge moves higher followed by corrective action down to the trend line. The correction in gold stocks and the negative emotion that has been evident makes it worth taking a look at what I see coming for gold juniors, which is much higher prices.
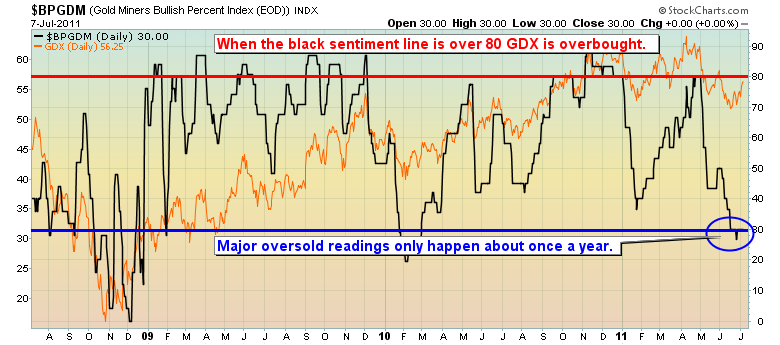
Gold Miners Bullish Percent Index Chart
- Yet another measure of the oversold nature of gold stocks is provided by the bullish percent index chart of the gold miners. These stocks are trading in the lower price zone at levels generally seen only about once a year. Gold stocks have a lot of room to run to the upside.
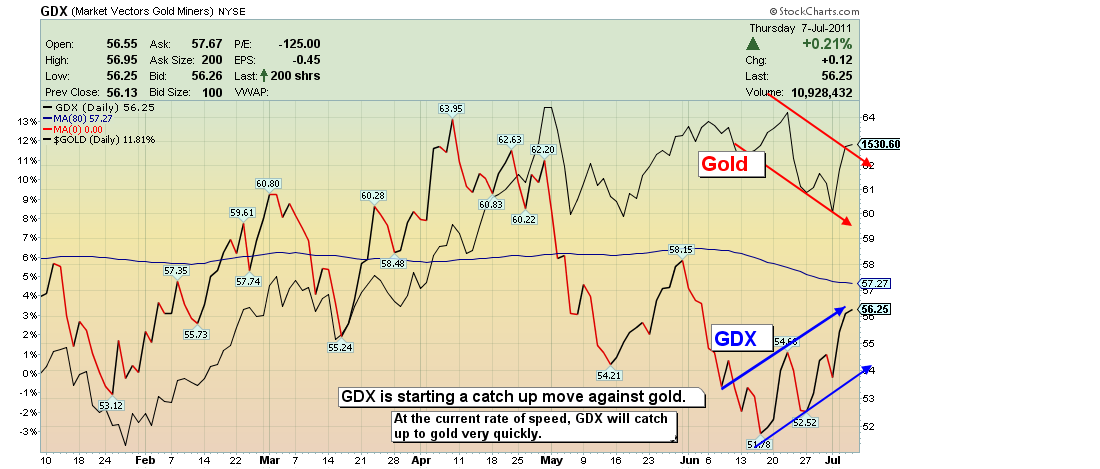
GDX Versus Gold Chart
- This chart shows how easily and quickly gold stocks can surpass the performance of gold bullion against the dollar price of gold. As more and more people demand gold, there are only two solutions; higher prices for gold and mining more gold. This means more demand for the miners, which will drive prices much higher.
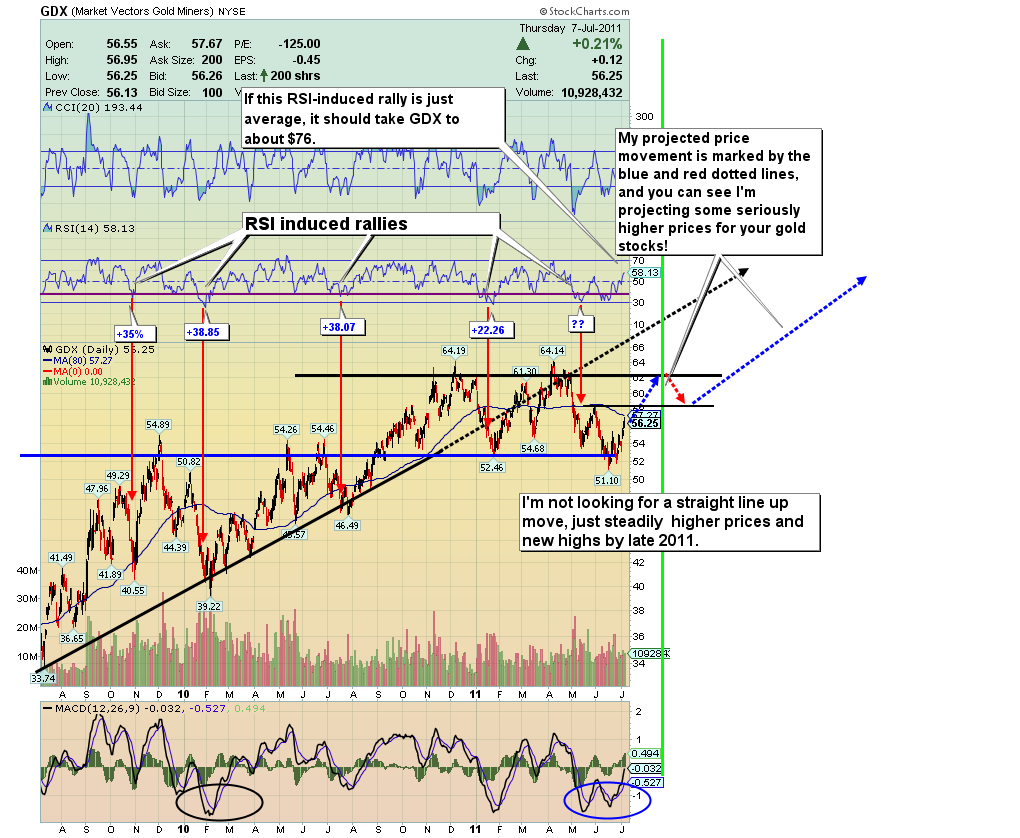
GDX RSI-Induced Rallies Chart
- One of the most significant charts explaining the situation in the gold stocks is the above RSI chart. I’m targeting the $60-62 target initially, followed by a move to new highs. This move will not go straight up, but will be more of a process over the next several weeks. I’m targeting $72 later in the year.
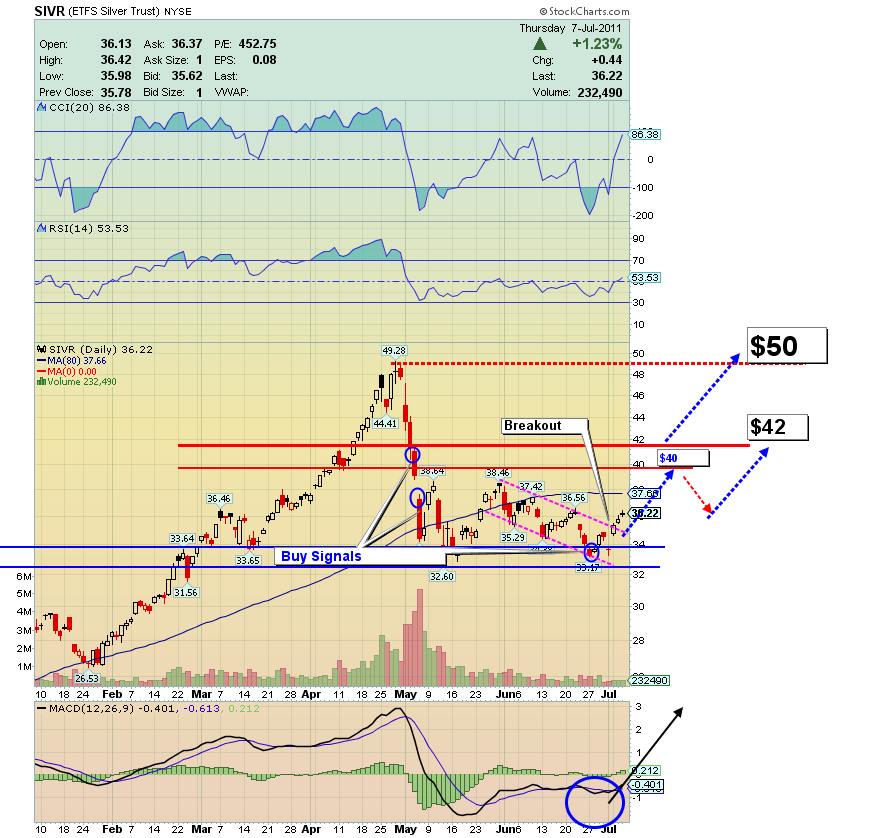
SIVR (Silver Proxy) Chart
- Note the breakout. That’s good news. I never advocate backing up the truck on one price point, but if you don’t have any money in silver, the doors of opportunity are closing.
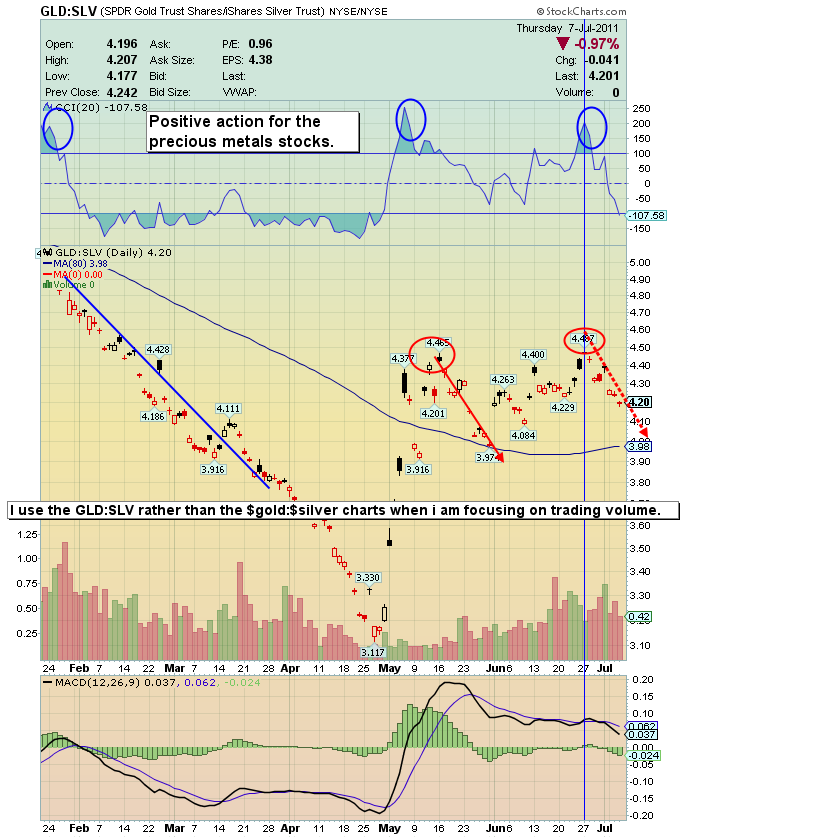
GLD:SLV Ratio Chart
- The spiking CCI indicator over 200 is something I want you to look at on the above ratio chart. The CCI is a powerful indicator, and you will hear me use the term “spike” quite often. The CCI is an indicator that is most reliable when it oscillates quickly, rather than meanders. For calling turns, a spiking CCI is a good indicator. The GLD:SLV ratio chart indicates to me that silver will outperform gold in the short term. Focus more risk capital on silver than gold, for now, but know that your risk with silver is substantially higher than with gold, due to the intense volatility.
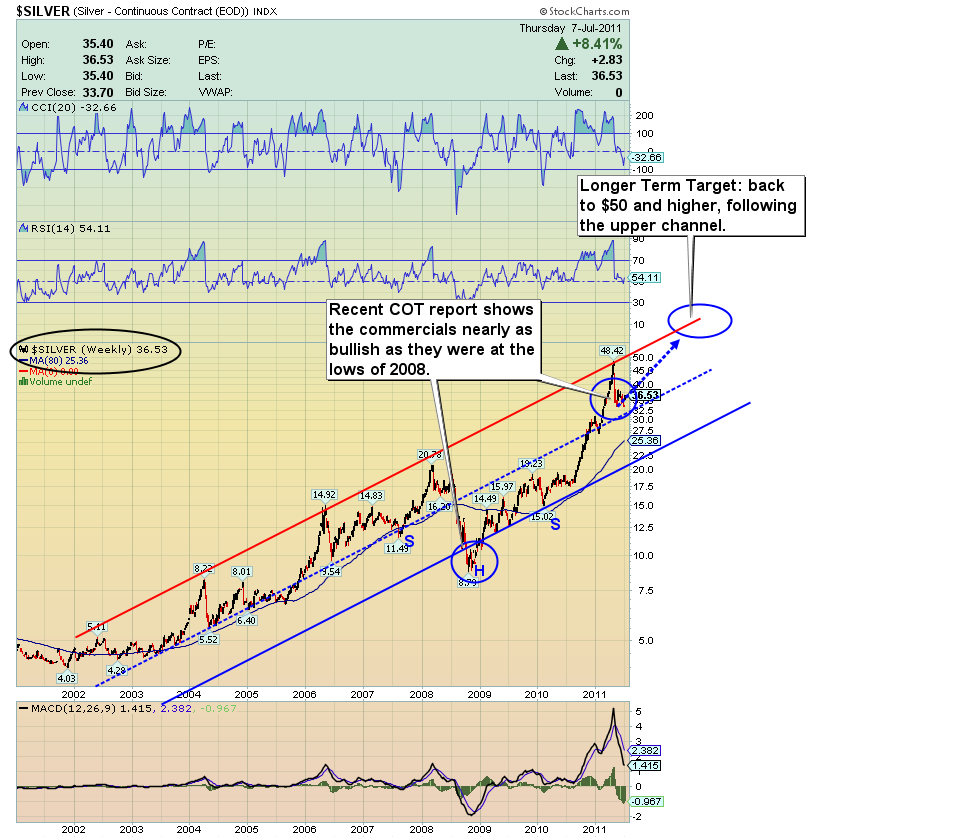
Silver Long Term Channel Chart
- Silver has just recently climbed back above the center uptrend line. The COT report has been quite bullish since the one week 35% correction occurred.
- With the Western world staggering under the greatest load of debt ever seen in human history, gold continues to be the asset of choice, but I am very positive on silver as well. I can’t rule out a fall to the $23 area or lower for silver, but I think that scenario is highly unlikely.
- I have been a solid buyer of physical silver all the way down through this decline and if I’m dead wrong and we go to $23, then I’ll buy even more.
- My technical work suggests the bottom for gold and silver was put in as I predicted, in the late June/early July timeframe. It could be a surprisingly great summer for silver investors. Remember, if you’ve sold gold stock and silver, that’s understandable, but it’s not too late to get back in, and I think you should do so. Thank-you!
Friday, Jul 24, 2026 Super Force Signals Unique Introduction For 321Gold Readers:
Send me an email to admin@supergoldsignals.com and I’ll send you my free “Inflation Thunder Now!” gold and silver stocks video report. I’ll also include 3 of my next Super Force Surge Signals free of charge, as I send them to paid subscribers. Thank you!
|
Stay alert for our Super Gold alerts, sent by email to subscribers,
for both the daily charts on Super Force Signals at www.supergoldsignals.com and for the 60 minute
charts at www.supergoldsignals.com
About Super
Gold Signals:
Our Surge Gold Signals are created thru our proprietary blend
of the highest quality technical analysis and many years of successful
business building. We are two business owners with excellent synergy.
We understand risk and reward. Our subscribers are generally successfully
business owners, people like yourself with speculative funds,
looking for serious management of your risk and reward in the
market.
Frank Johnson:
Executive Editor, Macro Risk Manager.
Morris Hubbartt: Chief Market Analyst, Trading Risk Specialist.
website: www.supergoldsignals.com
email:
admin@supergoldsignals.com
email: admin@supergold60.com
Mail:
1276 Lakeview Drive
Oakville, Ontario, L6H 2M8
Canada
###
Jul 8, 2011
Morris Hubbartt
321gold
Ltd
|
